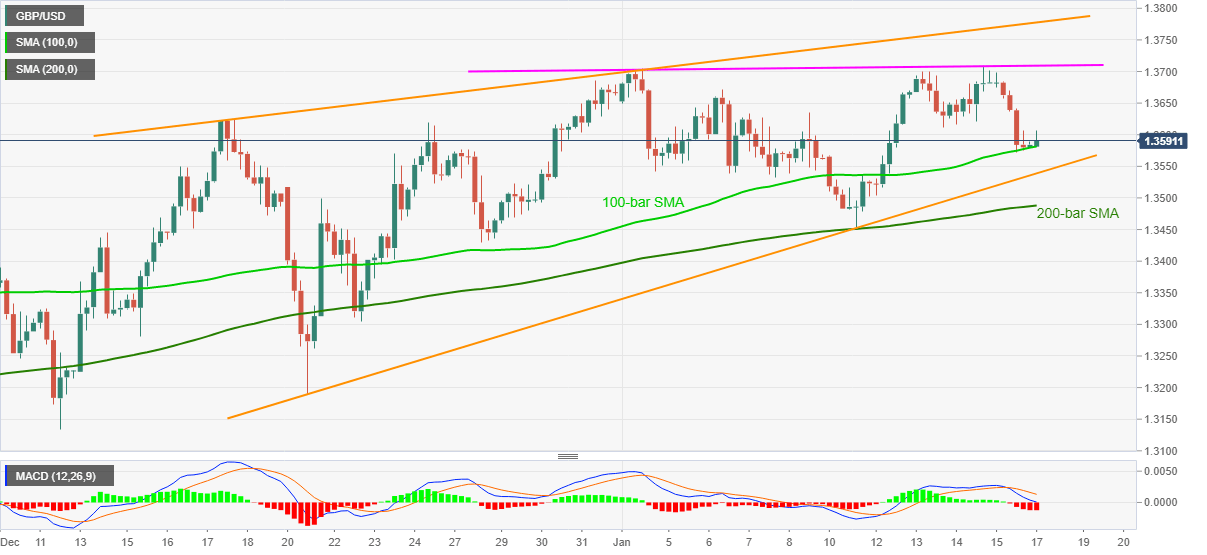
GBP/USD Price Analysis: Battles 1.3600 inside monthly rising wedge on 4H
- GBP/USD takes a U-turn from intraday top, struggles to stay beyond 100-bar SMA.
- Bearish chart pattern takes clues from downbeat MACD conditions, failure to cross two-week-old resistance.
- 200-bar SMA adds to the downside filters, 1.3800 offers an additional upside hurdle.
GBP/USD fails to keep the uptick beyond 1.3606, currently around 1.3590, during the initial Asian trading on Monday. The cable dropped to the lowest since January 12 on Friday but couldn’t slip beneath the 100-bar SMA. However, rising wedge formation on the four-hour (4H) chart joins bearish MACD conditions to keep sellers hopeful.
Not only 100-bar SMA near 1.3580 but 200-bar SMA around 1.3485 also acts as an extra barrier for the GBP/USD sellers’ entry even if they manage to confirm the stated bearish formation by breaking 1.3535 pattern support.
It should be noted that the monthly low of around 1.3450 and the previous month’s low close to 1.3130 will probe the GBP/USD bears targeting the theoretical signal from the rising wedge, around 1.3000 round-figure.
Alternatively, 1.3615 and 1.3670 can entertain short-term buyers ahead of challenging them by an ascending trend line from January 04, at 1.3710 now.
In a case where GBP/USD buyers manage to cross 1.3710, the stated bearish formation’s upper line near 1.3780 and the 1.3800 threshold can also challenge the quote’s further upside.
Overall, GBP/USD seems to fade the upside momentum and hence sellers should wait for a clear bearish signal for entry.
GBP/USD four-hour chart
Trend: Pullback expected


