Cardano Price Analysis: ADA looks to correct toward $1.1 after renewing record highs
![]()
- Cardano touched a fresh all-time high on Saturday.
- RSI indicator on the daily chart stays in the overbought territory.
- On-chain metrics show strong support aligns around $1.1.
Cardano climbed to a new all-time high of $1.4850 on Saturday but lost its bullish momentum. At the moment, ADA is trading around $1.25, losing around 5% on a daily basis.
Downward correction could extend to $1.1
On the daily chart, the ascending trend line coming from early February is currently forming support around $1.1 ahead of $1 (psychological level/20-day SMA). As long as the price manages to stay above those levels, the next leg down will be seen as a technical correction rather than a shift of trend.
However, a decisive break through that support area could trigger a deep selloff. On the upside, additional gains are likely if ADA makes a daily close above $1.5 (all-time high).
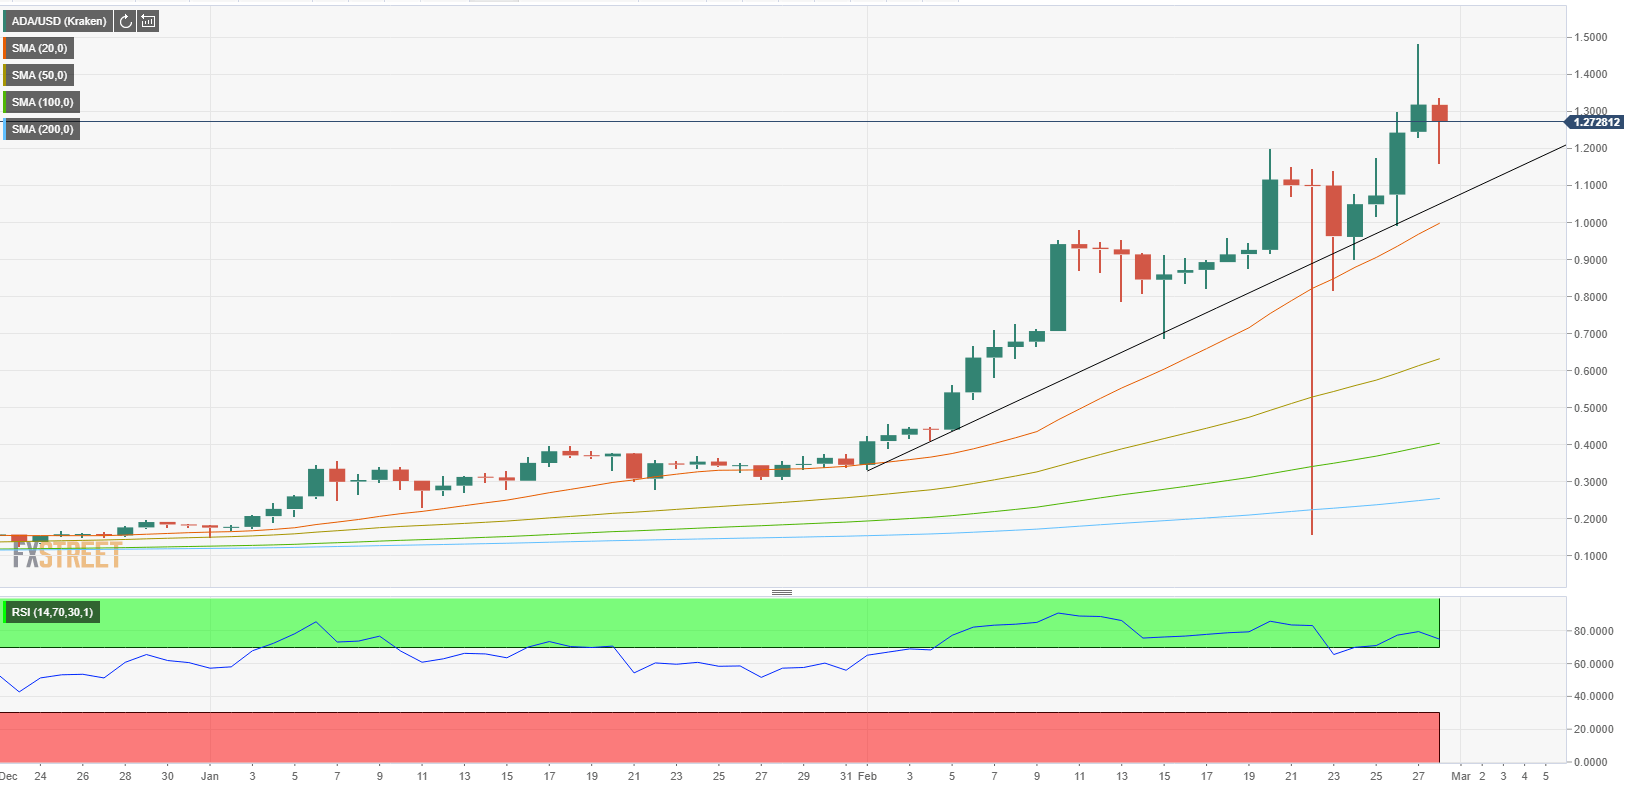
Cardano one-day chart
The lack of significant support areas ahead of $1.1 on IntoTheBlock’s In/Out of the Money Around Price (IOMAP) model reinforces the view that ADA could edge lower toward that area in the near-term. However, the chart shows that 2.36 billion ADA at an average price of $1.13 had been acquired by 60,300 addresses, suggesting that ADA will have a difficult time dropping below that level.
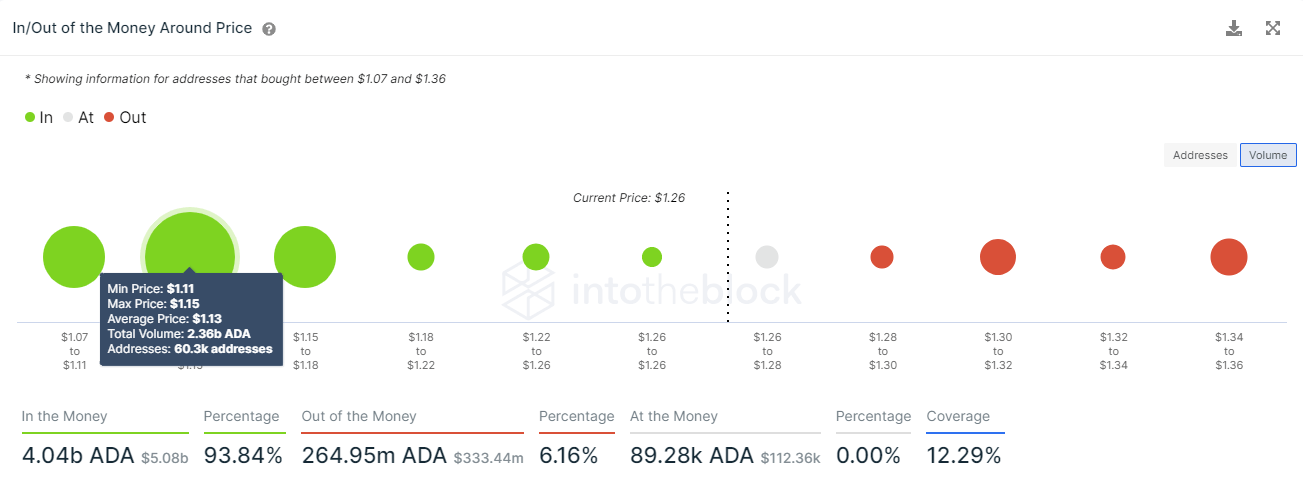 Cardano IOMAP chart
Cardano retreated sharply after surging to a fresh record high on Saturday and eyes $1.1-$1 area as the next target. If buyers manage to keep ADA afloat above that region, the bullish momentum could start to gather strength.