EUR/USD Forecast: Bearish feast despite Treasury yields retreated sharply
![]()
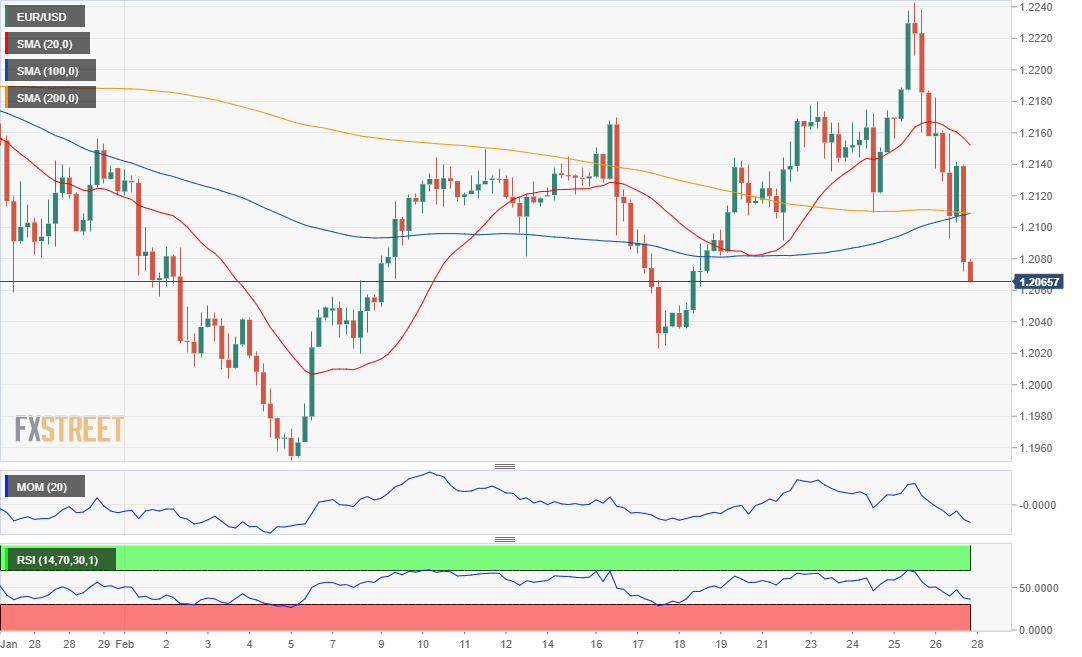
EUR/USD Current Price: 1.2065
- The US House of Representative passed the coronavirus relief bill on Saturday.
- Growth-related data will take center stage at the beginning of the week.
- EUR/USD is technically bearish and poised to retest the February low at 1.1951.
The American dollar finished the week with a firm note against its major rivals, with EUR/USD bottoming at 1.2061 and closing the week in the red a handful of pips above this last. The greenback appreciated despite US Treasury yields retreated sharply. Stocks, on the other hand, persisted in their bearish route, with only the Nasdaq posting an intraday advance. Month-end flows are partially responsible for Friday’s movements.
The US published the preliminary estimate of the January Trade Balance, which posted a deficit of $83.7 billion, slightly better than the December one. Personal Income in the same month was up 10%, while Personal Spending rose just 2.4%. The final version of the February Michigan Consumer Sentiment Index came in at 76.8.
On Saturday, the US House of Representatives passed President Joe Biden’s $1.9 trillion coronavirus relief package by 219-212 votes. Republican support was missing, but the bill moved to the Senate, where it is expected to pass before March 14, when the previous round of stimulus expires.
The macroeconomic calendar will include the final readings of Markit February Manufacturing PMIs for the EU and the US, while the latter will publish the official ISM report, foreseen at 58-9 from 58.7. Germany will publish the preliminary estimate of February inflation.
EUR/USD short-term technical outlook
The EUR/USD pair is trading a few pips above the 38.2% retracement of its November/January rally. A clear break of the support level could see EUR/USD approaching February low at 1.1951. In the daily chart, the pair has settled below a directionless 20 SMA, while a bullish 100 SMA provides dynamic support around 1.2010. Technical indicators head sharply lower, supporting a bearish continuation, as the RSI already crossed into negative territory. The bearish potential is stronger in the near-term, as, in the 4-hour chart, as the pair is now below all of its moving averages, while technical indicators remain near oversold readings.
Support levels: 1.2060 1.2010 1.1970
Resistance levels: 1.2125 1.2170 1.2215
View Live Chart for the EUR/USD