Silver Price Analysis: XAG/USD bulls challenge a key hurdle near $25.50-60 area
![]()
- Silver gained traction for the second consecutive session on Wednesday.
- Mixed oscillators on hourly/daily charts warrant caution for bullish traders.
- A sustained break below the $25.00 mark will negate any positive outlook.
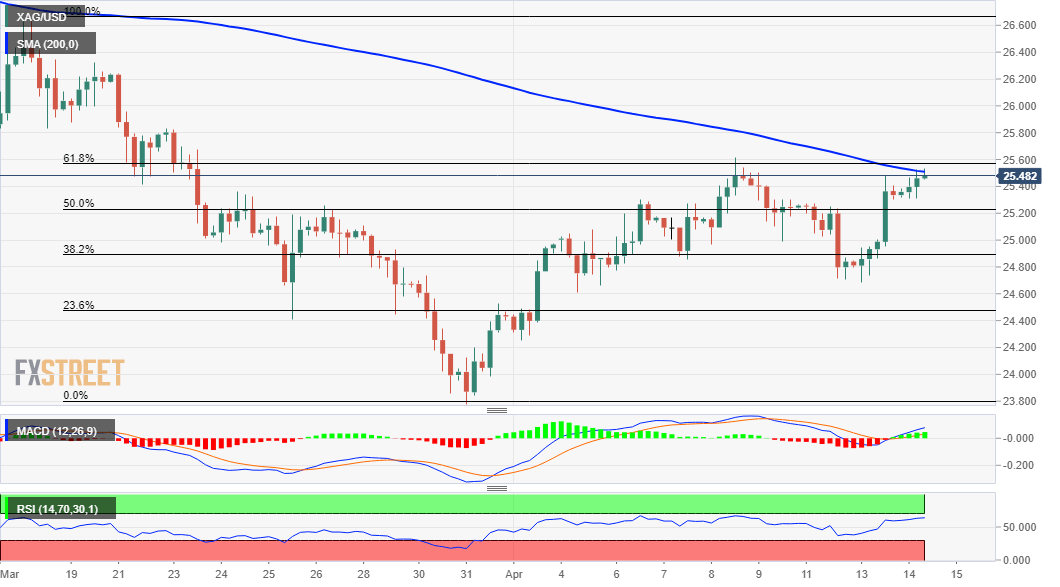
Silver built on the previous day’s strong positive move and edged higher for the second consecutive session on Wednesday. The momentum pushed the commodity back closer to a resistance marked by the 61.8% Fibonacci level of the $26.64-$23.78 decline, around the $25.50-60 region.
Meanwhile, technical indicators on the daily chart have recovered from the negative territory but are yet to confirm a bullish bias. Moreover, RSI on the 1-hour chart has moved on the verge of breaking into the overbought zone, warranting caution for aggressive bullish traders.
Hence, it will be prudent to wait for a sustained move beyond the $25.60 hurdle before positioning for any further appreciating move. The subsequent short-covering move could push the XAG/USD beyond the $26.00 mark, towards the next major barrier near the $26.40-50 heavy supply zone.
On the flip side, the 50% Fibo. level, around the $25.20 region now seems to protect the immediate downside. This is followed by the key $25.00 psychological mark, which if broken decisively will negate the positive outlook and prompted some technical selling around the XAG/USD.
Some follow-through selling below the 38.2% Fibo. level, around the $24.85 region will shift the bias back in favour of bearish traders and turn the XAG/USD vulnerable. The next relevant bearish target is pegged near the $24.45 region, or 23.6% Fibo. level ahead of the $24.00 mark.
XAG/USD 4-hour chart