AUD/USD Price Analysis: Looks to build on momentum beyond 50% Fibo./0.7700 mark
![]()
- AUD/USD gained strong follow-through traction on Wednesday and shot to three-week tops.
- Slightly overbought RSI forced bulls to pause near a resistance marked by the 50% Fibo. level.
The AUD/USD pair built on the previous day’s goodish rebound from sub-0.7600 level and gained some strong follow-through traction for the second consecutive session on Wednesday. The momentum pushed the pair to the 0.7700 neighbourhood, or three-week tops during the first half of the European session.
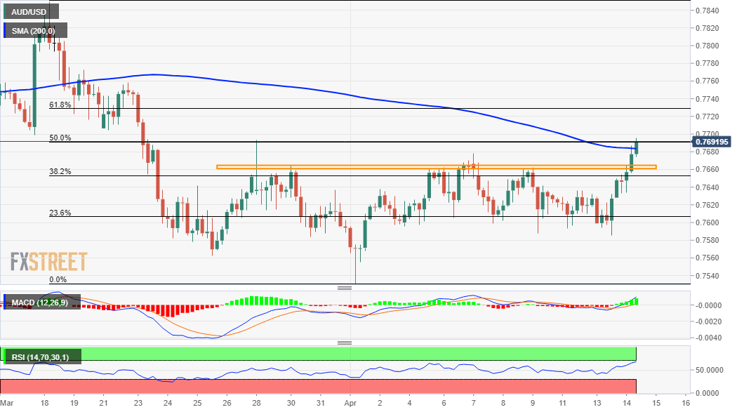
A sustained move beyond the 0.7670 heavy supply zone confirmed a bullish breakout through a three-week-old trading range. A subsequent strength beyond the 200-period SMA on the 4-hour chart might have already set the stage for additional gains. That said, overbought RSI on hourly charts capped the upside, at least for now.
The AUD/USD pair stalled its positive momentum near a resistance marked by the 50% Fibonacci level of the 0.7850-0.7531 recent leg down. This should now act as a pivotal point for short-term traders and help determine the next leg of a directional move. Some follow-through buying will now be seen as a key trigger for bullish traders.
Meanwhile, technical indicators on the daily chart have just started moving into the positive territory and add credence to the constructive outlook. However, traders might turn cautious and refrain from placing aggressive bets ahead of the Fed Chair Jerome Powell’s scheduled speech later during the US trading session.
Apart from this, Thursday’s release of the Australian monthly jobs report for March will further play a key role in influencing the AUD/USD pair’s near-term momentum. Hence, any subsequent positive move beyond the 0.7700 mark is more likely to confront stiff resistance and remain capped near a strong barrier, around the 0.7745 region.
On the flip side, any meaningful pullback from current levels now seems to find decent support near the 0.7670 resistance breakpoint. This is closely followed by the 38.2% Fibo. level, around mid-0.7600s. Failure to defend the mentioned support levels will negate the constructive set-up and prompt some aggressive technical selling.
The AUD/USD pair might then accelerate the slide towards challenging the 0.7600 mark before eventually dropping to the 0.7585-80 support zone. Some follow-through selling might turn the pair vulnerable to slide further towards challenging YTD lows, around the 0.7530 region, en-route the key 0.7500 psychological mark.
AUD/USD 4-hour chart