Palladium Price Analysis: XPD/USD faces stiff resistance at $2715, upside still favored
![]()
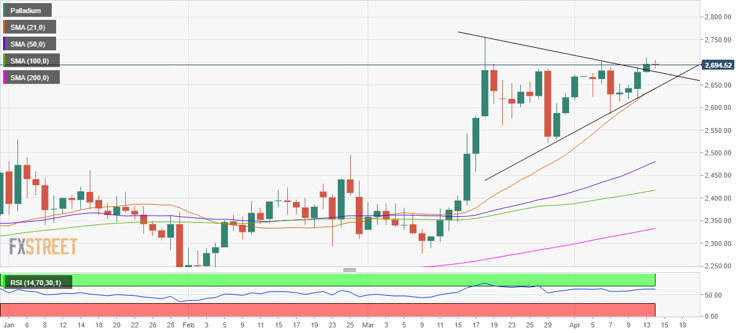
- XPD/USD confirmed a symmetrical triangle breakout on the 1D chart.
- Palladium’s 4H chart shows strong offers placed near the $2715 region.
- However, bulls continue to keep their sight on the $2800 mark.
Palladium (XPD/USD) is consolidating below the monthly highs of $2711 reached on Tuesday, as the bulls gather steam for the next leg higher.
In doing so, the price of Palladium has turned negative for the first time in five days, suggesting that it could likely be bullish exhaustion before the uptrend resumes towards $2800.
Price of Palladium
As explained here, the white metal did confirm a symmetrical triangle breakout on the daily chart a day before. XPD/USD, therefore, remains on track to reach the $2800 threshold.
Palladium price chart: Daily
Palladium price chart: Four-hour
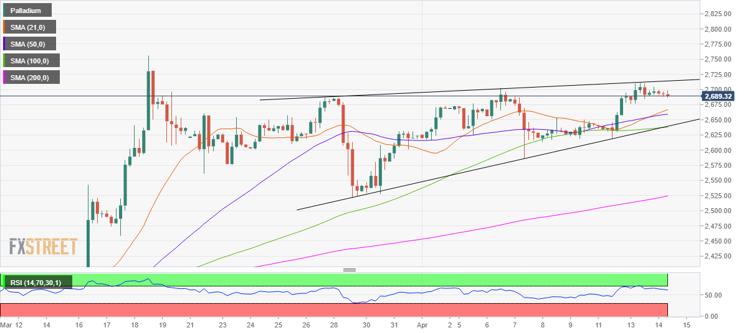
However, looking at a shorter duration chart, i.e, the four-hour chart, it can be seen that the XPD bulls are having a hard time taking out the strong barrier at $2715.
This level has limited the uptrend for now, where the rising wedge resistance lies. Note that the price is wavering within a rising wedge formation on the given time frame since end-March.
The Relative Strength Index (RSI) has edged lower, currently at 61.36, suggesting weakening upside momentum.
But the bullish crossover, with the 21-simple moving average (SMA) climbing above the 50-SMA, keeps the buyers hopeful.
A four-hour candlestick closing above the mentioned hurdle is needed to resume the northwards journey towards March highs of $2756, beyond which the $2800 level could be probed.
On the flip side, sellers could target the bullish 21-SMA at $2667 if the bearish pressures intensify.
Further south, fierce support at $2638 could offer some reprieve to the bulls. At that point, the upward-sloping 100-SMA coincides with the rising trendline support.