Gold Weekly Forecast: XAU/USD tests key trend line ahead of FOMC meeting
![]()
- Gold closed the second straight week in the negative territory.
- XAU/USD is testing the 2-month-old ascending trend line.
- Next significant support for gold is located at $1,840.
Gold spent the first half of the week trading in a relatively tight range as buyers could not hold the price above $1,900. Following a sharp decline to a six-day low of $1,869 on Thursday, the XAU/USD pair managed to stage a recovery and closed the day in the positive territory. Nevertheless, the renewed USD strength on Friday forced gold to drop below $1,880 and post losses for the second straight week.
What happened last week
Throughout the week, gold failed to capitalize on falling US Treasury bond yields. In the absence of high-tier macroeconomic data releases, the benchmark 10-year US T-bond yield, which lost more than 4% on the uninspiring May jobs report on Friday, extended its slide and touched its lowest level in nearly three months at 1.428%.
On Tuesday, the data from the US showed that JOLTS Job Openings rose to a new series-high of 9.3 million in April from 8.3 million in March and the NFIB Business Optimism Index edged lower to 99.6 from 99.8.
On Thursday, the US Bureau of Labor Statistics reported that annual inflation, as measured by the Consumer Price Index (CPI), jumped to 5% in May from 4.2% in April. Although this reading came in higher than the market expectation of 4.7%, the greenback struggled to gather strength against its rivals. Other data from the US revealed that the weekly Initial Jobless Claims declined to 376,000 from 385,000.
Meanwhile, the European Central Bank (ECB) announced on Thursday that it left the interest rates on the main refinancing operations, the marginal lending facility and the deposit facility unchanged at 0.00%, 0.25% and -0.50%, respectively, as expected. Moreover, the ECB said it will continue to conduct net asset purchases under the Pandemic Emergency Purchase Programme (PEPP) with a total envelope of €1,850 billion until at least the end of March 2022.
Finally, the University of Michigan said on Friday that the Consumer Sentiment Index improved modestly to 86.4 in June’s preliminary reading from 82.9 in May. This print came in slightly better than the market expectation of 84 but it was largely ignored by market participants. Nonetheless, the 2% rebound in the 10-year US T-bond yield helped the USD end the week on a firm footing and caused XAU/USD to return to the lower limits of its weekly range.
Next week
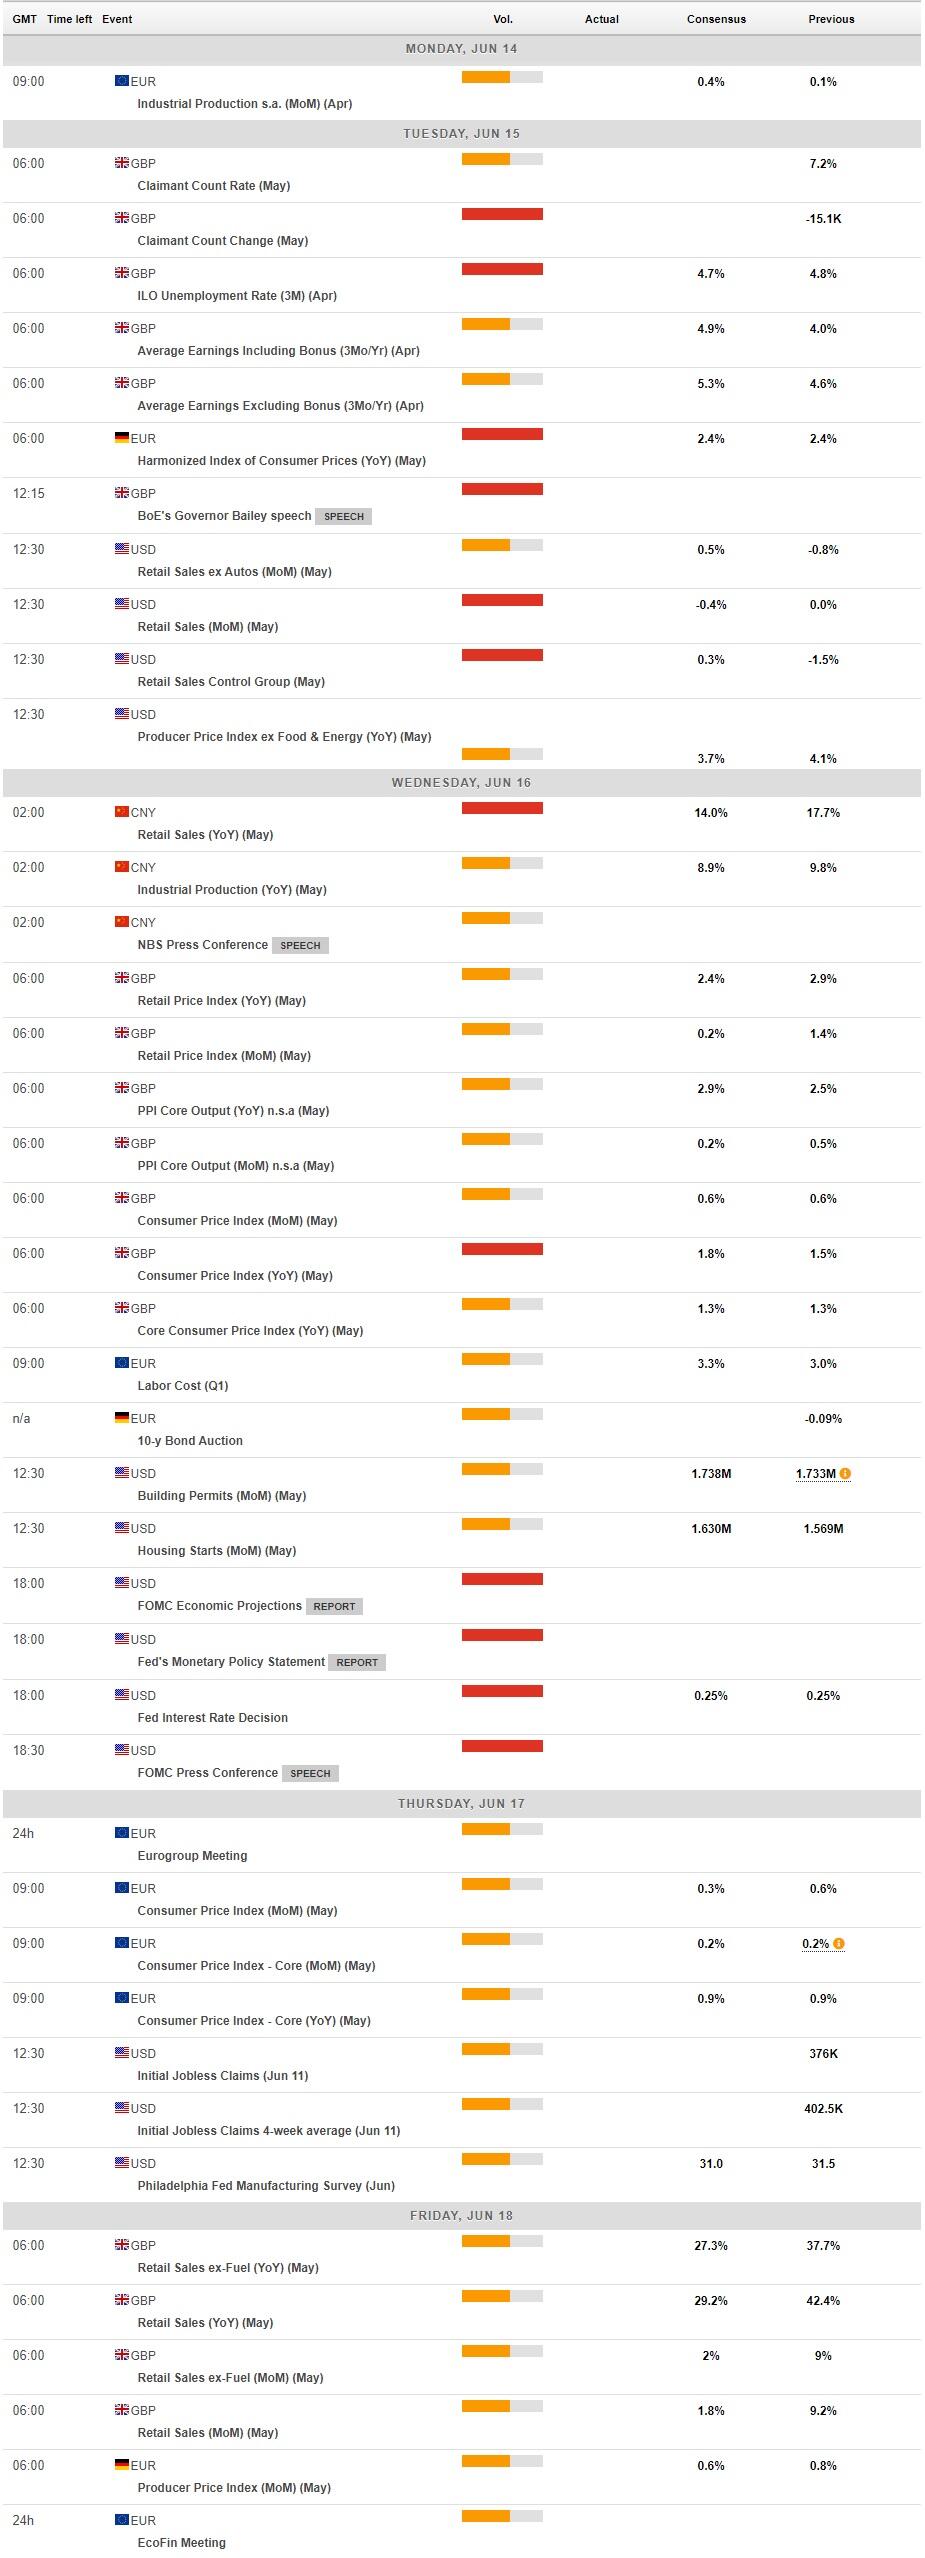
On Tuesday, May Retail Sales will be the first data of the week from the US that could potentially impact the greenback’s market valuation.
More importantly, the US Federal Reserve will announce its interest rate decision and publish the Monetary Policy Statement alongside the updated Summary of Projections. Investors will pay close attention to the dot plot, which showed in March that four policymakers were seeing a lift-off in policy rate in 2022.
A hawkish shift in the Fed’s tone amid an improved economic outlook and rising price pressures could provide a boost to the USD and weigh on XAU/USD in the second half of the week. On the other hand, the greenback is likely to underperform if FOMC Chairman Jerome Powell downplays inflation concerns and reiterates that they are not even thinking about tapering. In the previous weeks, several FOMC policymakers argued that they need to start discussing possible adjustments to the QE program with improving economic prospects. On the same note, a recently conducted Reuters poll showed that economists expect the Fed to announce a QE taper for early 2022 in August or September.
Gold technical outlook
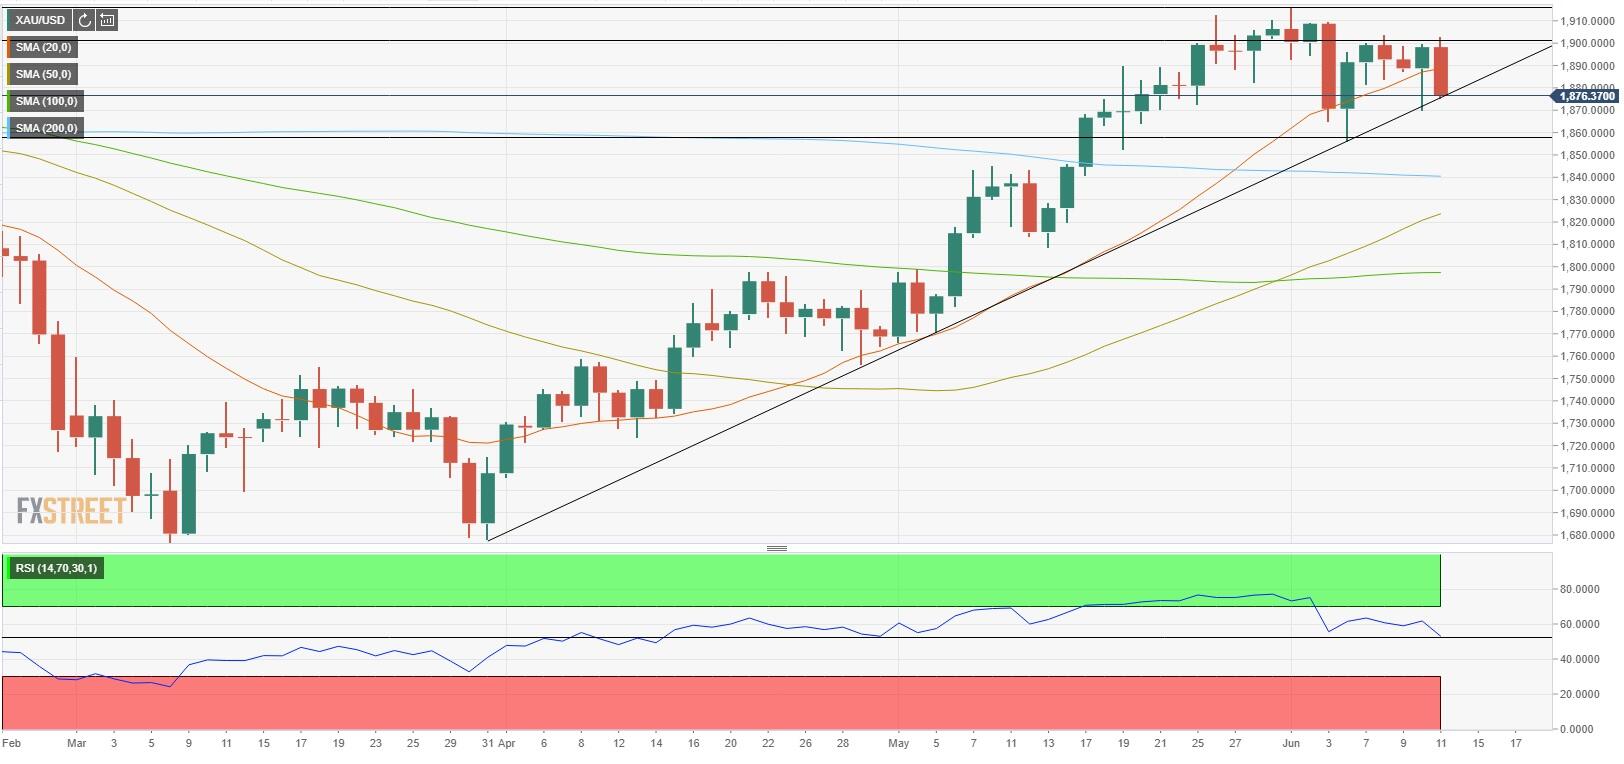
On the daily chart, the Relative Strength Index (RSI) indicator fell to its lowest level since late April, suggesting that buyers are having a hard time staying in control. Additionally, gold tested the ascending trend line coming from early May for the third time on Friday. A daily close below that line, which is currently located around $1,873, could open the door for additional losses toward $1,855 (June 4 low) and $1,840 (200-day SMA).
On the flip side, a tough resistance seems to have formed at $1,900, a psychological level. In case buyers manage to lift the price back above that level, the next target could be seen at $1,916 (June 1 high).
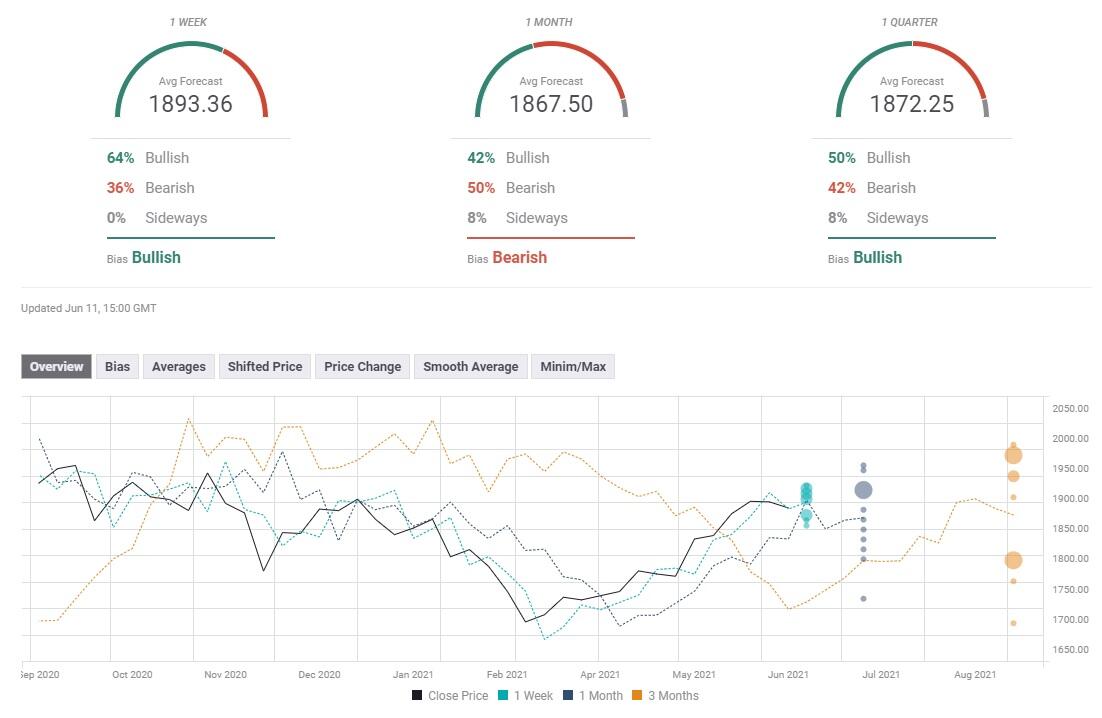
Gold sentiment poll
Despite this week’s drop, the FXStreet Forecast Poll points to a slight bullish shift in the near-term with an average target of $1,893 on a one-week view. The one-month view continues to paint a mixed picture as 50% of experts remain bearish vs 42% bullish.