Gold Price Forecast: ‘Buy the dips’ rescues XAU/USD after the Fed-blow, but for how long?
- Gold price sees dip-buying interest after the hawkish Fed’s outcome.
- Dollar, Treasury yields consolidate the FOMC-led surge.
- Short-term technical indicators point to more weakness.
Gold price (XAU/USD) recorded the biggest daily drop since January on Wednesday after the US Federal Reserve’s (Fed) hawkish surprise smashed it to the $1800 support area. The US dollar rallied hard alongside the Treasury yields after the Fed’s dot plot chart pointed to two rate hikes by the end of 2023, much sooner than previously expected. Also, Fed Chair Jerome Powell announced improvements to the economic indicators while keeping tapering bets alive in the upcoming meetings. A potential withdrawal of the Fed’s monetary policy support spooked investors, as ‘sell-everything mode’ returned to markets, with gold and Wall Street indices sharply lower while the US dollar index reached two-month tops near 91.50. The benchmark 10-year US rates jumped to test the $1.60 level. Higher returns on markets dent the appeal of the yieldless gold.
So far this Thursday, gold price is staging a minor comeback around $1820, at the time of writing, as the dollar and yields consolidate the solid gains. Bargain hunting, in light of the recent crash, could be associated with the rebound in gold price. The Fed’s hawkish signal is likely to keep the US currency afloat ahead of the weekly Jobless Claims data and other minority reports, which will maintain the downside pressure on gold. Therefore, gold price could resume the downtrend in the sessions ahead.
Gold Price Chart – Technical outlook

Gold: Hourly chart
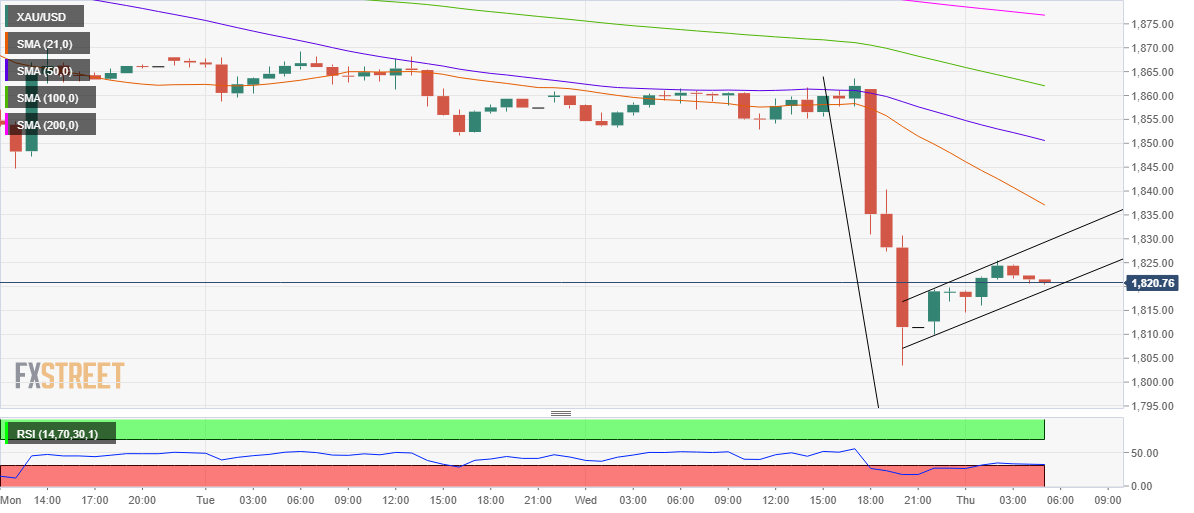
Wednesday’s slide that followed a brief consolidation this morning has taken the shape of a bear flag, which is a bearish continuation pattern.
An hourly candlestick break below the rising trendline support at $1819 will trigger a fresh downswing, with a test of Wednesday low of $1803 inevitable.
If the selling pressure accelerates below $1800, the bears will aim for the pattern target measured at $1769.
The Relative Strength Index (RSI) remains bearish while holding just above the oversold region, suggesting that there is scope for additional declines.
On the flip side, a sustained break above the rising trendline resistance at $1829 could add extra legs to the rebound, driving the gold price towards a downward-pointing 21-Hourly Moving Average (HMA) at $1838.

