Gold Price Forecast: XAU/USD consolidates above $1,800 as sellers fail to retain control
![]()
- Gold remains on track to end the day little changed.
- 100-day SMA continues to act as strong support.
- XAU/USD near-term technical outlook stays neutral with a slight bearish bias.
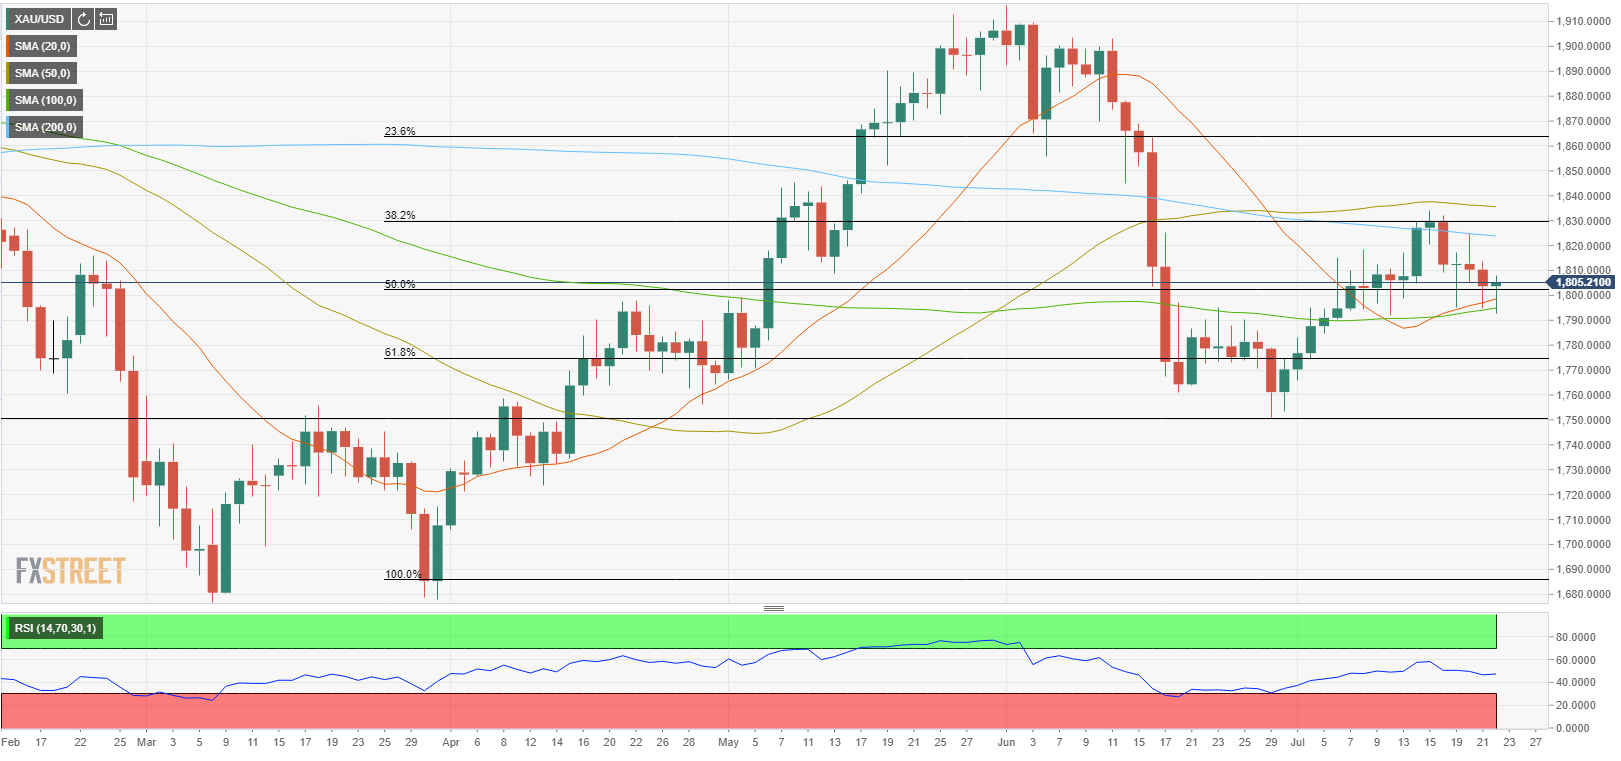
After failing to rise above the 200-day SMA earlier in the week, the XAU/USD pair struggled to regain its bullish momentum and closed in the negative territory on Wednesday. Although sellers remained in control during the first half of the day and managed to drag the price toward the 100-day SMA, the risk-averse market environment helped the pair stage a rebound in the American session. As of writing, gold was virtually unchanged on a daily basis at $1,805.
Earlier in the day, the upbeat market mood, as reflected by the strong gains witnessed in major European equity indexes, made it difficult for the precious metal to find demand. Nevertheless, the broad-based USD weakness allowed XAU/USD to limit its losses.
With Wall Street’s main indexes failing to build on the two-day rally after the opening bell, safe-haven flows boosted gold. However, the greenback also capitalized on the souring market mood and forced XAU/USD to move sideways.
The data from the US showed on Thursday that the Initial Jobless Claims increased by 51,000 to 419,000 in the week ending July. This reading came in worse than the market expectation of 350,000, possibly weighing on risk sentiment. Moreover, the National Association of Realtors announced that Existing Home Sales increased by 1.4% on a monthly basis in June. Further details of the publication revealed that, on a yearly basis, the national median home price for existing homes increased by 23.4% from June 2020 to $363,000.
On Friday, the IHS Markit will release the preliminary Manufacturing and Services PMI reports for the US.
Gold technical outlook
Following Thursday’s action, the near-term outlook remains neutral with a slight bearish bias as the price stays closer to the key support area than the resistance area. Meanwhile, the Relative Strength Index (RSI) indicator on the daily chart continues to stay flat around 50, confirming gold’s indecisiveness.
On the downside, the initial support is located at $1,800 (psychological level, Fibonacci 50% retracement of April-June uptrend) ahead of $1,790 (100-day SMA). A daily close below the latter is likely to open the door for additional gains toward $1,775 (Fibonacci 61.8 retracement).
On the other hand, the 200-day SMA aligns as strong resistance at $1,823 ahead of $1,830 (Fibonacci 38.2% retracement) and $1,835 (50-day SMA).