Gold Price Forecast: XAU/USD eyes a sustained move below key $1799 support – Confluence Detector
![]()
Gold price is trading on the wrong footing this Friday, eyeing the first weekly loss in five weeks, as the US dollar remains at the highest levels in three months. With a volatile week coming to an end, concerns over the global economic outlook amid Delta covid variant spread kept the dollar bids underpinned. Meanwhile, upbeat corporate earnings reports on both sides of the Atlantic and stimulus optimism refuelled reflated trades, lifting the Treasury yields at gold’s expense. From a near-term technical perspective, gold price remains exposed to downside risks, as a break of the support area near the $1799-$1795 region appears inevitable.
Gold trades now look forward to the US Markit Manufacturing and Services PMIs for fresh trading impetus, all eyes now remain on the next week’s FOMC meeting.
Gold Price: Key levels to watch
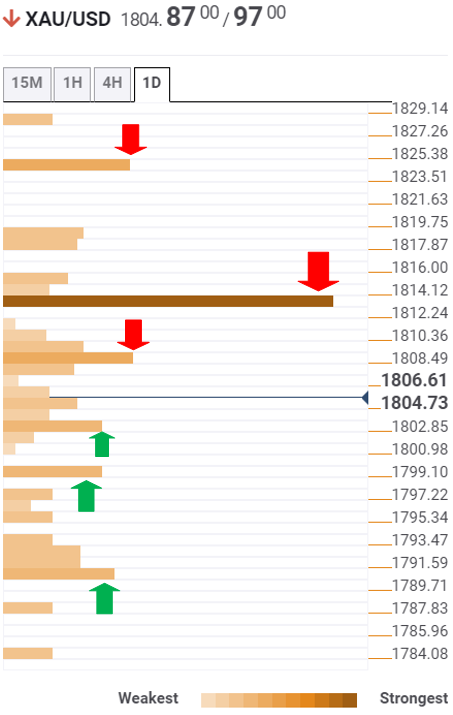
The Technical Confluences Detector shows that gold is holding the lower ground, with immediate support now seen at $1802, the Fibonacci 38.2% one-day.
Sellers will look for fresh entries below $1799, which is the confluence of the Bollinger Band one-day Middle and Fibonacci 61.8% one-day.
The next downside target is seen where a dense cluster of minor support levels align around $1795. That zone is the convergence of the pivot point one-day S1 and Bollinger Band four-hour lower.
The intersection of the previous week’s low, pivot point one-week S1 and Fibonacci 23.6% one-month at $1791 will be a tough nut to crack for gold bears.
On the upside, $1808 is likely to emerge as a powerful resistance if the rebound picks up pace. At that point, the previous day’s high and Fibonacci 61.8% one-week merge.
Acceptance above $1813, the confluence of the SMA10 one-day, SMA50 four-hour and pivot point one-day R1, is critical to reviving the bullish momentum towards the SMA200 one-day at $1823.
Here is how it looks on the tool
About Technical Confluences Detector
The TCD (Technical Confluences Detector) is a tool to locate and point out those price levels where there is a congestion of indicators, moving averages, Fibonacci levels, Pivot Points, etc. If you are a short-term trader, you will find entry points for counter-trend strategies and hunt a few points at a time. If you are a medium-to-long-term trader, this tool will allow you to know in advance the price levels where a medium-to-long-term trend may stop and rest, where to unwind positions, or where to increase your position size.