SafeMoon price tightens, revealing an immediate 50% move for SAFEMOON
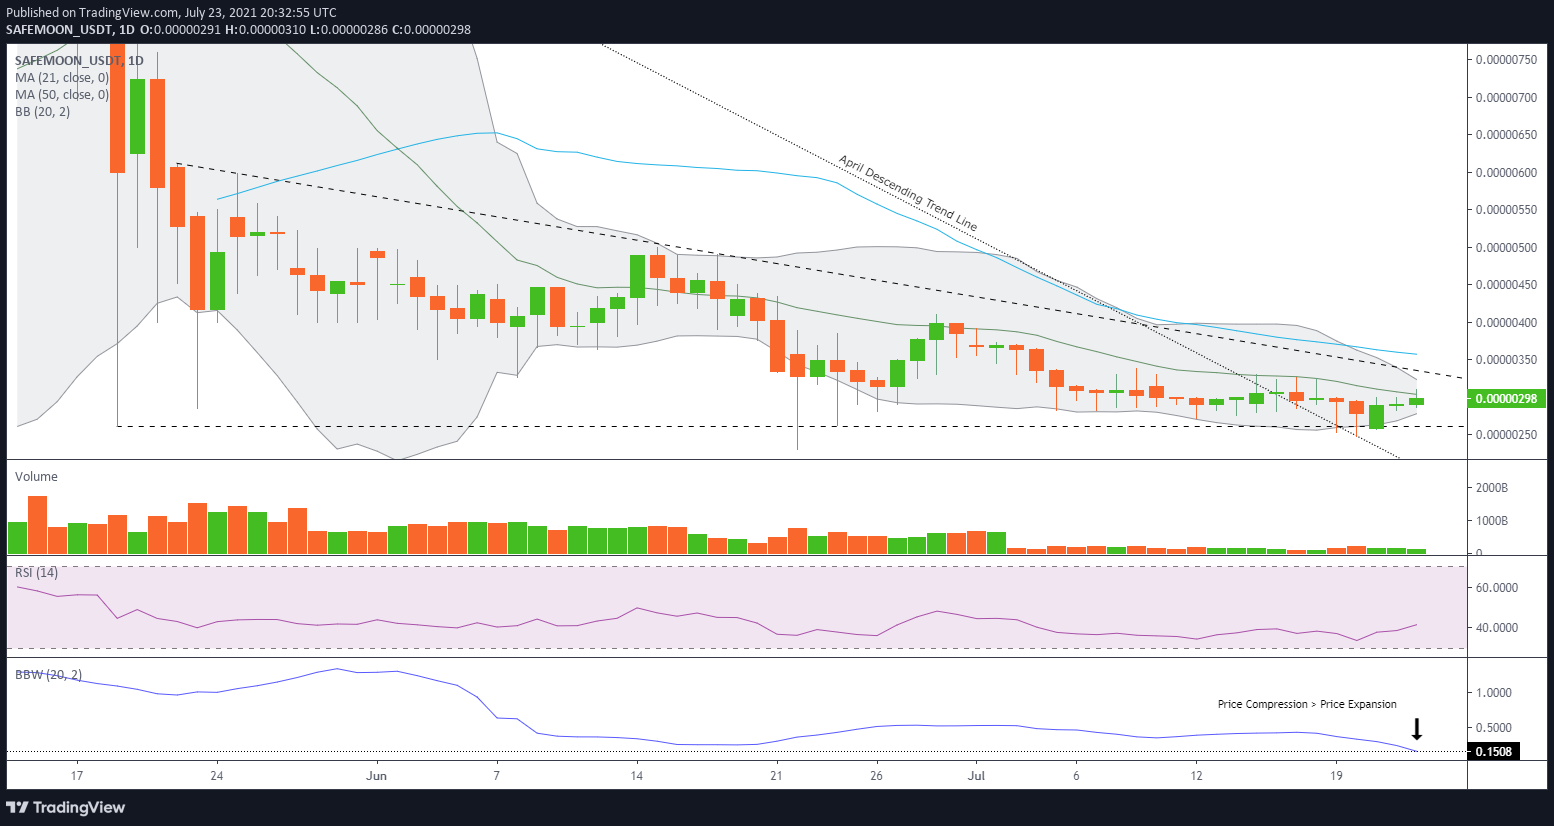
- SafeMoon price continues to trend within a descending triangle pattern, with the May 19 low defining the support line.
- SAFEMOON 50-day simple moving average (SMA) aligns with the triangle’s resistance line, possibly frustrating an upside breakout.
- Bollinger Band Width (BBW) now surpasses the compression in June, before the quick -50% drop.
SafeMoon price, similar to Shiba Inu, has presented several patterns with precise entry points during the bottoming process. Still, no sustainable rally has materialized, keeping SAFEMOON speculators on the defensive as the cryptocurrency flirts with a breakdown below the May 19 low. The result of the coiling price action has been the formation of a descending triangle, hinting at a downward bias for the SafeMoon price outlook.
SafeMoon price contraction leads to price expansion
A descending triangle is a bearish chart formation that commonly emerges as a continuation pattern during a downtrend, indicating heavy distribution. To compute the measured move for a descending triangle, take the height from the highest peak to the horizontal support line and add or subtract the amount to the breakout price (the point where price crosses the triangle’s support or resistance line) to get a target price.
Statistically, descending triangle patterns resolve to the downside 64% of the time, but an upward breakout is more reliable and powerful, with an average rise of 38% versus an average decline of 15%. 64% of upward breakouts reach the price target, while only 50% of the downward moves reach the price target. Moreover, the average breakout distance from the base to the apex is 64%, but the most powerful occurs at 80%
The measured move of the SAFEMOON descending triangle is 57%, establishing a downside price target of $0.00000111. To activate the pattern, SafeMoon price needs to record a daily close below the May 19 low of $0.00000261, something the digital asset failed to accomplish on June 22, July 19 and July 20.
On the upside, the measured move SafeMoon price target is $0.00000540. To log a breakout to the upside, SAFEMOON needs to dislodge from the downward pressure exerted by the 21-day SMA at $0.00000304 and then chart a daily close above the descending triangle’s upper trend line at $0.00000346 and the closely tracking 50-day SMA at $0.00000357.
In terms of timing the potential 57% move, the notable contraction of SafeMoon price and as a result, the Bollinger Bands have put the BBW at the lowest reading since at least April, suggesting that a release from the descending triangle pattern is imminent. Amplifying the opportunity’s timeliness is that SAFEMOON is trading near 80% of the distance between the base and the apex.
SAFEMOON/USD daily chart
In case of a reversal of the SAFEMOON trade, use the triangle’s other line (support or resistance) as a stop on a daily closing basis.
SafeMoon price is primed for a substantial move, with probabilities indicating it will be an upward resolution. As a result, SAFEMOON investors need to copy down the trade activation prices published above and supplement with a precise position size because this type of timely opportunity is rare.


