Gold Price Forecast: Bears step up ahead of key $1,810 level, target $1,770
![]()
- Gold is trading below the prior day’s close and eyes are on the downside.
- The key support levels to watch are $1,790, $1,780 and $1,770.
The gold price is trading in familiar territories, but the bulls attempted a test near to the critical $1,810 level in earlier trade, failing at $1,806. The price has since deteriorated by some 0.70% on the day and $1,791 marks the low so far. At the time of writing, gold is trading near $1,791.
On a positive note, the US dollar is softer and stocks are higher which is a supportive factor for precious metals. In what might be regarded as a delayed reaction to Tuesday’s miss in Consumer Prices, the US dollar weakened against major currencies on Wednesday.
Eyes on DXY
Short-term expectations about tapering of asset purchases from the Federal Reserve are mixed as a consequence. The dollar index, DXY, last stood at 92.529, down about 0.14% on the day from Tuesday, when it dropped following the inflation data but then recovered on haven demand as stocks slid on Wall Street.
The index has stuck to a tight 92.3 and 92.9 range over the past week. Investors are weighing rhetoric from several Fed officials ahead of next week’s FOMC meeting. In the main, the Fedspeak has been hawkish and has advocated for the central bank to reduce its QE programme by the end of the year as the economy turns a corner, despite the last dismal Nonfarm Payrolls result.
While elevated inflation has kept the pressure on policymakers, data on Tuesday showed the US Consumer Price Index, excluding the volatile food and energy components, edged up just 0.1% last month. The rise in August’s CPI was the smallest advance in seven months. Treasuries rallied, with the 10y yield then falling 5bps to 1.25%. This provided some support to gold, with the spot price breaking above USD1,800/oz.
Gold key support is at $1,790
”But considering that inflation has met the Fed’s threshold for ‘substantial further progress’, we don’t expect substantial tailwinds from the economic print as the employment report captures more share of mind at the Fed,” analysts at TD Securities explained.
”Notwithstanding, waning downside momentum in gold prices is also catalyzing a buying program from algorithmic trend followers.
In fact, we expect that positive flows from CTAs should support gold prices even higher, so long as the yellow metal can hold above the $1,790/oz threshold. Our ChartVision framework also argues that gold prices need only breach $1,870/oz by year-end for an uptrend to form.”
Gold technical analysis
The price is below the prior day’s close and an hourly 50-day EMA channel as illustrated below within a firm bearish trend.
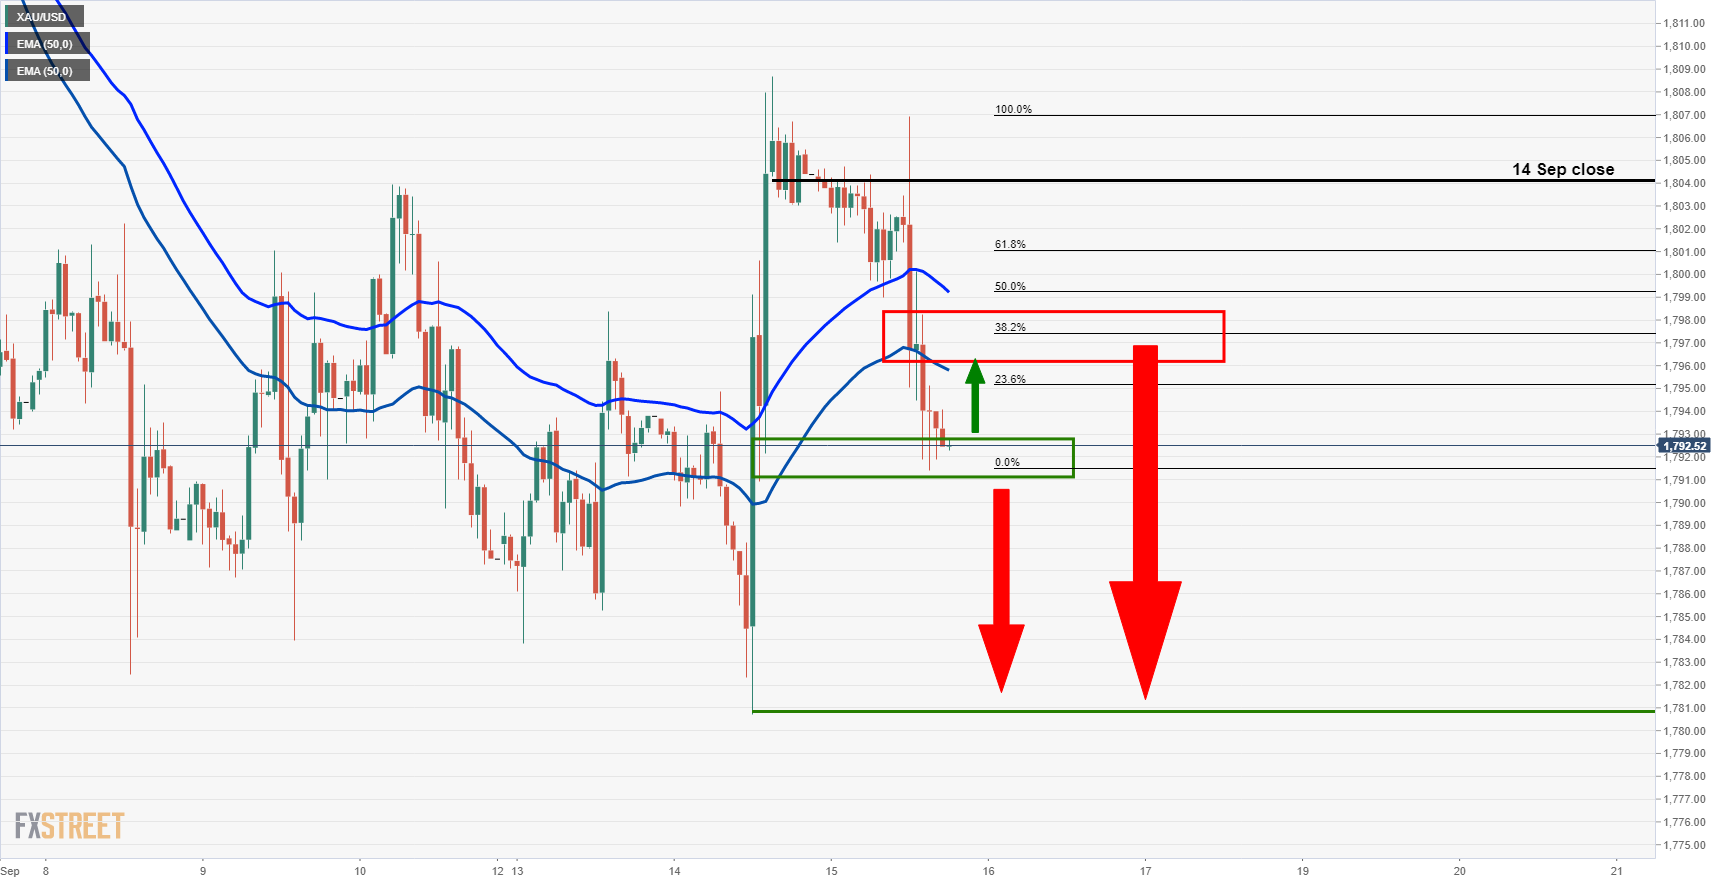
A retest of the 50-EMA channel that has a confluence with the 38.2% ratios could be the last defence before a downside break of $1,790 and $1,780 14 Sep pivot low. This guards a critical daily support area and $1,770 is the line in the sand:
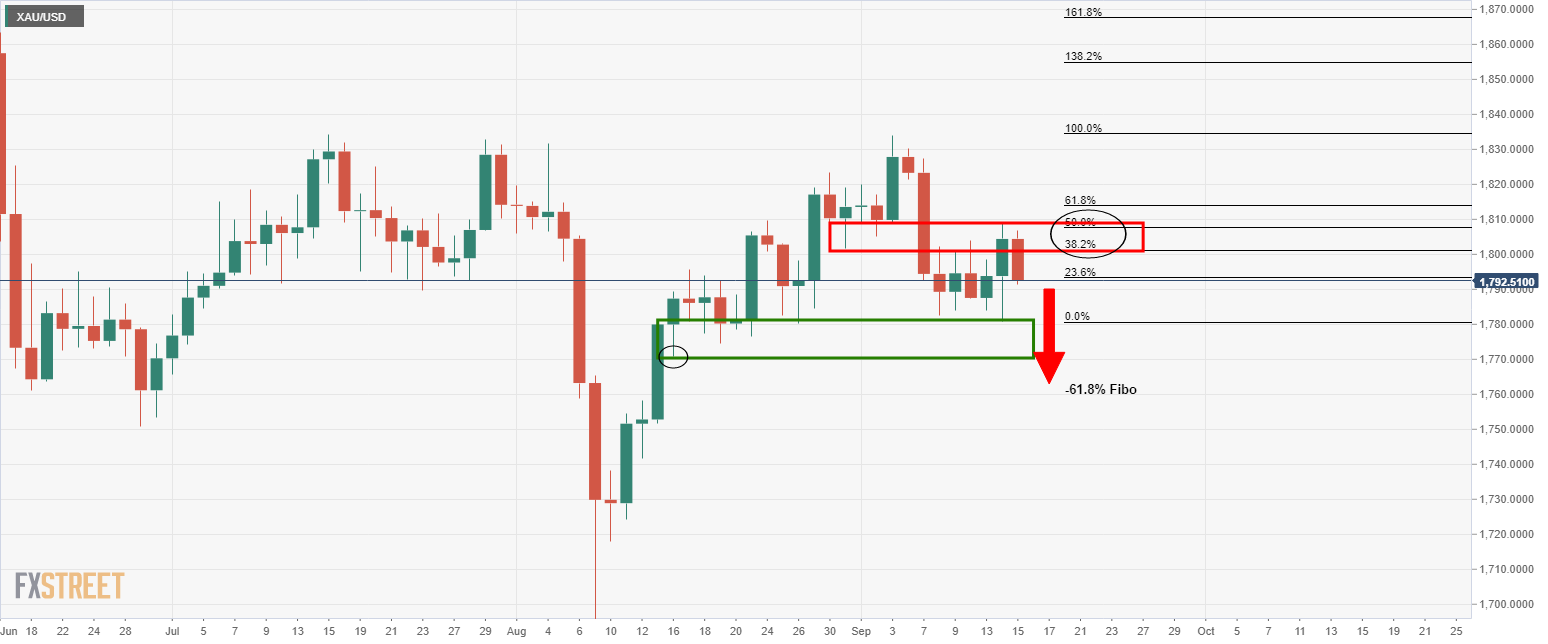
In the above daily chart, the price has reached a 50% mean reversion of the prior bearish impulse. The price is now headed lower below this area and a downside extension towards the -61.8% near $1,763 would be expected on a break of $1,770 prior 16 Aug lows.