AUD/USD Price Analysis: Nears 100-DMA hurdle after the big technical breakout
![]()
- AUD/USD approaches 0.7400 after symmetrical triangle breakout on the 1D chart.
- 100-DMA resistance at 0.7416 is the level to beat for the aussie bulls.
- Daily RSI points north well above the midline, suggesting more gains.
AUD/USD is building onto Wednesday’s rally, as the buying interest around the aussie remains unabated, despite the mixed Australian jobs and Chinese inflation figures.
The major has recaptured the 0.7400 mark, adding 0.33% on the day, quickly approaching the critical descending 100-Daily Moving Average (DMA) at 0.7416.
AUD/USD’s uptrend found additional legs after the bulls yielded a month-long symmetrical triangle breakout on the daily chart on Wednesday.
The 14-day Relative Strength Index (RSI) is edging higher above the midline, allowing room for more upside.
Therefore, acceptance above the 100-DMA barrier will open doors towards the 0.7450 psychological resistance.
Further up, the September highs of 0.7478 could challenge the bearish commitments.
AUD/USD: Daily chart
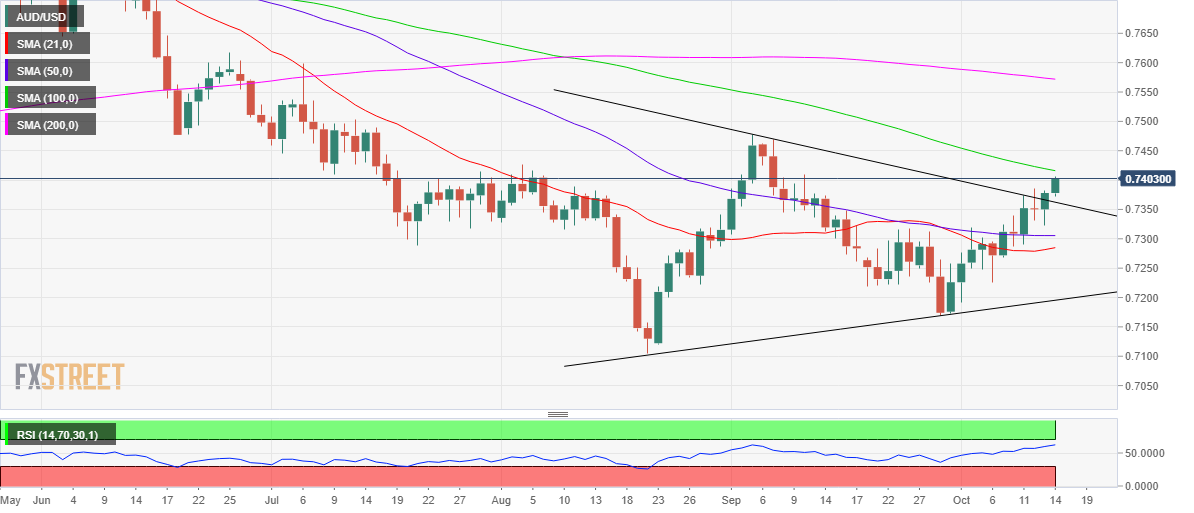
Alternatively, the triangle resistance-turned-support at 0.7362 will guard the immediate downside.
The next significant goal for the AUD bears will be the horizontal 50-DMA at 0.7305. More weakness will prompt the sellers to test the mildly bullish 21-DMA at 0.7285.