EUR/USD Forecast: How long can the recovery last?
![]()
- EUR/USD has gone into a recovery phase on Wednesday.
- Dollar feels the weight of falling US Treasury bond yields.
- 1.1620 aligns as the next target on the upside.
The EUR/USD pair turned north on Wednesday but it needs to be said that the recovery was fueled by the broad selling pressure surrounding the greenback rather than the renewed euro strength.
After the data published by the US Bureau of Labor Statistics revealed that the Core Consumer Price Index (CPI) in the US stayed unchanged at 4% on a yearly basis in September, the US Treasury bond yields started to push lower. With the benchmark 10-year US T-bond yield losing nearly 3%, the greenback struggled to find demand and EUR/USD gained nearly 70 pips on a daily basis on Wednesday.
However, the 10-year US T-bond yield is holding above the critical 1.5% mark on Thursday and as long as this level holds, the dollar could regain its strength and limit EUR/USD’s upside.
On the flip side, another USD selloff could be in the books in case the 1.5% support fails. Nevertheless, it’s difficult to bet on a long-lasting EUR/USD recovery as the FOMC’s Meeting Minutes, once again, reaffirmed policymakers intentions to start reducing asset purchases as early as November.
Later in the day, the US Department of Labor’s Weekly Initial Jobless Claims data and September Producer Price Index (PPI) figures from the US will be featured in the US economic docket, which are unlikely to trigger a significant reaction.
EUR/USD technical analysis
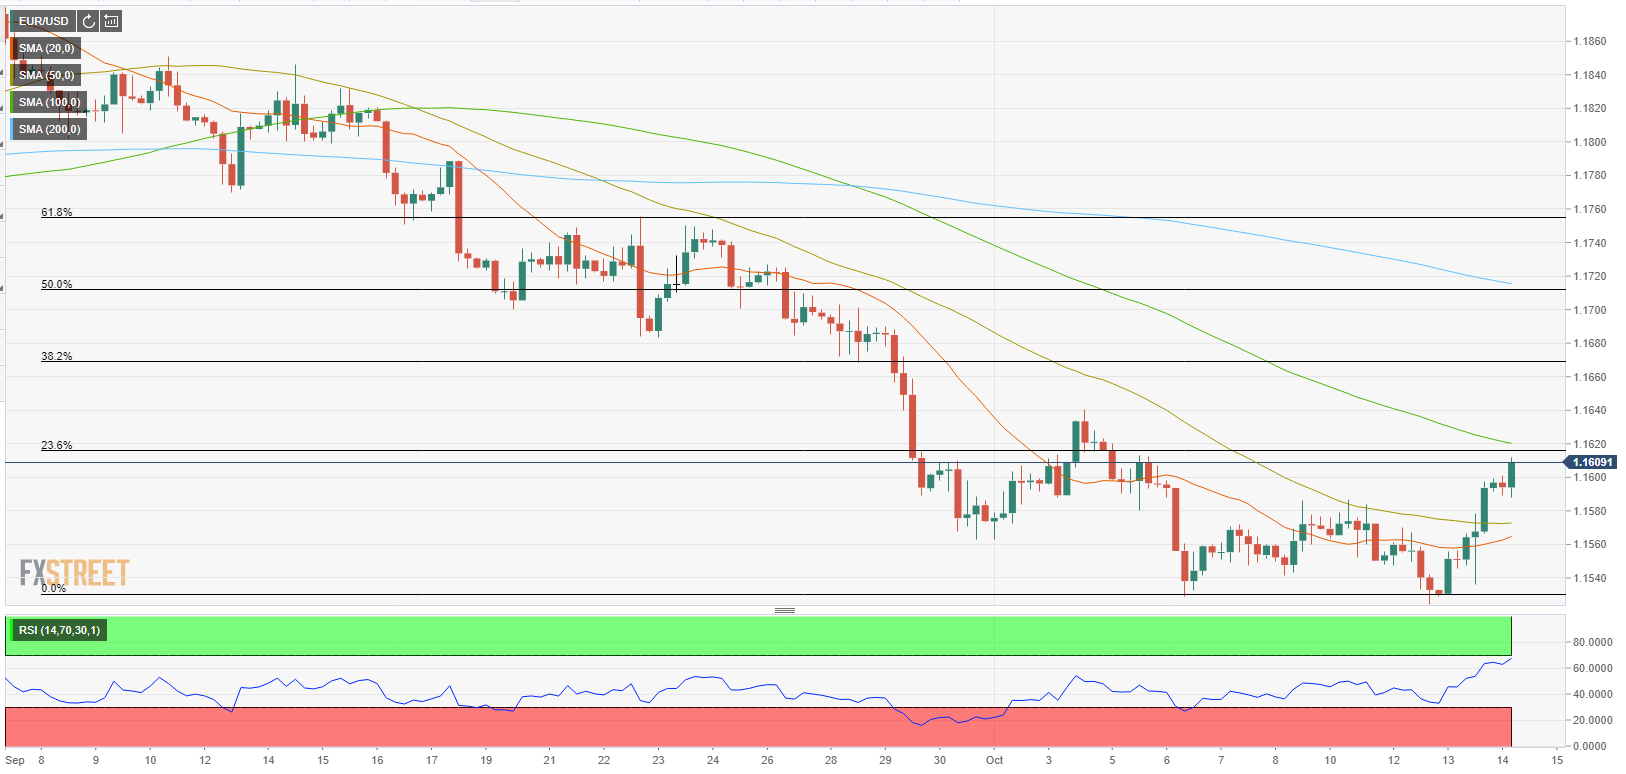
EUR/USD is currently trading above 1.1600 (psychological level) and closes in on 1.1620, where the Fibonacci 23.6% retracement of the downtrend that started in early September is located. The 100-period SMA on the four-hour chart is also reinforcing that resistance. If buyers successfully flip that level into a support, the next target on the upside could be seen at 1.1670 (Fibonacci 38.2% retracement) ahead of 1.1700/10 area (psychological level, Fibonacci 50% retracement, 200-period SMA).
The initial support now aligns at 1.1570 (50-period SMA) before 1.1525 (15-month low) and 1.1500 (psychological level).
It’s also worth noting that the Relative Strength Index (RSI) indicator is approaching the overbought area, suggesting that the pair could retreat slightly before the next leg up.