Top 3 Price Prediction Bitcoin, Ethereum, Ripple: Money flows back into cryptos
![]()
- Bitcoin price sees an uptick, with buyers returning to the scene, forming a bullish breakout towards $65,087.
- Ethereum price sees bulls preparing breakout towards $4,646, targeting new all-time highs.
- XRP price is stuck in a bearish triangle, but bulls are slowly but surely stepping up their game.
Bitcoin price sees bulls returning to the scene on Thanksgiving as investors see buying opportunities across the board in cryptocurrencies. Ethereum price sees momentum even building towards a bullish breakout with buy-side volume under excessive bidding. Although XRP is lagging, it is still stuck in a bearish triangle, the higher lows show a bullish inflow into the currency.
Bitcoin price regains control above the monthly pivot, with an uptick in buy-side flow
Bitcoin (BTC) price was under siege by bears after making new all-time highs at the beginning of November. As price started to fade quite quickly, bears gained control of a few fundamental technical indicators with the monthly pivot, the 55-day Simple Moving Average (SMA) and a break below the Fibonacci level at $59,586. But there are signs of change as more inflows are seen coming in and an uptick in the Relative Strength Index (RSI), away from oversold.
BTC price sees bulls in a festive mood awaiting their turkey in the oven, as bulls regain control above the monthly pivot at $57,335. The lift came with the bounce of the descending short-term trend line from November 21. As the inflow should continue throughout the day, expect a test and possibly reclaim the Fibonacci level at $59,586.
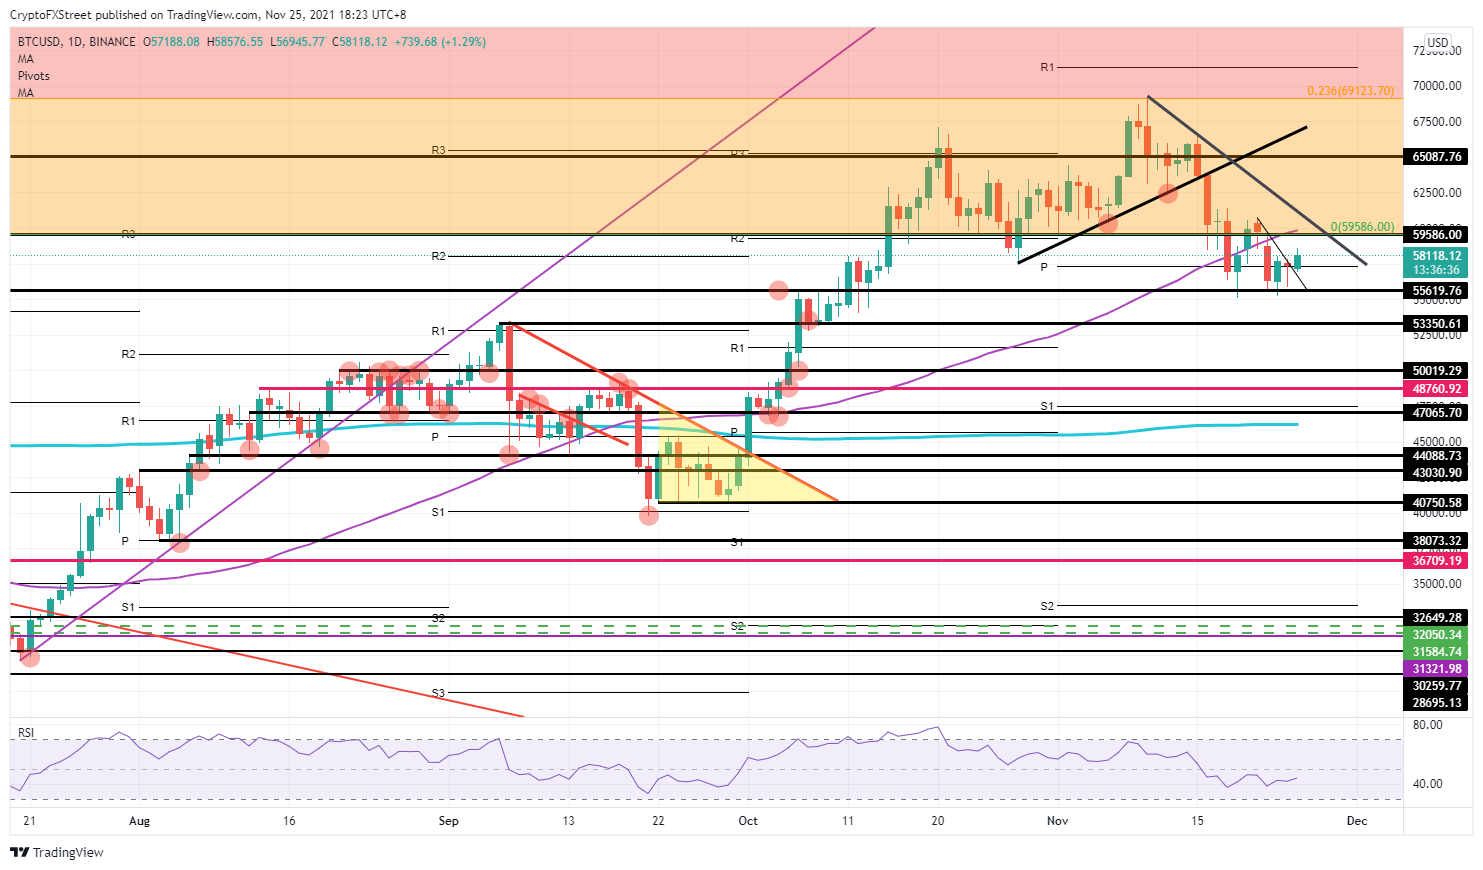
BTC/USD daily chart
Expect investors to spot the uptick in later sessions by starting to buy in greater volumes. This will spiral into a squeeze and pop above the descending trend line from November 10, with a run-up towards $65,087 even possible. As markets will probably shift towards more risk-off, expect this to attribute to some tailwinds for Bitcoin, lifting price further up by next week with a retest of new all-time highs above $69,123.
Ethereum price sees impatient bulls building momentum for a breakout towards $50,000
Ethereum (ETH) price is no different from Bitcoin and is even witnessing an even more violent bullish rebound today, although the US markets are closed for holidays. ETH price action is brushing against the upside of the wedge and looks to be at the point of breaking out of it soon, given the Relative Strength Index looks to rise as buy-side volume spikes in early European hours. Although bulls face resistance soon after at $4,465, expect it to break quite easily as the buy volume is quite chunky.
ETH price will then slowdown after hitting $4,465 and then pull-back and possibly retest $4,646, which is the next resistance barrier, originating from May 12. The best technical play here would be to wait for the failed test, see the pullback towards $4,465, see another second wave of buy-in from investors that came to the party too late to get in. This in turn, would create a second breakout towards new all-time highs at $50,000.
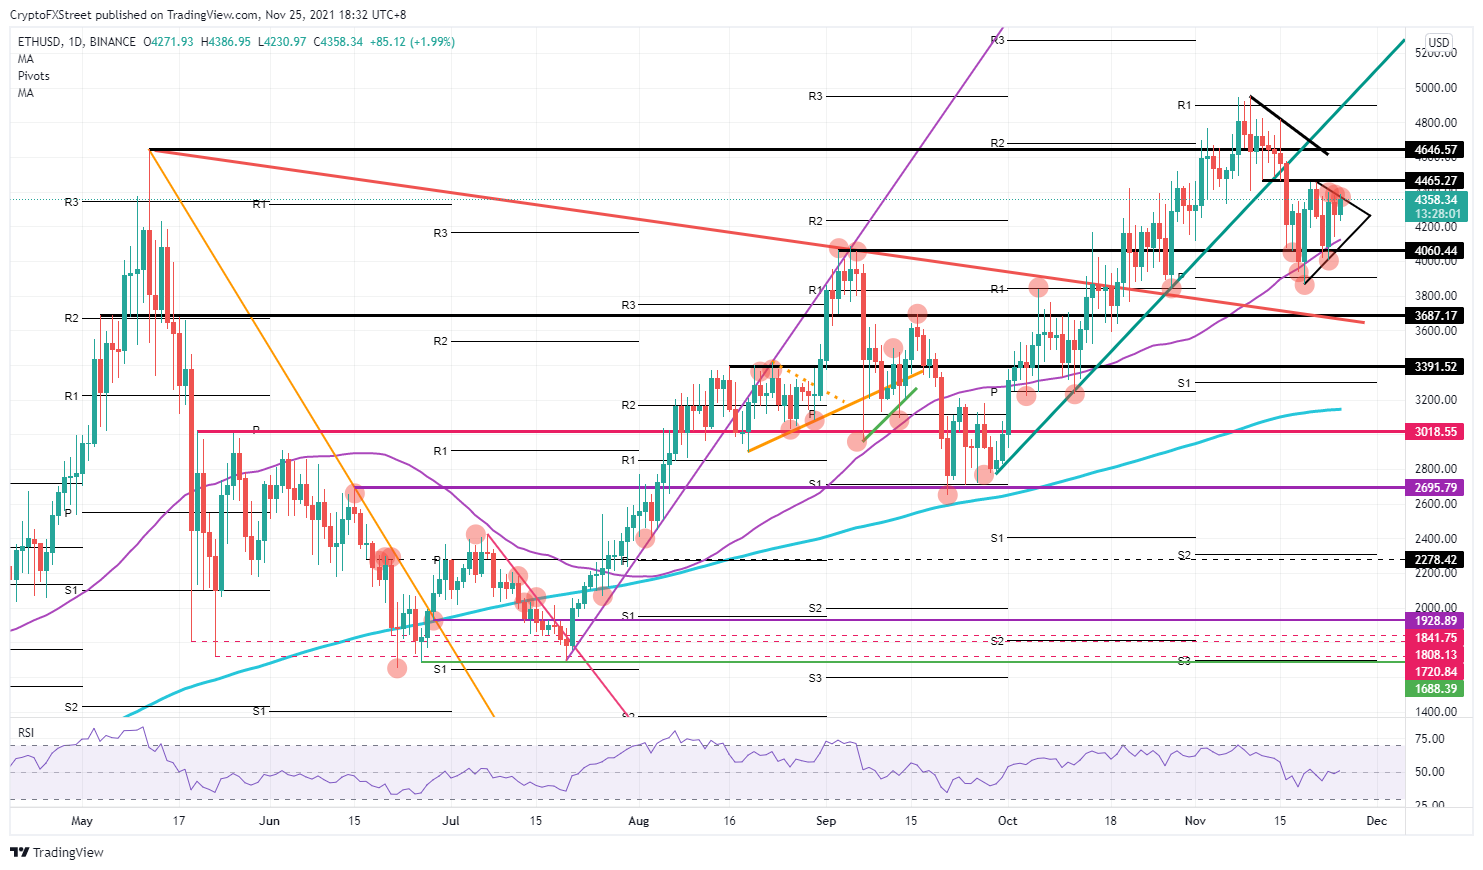
ETH/USD daily chart
Thus, ETH prices will be under some pressure from bears that have these two upside levels presenting resistance. It will be essential to see if bulls can refrain from taking any short-term profits and rather sit on their trades expecting and pumping for new all-time highs. If that can unfold, a break of the monthly R1 resistance level should be inevitable.
XRP price still under bearish pressure, but bulls are pushing back on further downside
Ripple (XRP) price is still stuck in a downtrend, with bears selling alongside a descending trend line from November 16. XRP price halted at $0.99 with the 200-day SMA as a supporting factor and saw price being pushed back towards the descending trend line again. Bulls are presenting themselves as the price gets a squeeze higher, with higher lows, which could point to a similar inflow of investors as Bitcoin and Ethereum are experiencing, but more mildly.
XRP price’s movements are reflected in the RSI which is showing a slight knee-jerk reaction to the upside, but is not popping up aggressively as we saw with Bitcoin and Ethereum prices. Nevertheless, the downtrend may still continue a little further for now as bears grasp the opportunity to take some more profit with a possible retest of $0.99.
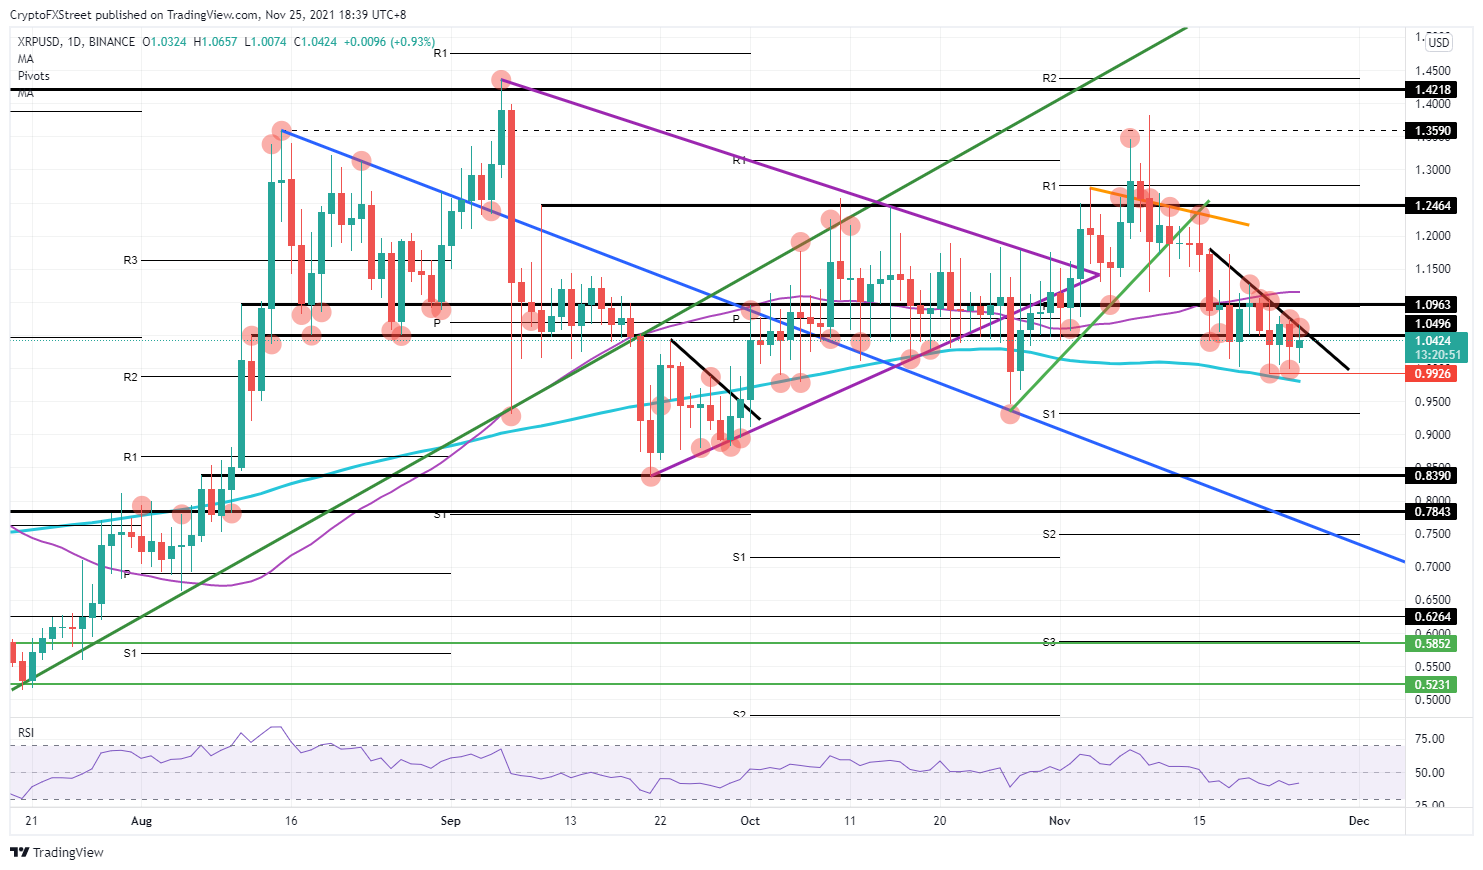
XRP/USD daily chart
When global cryptocurrencies starting to gain traction and show green profit numbers again, expect these tailwinds to help lift the mood for XRP price with a potential break above the descending trend line and a retest of $1.09. Following that break, more investors will probably want to jump aboard the trend. This should see an uptick towards $1.25 possibly, which would see quite a lift in sentiment. The acquisition of new all-time highs is a bit too far fetched for now but could be in the making if Bitcoin and Ethereum also hit them. This might then lead to a delayed reaction for Ripple price by the end of next week – if all the stars, that is, align in favor of it.