NZD/USD Price Analysis: Morning-star in the daily chart opens the door for 0.6900
![]()
- The NZD/USD begins the Asian session in the right foot, up some 0.46%.
- A candlestick morning-star formation in the daily chart opens the door for 0.6900.
The NZD/USD bounced off year-to-date lows, is rising as the Asian session begins, trading at 0.6789 during the day at the time of writing. On Tuesday in the overnight session, the NZD/USD pair dipped as low as 0.6736, then rallied on the back of positive omicron COVID-19 news, up to high 0.6770s. Then, through the rest of the day, the pair advanced steadily, leaving behind the 50 and the 100-hour simple moving average (SMA), below the spot price, but the upside move stalled around the R3 daily pivot point around 0.6784.
NZD/USD Price Forecast: Technical outlook
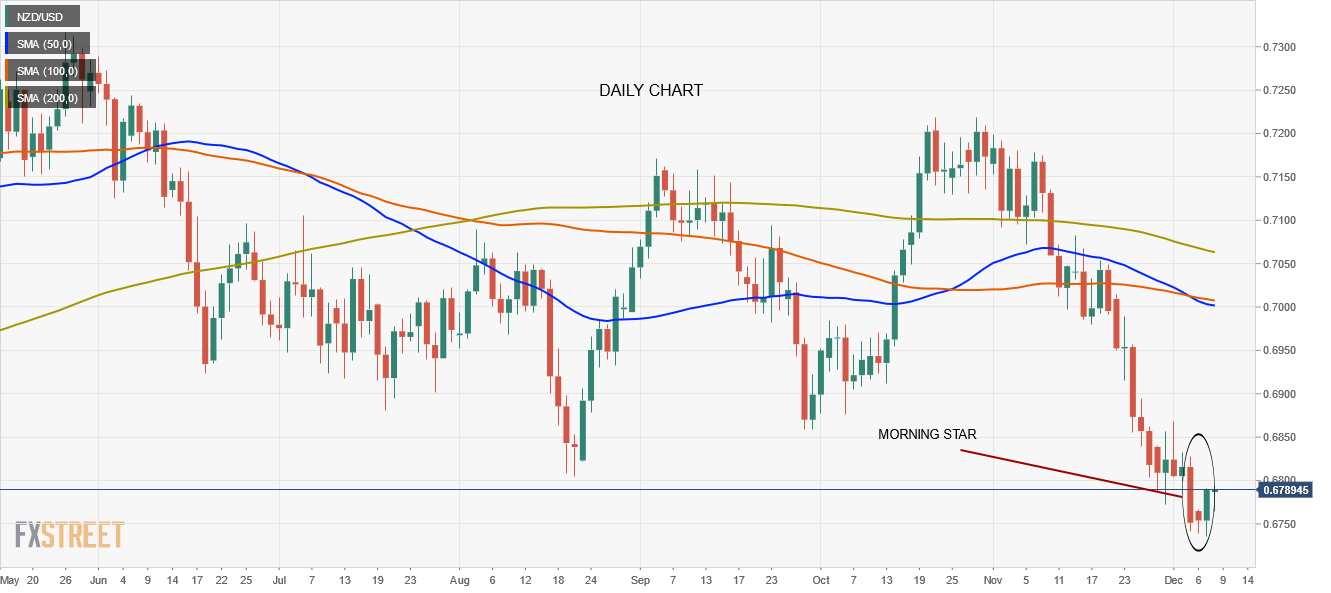
Daily chart
The NZD/USD chart depicts the pair has a downward bias after posting losses on 11 of the last 13 days. Furthermore, the 50-day moving average (DMA) crossed below the 100-DMA, leaving the DMA’s correctly positioned in bearish order with the 200 on top and the 50-DMA on the bottom. Nevertheless, as shown by the candlesticks, the price action of the last three days is forming a morning star, a chart pattern with bullish implications that would need another bullish candle to confirm its validity.
Hence, the bias in the near term is tilted to the upside. The first resistance would be 0.6800. The breach of the latter exposes crucial resistance levels, with the September 28 cycle low-turned-resistance at 0.6859, followed by the figure at 0.6900.
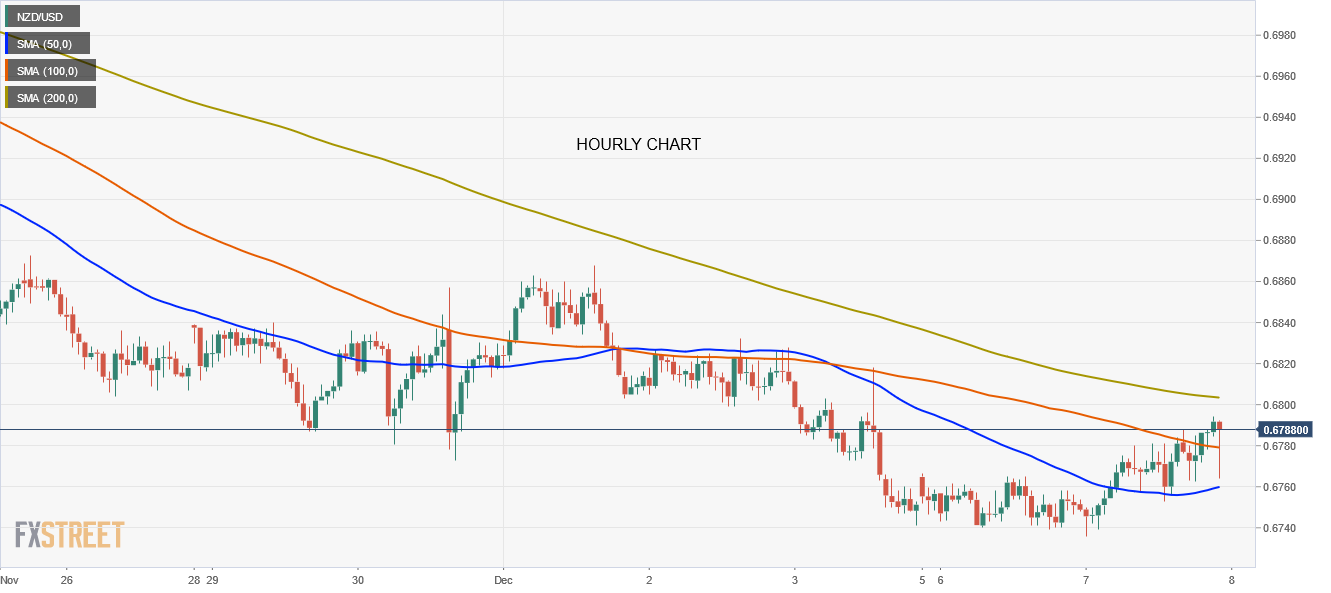
1-hour chart
The NZD/USD broke to the upside of the 100-hour simple moving average (SMA) in the last four hours but stalled around 0.6785. As previously mentioned, the 50 and the 100-hour SMA’s lie below the spot price, so the upward bias is in place, but a break above the 200-hour SMA at 0.6802, could pave the way for further gains.
The first resistance on the way up would be the confluence of the 200-hour SMA and the R1 Wednesday’s daily pivot at 0.6806. A break above that level would expose the R2 pivot at 0.6827, followed by the R3 daily pivot at 0.6862.