AUD/NZD Price Analysis: Bulls are taking on the 1.05’s
![]()
- AUDNZD bulls are taking charge for a test of 1.05 the figure.
- The daily inverse head and shoulders in compelling.
AUD/NZD is on the move in Asia and the price is on the verge of a breakout. The following illustrates the bullish bias from both a longer-term and short term perspective.
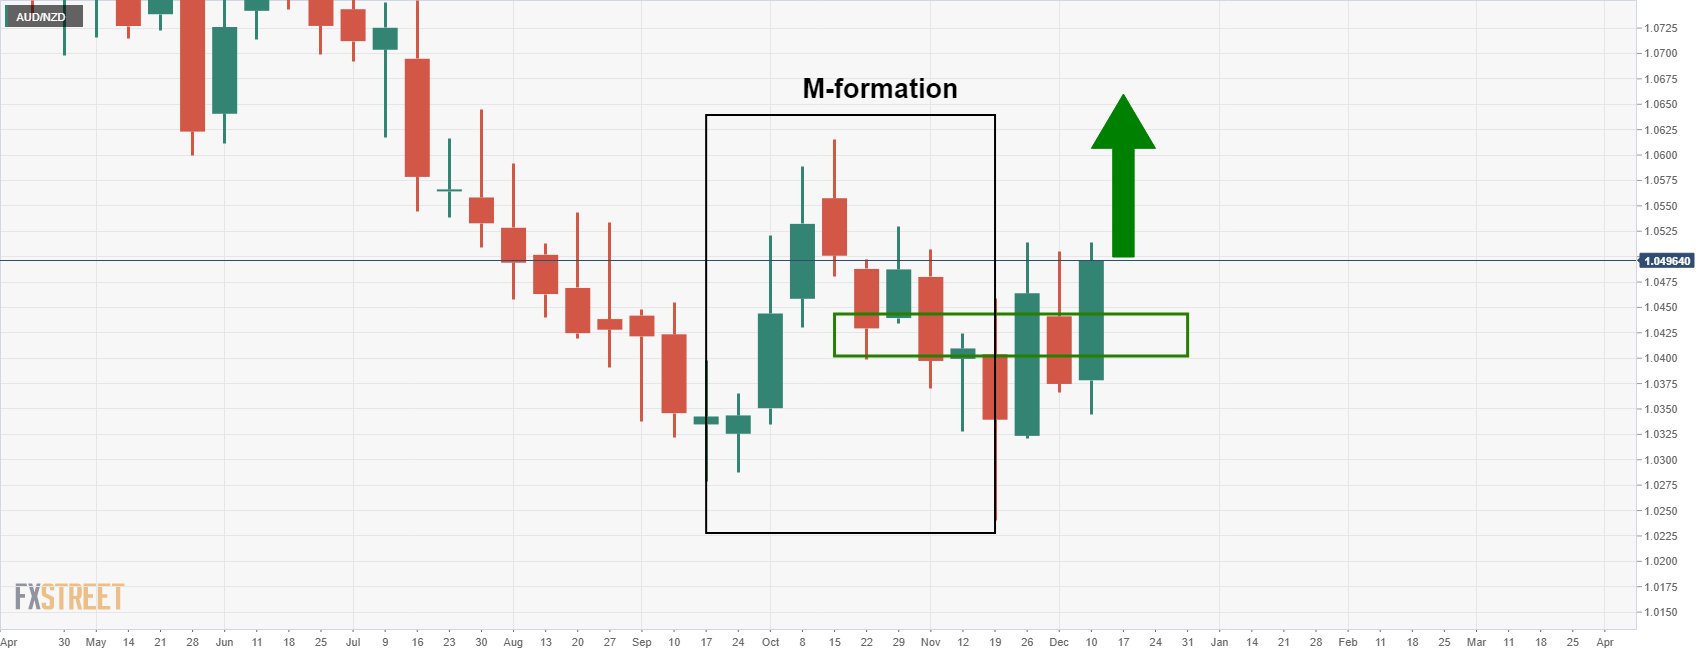
AUD/NZD daily & weekly chart
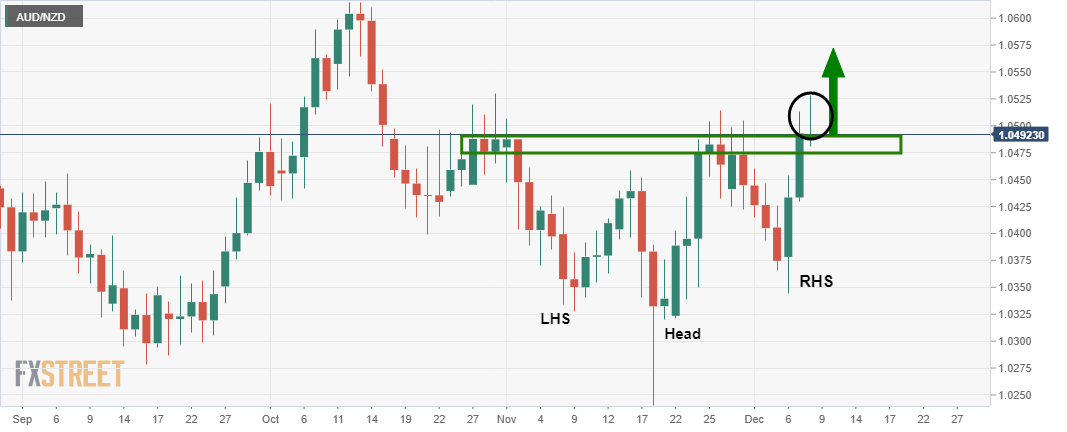
The price is completing am inverse head and shoulders on the daily time frame and has penetrated the weekly chart’s M-formation’s neckline:
The daily chart illustrates the bullish wick that has been left in the prior day’s close which would be expected to be filled in in the coming sessions as per the lower time frame’s price action:
AUD/NZD H1 chart
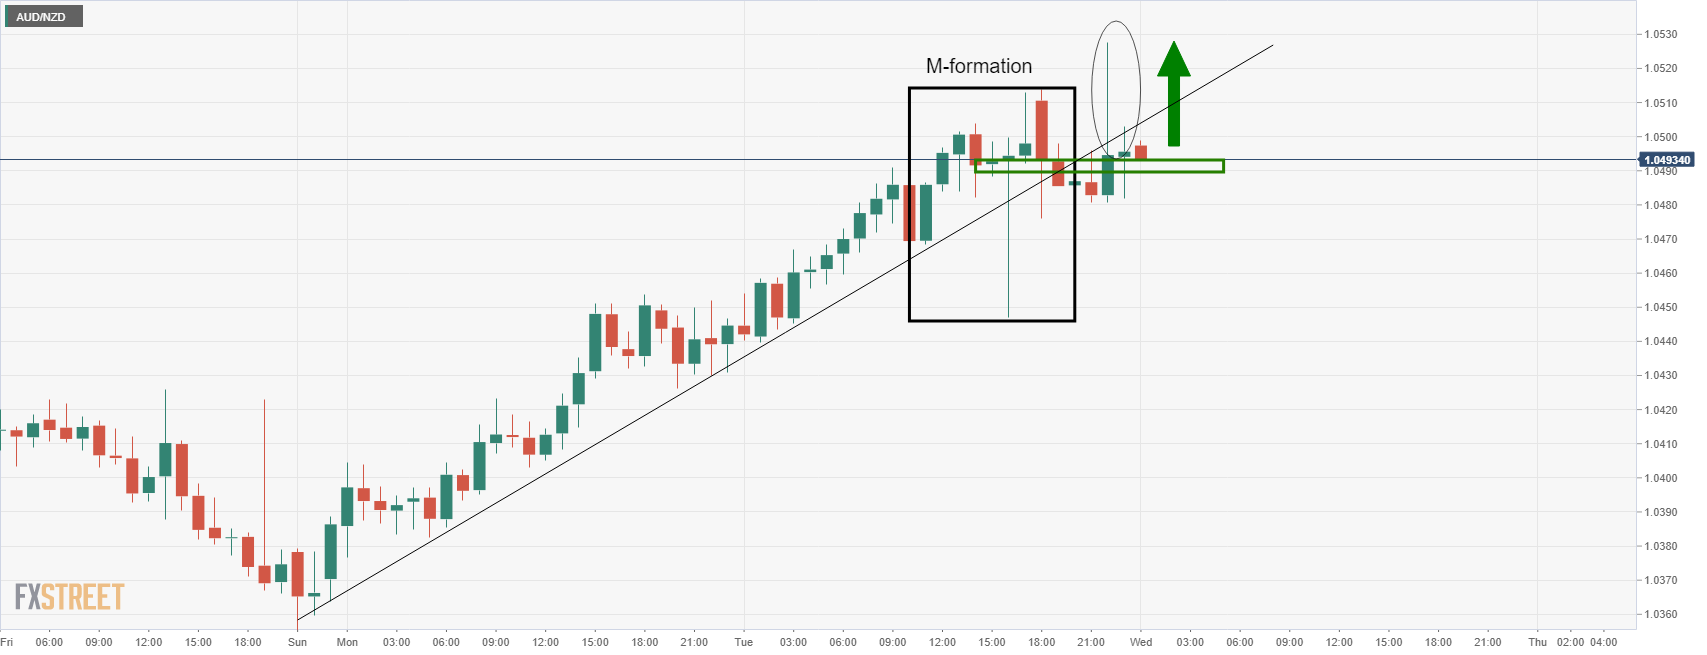
On the hourly chart, the price has formed a bullish structure above what was the prior resistance in the M-formation’s neckline. The counter trendline is all that stands in the way of the price fulling the wick.