Stocks extend their fall as sellers continue to sell, sell, sell.
 Read full post at forexlive.com
The US major stock indices continue to tumble lower. The last two trading days has seen selling into the close, and with less than an hour left and trading, the pattern may be continuing today.
The E-mini S&P futures contract is now broken below its 200 day moving average.
The S&P 500 cash index has been moved below its 200 day moving average earlier today at 4429.24. It is currently trading at 4405.21. It is down 8.6% from its high reached at the beginning of January
The Dow industrial average is on track for its six consecutive down day. It fell below its 200 day moving average at 34950.93 this week, and is currently trading at 34306.17. The Dow Jones is now 7.25% below its high reached at the beginning of this month
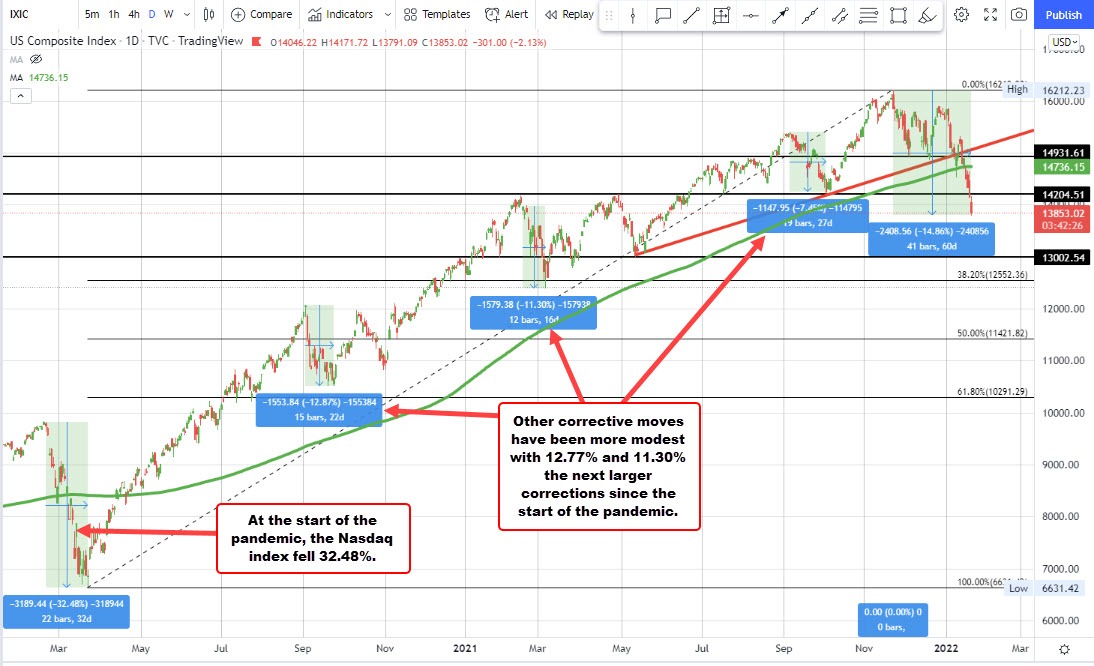
The NASDAQ index is trading down 349 points or -2.46% at 13806.78. It has fallen five the last six trading days and is trading at its lowest level since June 2021. The NASDAQ is 14.86% below its all-time high from November.
Looking back to February/March 2020 at the start of the pandemic, the NASDAQ index fell -32.48%. The decline of 14.86% currently is less than half of that move, but it is the largest correction since that time. Other largish corrective moves have gone 12.87% and 11.30% since that time.
Amazon has reached the lowest level since July 2020, breaking below the March 2021 low of 2880.87. The low price just reached 2841.01. The all-time high price reached in November peaked at $3763.01. It’s down -24% from its high