GBP/USD Price Analysis: Fades bounce off 200-HMA around weekly hurdle
![]()
- GBP/USD pares the first daily loss in three, retreats from intraday high top of late.
- One-week-old horizontal resistance area tests Cable buyers.
- RSI, MACD favor further upside, 200-HMA restricts the bear’s entry.
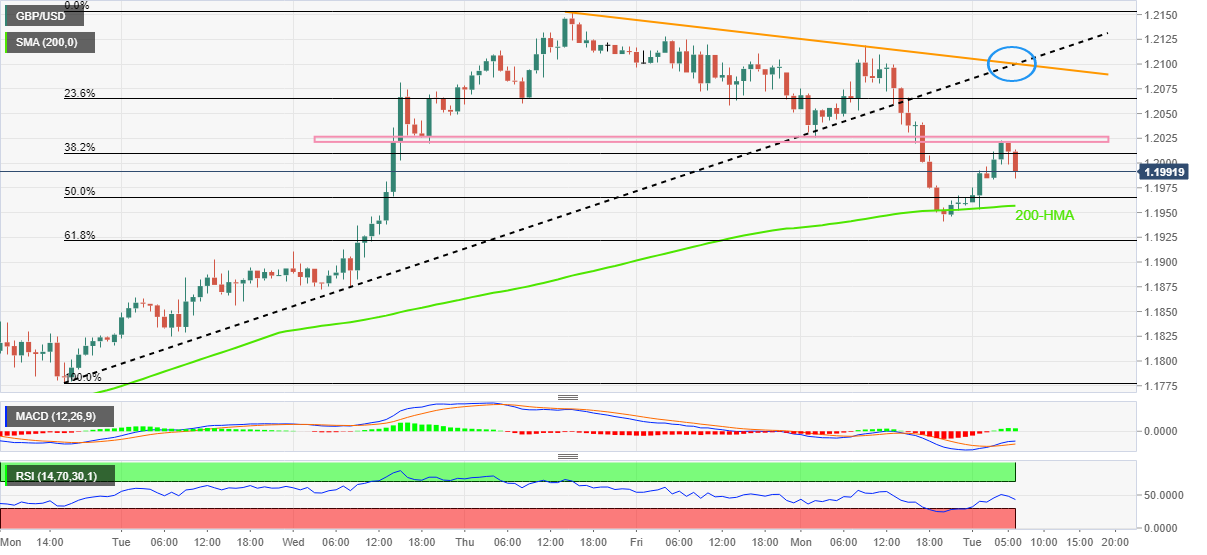
GBP/USD extends pullback from intraday high to 1.2000 as the Cable traders consolidate the first daily gains in three heading into Tuesday’s London open.
In doing so, the quote retreats from a one-week-long horizontal resistance area ahead of the key event, namely Bank of England (BOE) Governor Andrew Bailey’s testimony before the Lords Economic Affairs Committee.
It should, however, be noted that the bullish signals from the Moving Average Convergence and Divergence (MACD) indicator and upbeat Relative Strength Index (RSI), placed at 14, keep the GBP/USD pair buyers hopeful.
That said, the 200-HMA level surrounding 1.1955, challenges intraday sellers of the pair ahead of the 61.8% Fibonacci retracement level of November 21-24 upside, near 1.1920.
In a case where the GBP/USD bears keep the reins past 1.1920, the 1.1900 threshold may act as an intermediate halt during the likely south-run targeting the previous weekly low of 1.1778.
On the flip side, recovery moves need to cross the aforementioned immediate horizontal near 1.2025-30 to retake control.
Even so, a convergence of the previous support line from November 21 and a downward-sloping trend line from the last Thursday, close to 1.2100, will be a tough nut to crack for the GBP/USD buyers.
GBP/USD: Hourly chart
Trend: Pullback expected