Monday 20th May: Weekly technical outlook and review.

EUR/USD:
Weekly gain/loss: -0.67%
Weekly close: 1.1156
Weekly perspective:
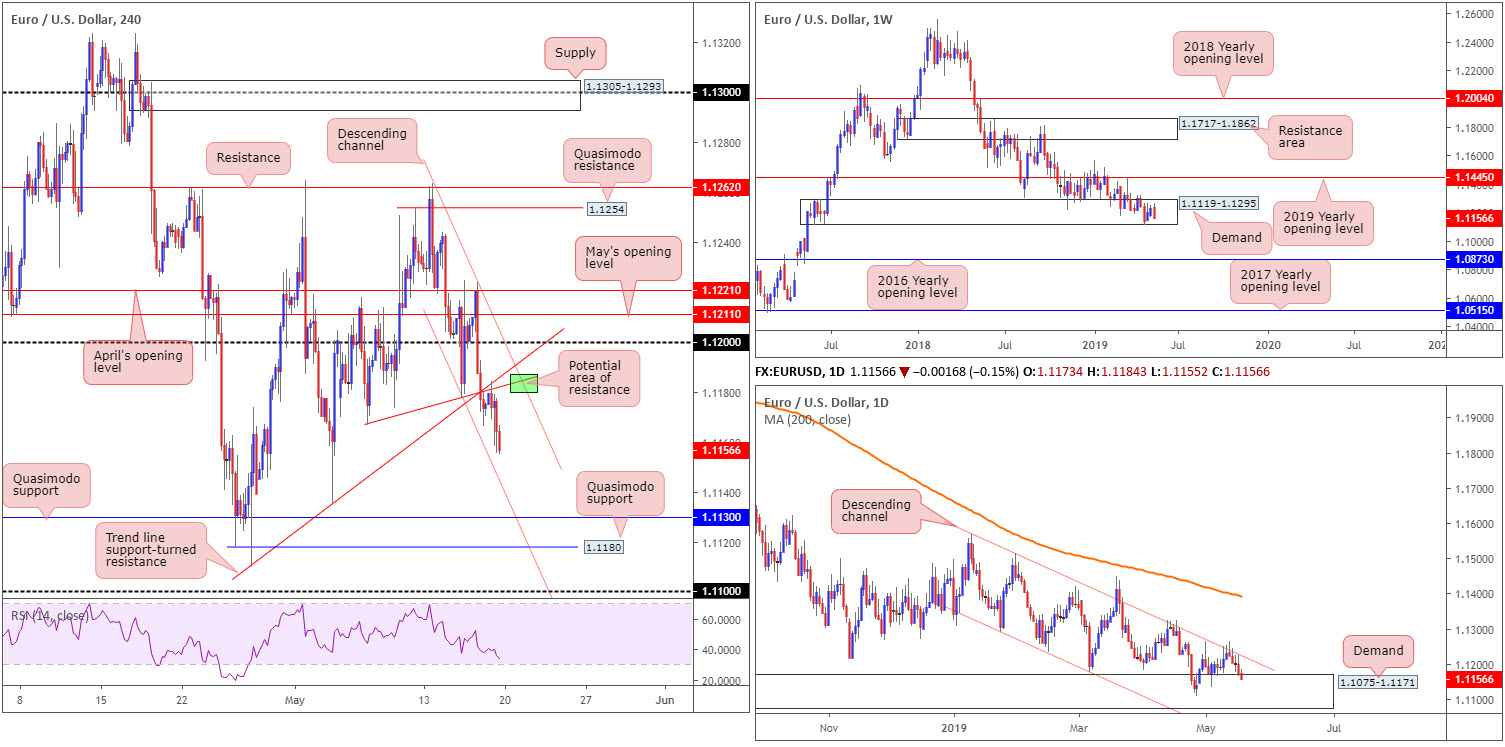
Despite trading within the parapets of a long-standing demand zone at 1.1119-1.1295, last week’s flow witnessed strong selling in the shape of a bearish engulfing formation.
In the event a break of the aforesaid demand is observed, traders’ crosshairs will likely be fixed on the 2016 yearly opening level at 1.0873. This, according to our technical studies, is a strong possibility, given the long-term trend facing a southerly bearing since topping in early 2018.
Daily perspective:
The central focus on the daily timeframe is demand parked at 1.1075-1.1171, thanks to a rejection off long-term channel resistance taken from the high 1.1569. While the demand is glued to the underside of the current weekly demand area, traders are encouraged to pencil in the next downside target on the daily scale: a particularly interesting area of demand coming in at 1.0860-1.0954 (not visible on the screen), which happens to envelope the 2016 yearly opening level mentioned above on the weekly timeframe at 1.0873.
H4 perspective:
A quick recap of Friday’s action shows the single currency entered European hours by way of a retest to the underside of a recently broken trend line support extended from the low 1.1109. Interestingly, this trend line was also bolstered by another trend line support-turned resistance (1.1166).
As the US dollar index picked up steam, this sent the EUR/USD to a session low of 1.1155 into the week’s close. With limited support/demand visible to the left of current price until reaching Quasimodo support at 1.1130, further selling on this timeframe could be in store today/early week. Note also we have another layer of Quasimodo support nearby at 1.1118, followed closely by the 1.11 handle.
Areas of consideration:
Longer term, although the overall trend is facing south, this market is a difficult short owing to demand seen on the weekly and daily timeframes.
Short-term trading, however, is likely to pop lower, at least until shaking hands with H4 Quasimodo support mentioned above at 1.1130. A point of interest (green) on the H4 timeframe for potential selling this week comes in at around 1.1184: the area where channel resistance (taken from the high 1.1263) and the local trend line support-turned resistance highlighted above (1.1166) merges. A retest of this area in the form of a H4 bearish candlestick signal is certainly something to keep an eye on (entry and risk can be structured according to the candlestick’s rules of engagement).
Today’s data points: FOMC Member Clarida Speaks.
GBP/USD:
Weekly gain/loss: -2.20%
Weekly close: 1.2714
Weekly perspective:
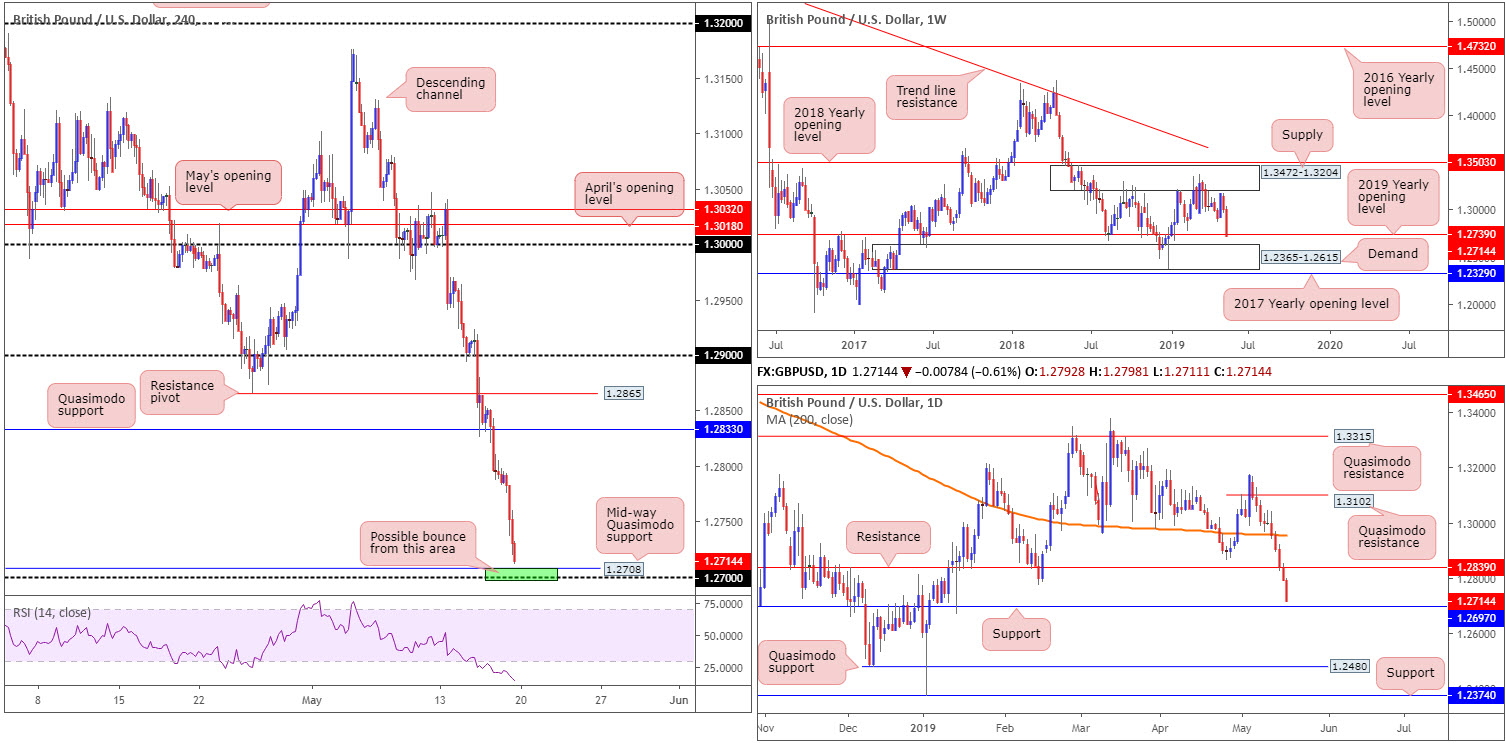
A clear G10 laggard last week, sterling extended losses and finished down more than 250 points by the close. Moulded by way of a near-full-bodied bearish candle, the unit marginally engulfed its 2019 yearly opening level at 1.2739 and now faces a possible test of demand plotted close by at 1.2365-1.2615.
Daily perspective:
Assessing the daily timeframe’s structure, five consecutive bearish daily candles pencilled their way on to the page in recent trading, each closing near its respective low. As you can see, the market ended the week closing within touching distance of a support level drawn from 1.2697, after engulfing support at 1.2839 (now acting resistance) in strong fashion.
It might also be of interest to some traders to note recent movement overthrew the 200-day SMA, indicating sentiment faces a downside trajectory at present.
H4 perspective:
Friday witnessed the British pound come under substantial selling pressure amid a broad downturn in sentiment, with Tory and Labour Parties conceding that efforts to cross red lines and compromise on key issues have been exhausted.
Price action on the H4 timeframe wrapped up the week within striking distance of a mid-way Quasimodo support level at 1.2708, closely shadowed by the 1.27 handle. Another key thing to note here is the daily support level circulates just south of 1.27 at 1.2697. Therefore, between 1.2697/1.2708, we have a potential base of support to work with (green). In the event further selling is seen, however, we could head for H4 demand pencilled in at 1.2606-1.2646 (not visible on the screen), which captures the top edge of weekly demand mentioned above at 1.2365-1.2615.
Areas of consideration:
Although the market has been incredibly bearish as of late, a bounce from the green H4 support zone at 1.2697/1.2708 could come to fruition early week. As round numbers tend to entice fakeouts, though, waiting for additional confirmation to form might be an idea. A H4 bullish candlestick signal, for example, might be enough to attract buyers into the market. Not only does a candlestick pattern help identify buyer intent, it also provides traders entry and risk levels to work with.
Today’s data points: MPC Member Broadbent Speaks; FOMC Member Clarida Speaks.
AUD/USD:
Weekly gain/loss: -1.89%
Weekly close: 0.6866
Weekly perspective:
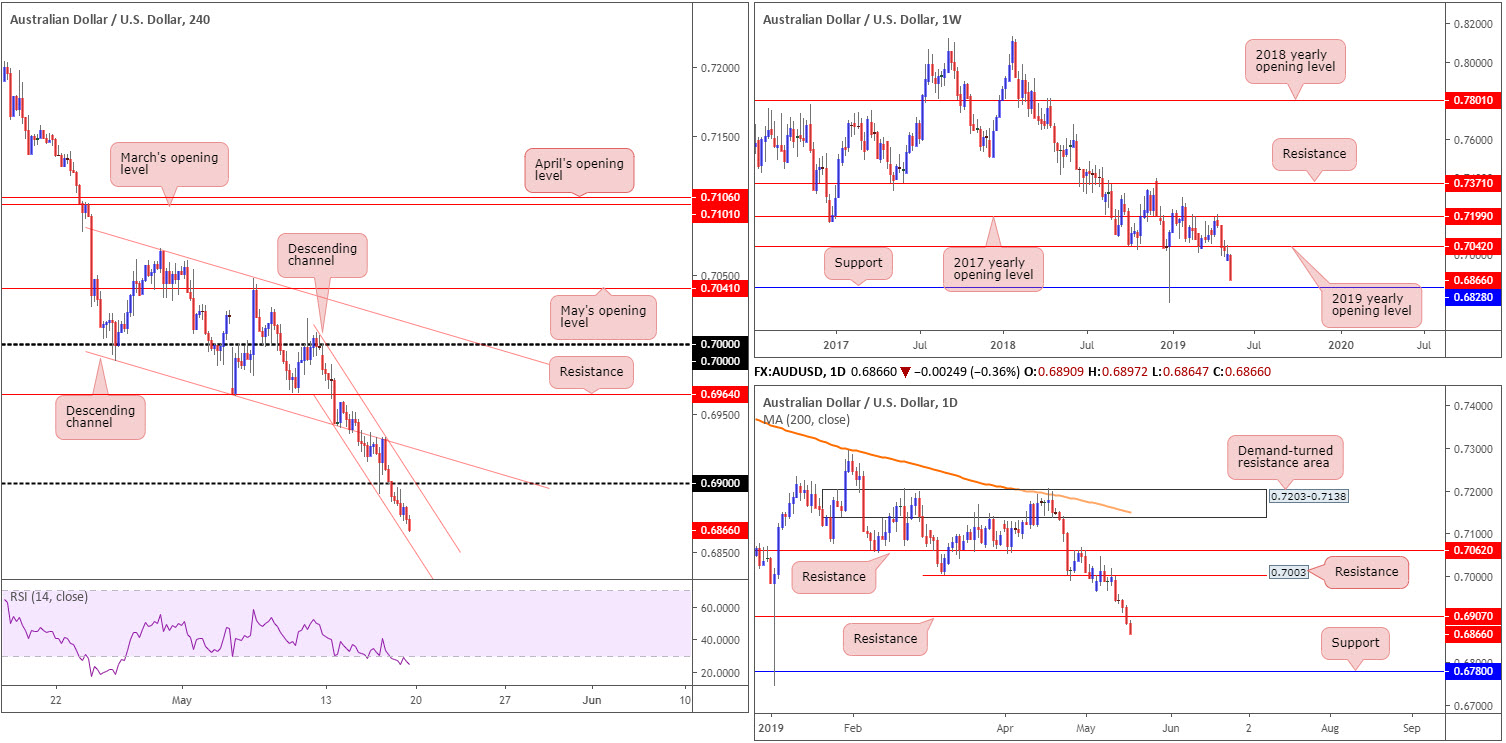
Suffering hefty losses vs. its US counterpart, the Australian dollar, organised as a full-bodied bearish candle, ended the week down more than 130 points. According to the market’s technical position, the next downside target enters the fold at support drawn from 0.6828.
Daily perspective:
Resistance coming in at 0.7003 remained in focus in early trading last week, drawing sellers into the market and eventually dethroning nearby support at 0.6907 (now acting resistance). In similar fashion to the weekly timeframe’s projection, the daily timeframe has its centre line fixed on support at 0.6780 (50 points beneath the weekly timeframe’s next downside barrier).
H4 perspective:
Following four days in negative waters, Friday’s session extended its slide into the fifth day and tested levels not seen since early January. With the 0.69 handle now a distant memory, on-going US/China trade issues continues to weigh on the commodity-linked currency.
In terms of surrounding technical structure, options are limited to the 0.69 resistance, a narrow descending channel pattern (0.7009/0.6942) and the 0.68 handle (not seen on the screen). Support could also form off the 0.6850 point as well.
Areas of consideration:
On account of the technical picture, all three timeframes demonstrate desire to explore lower ground this week, at least until connecting with weekly support highlighted above at 0.6828.
With this being the case, traders may find use in the current H4 channel: selling the upper limit and attempting to ride the trend towards 0.6828 as an initial take-profit zone. Conservative traders might opt to observe price action before pressing the sell button as a breakout of the channel back up to 0.69 is always a possibility. Price action confirmation can take many forms, with the simplest being a bearish candlestick formation, be it on the H4 or lower timeframes. Another idea is waiting for an MA crossover to take shape.
Entry and risk can be plotted according to the selected confirmation technique.
Today’s data points: FOMC Member Clarida Speaks.
USD/JPY:
Weekly gain/loss: +0.11%
Weekly close: 110.05
Weekly perspective:
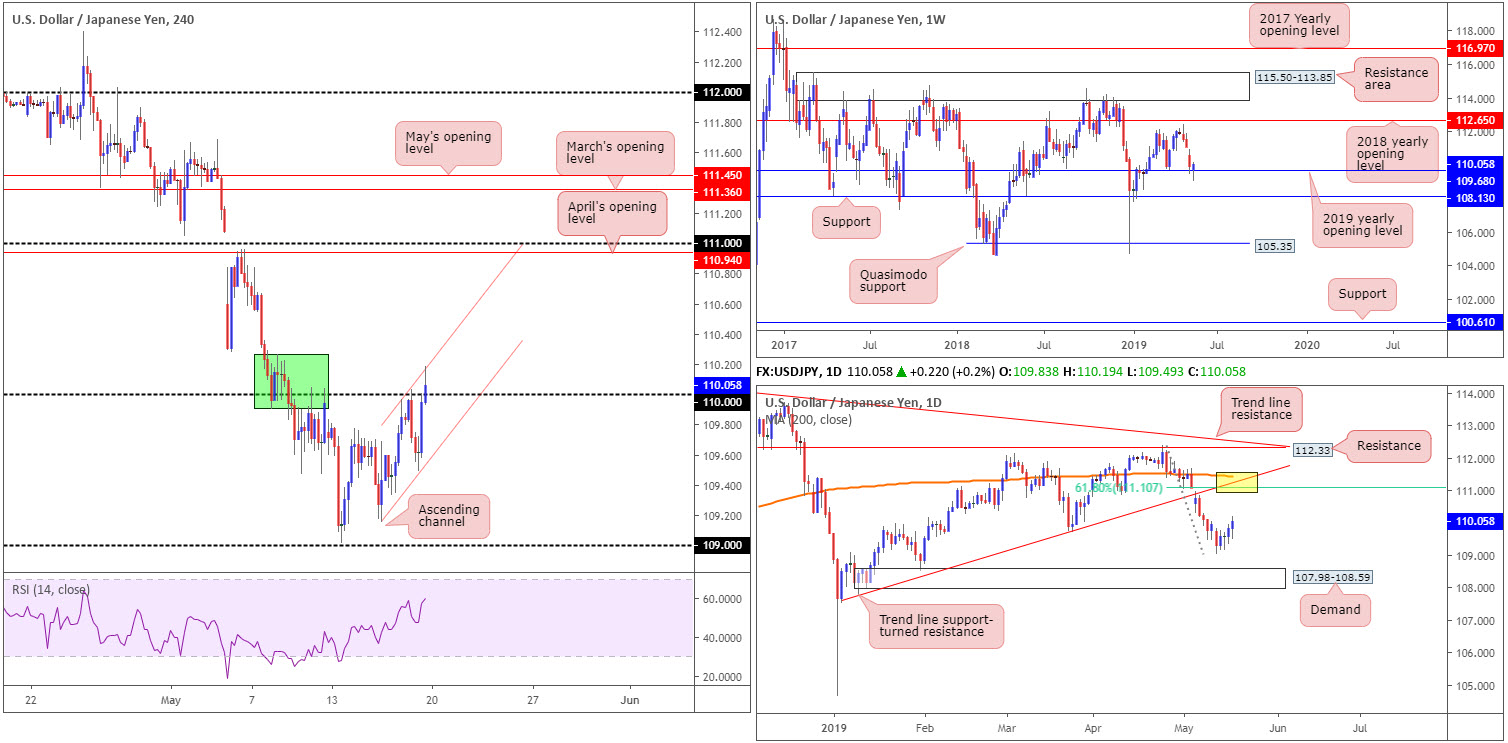
USD/JPY action managed to eke out marginal gains over the course of last week, consequently breaking a three-week bearish phase. The recovery formed by way of a reasonably attractive hammer pattern off its 2019 yearly opening level at 109.68. Continued bidding could ultimately witness the pair knock on the door of its 2018 yearly opening level at 112.65, whereas a move to the downside has support on the radar at 108.13.
Daily perspective:
Leaving demand at 107.98-108.59 unchallenged, price action on the daily timeframe appears poised to approach a 61.8% Fibonacci resistance at 111.10. What gives this Fib level extra credibility is a merging trend line support-turned resistance etched from the low 107.77 and the 200-day SMA (yellow).
Therefore, for traders looking to buy the recently formed hammer pattern on the weekly timeframe, it might be worth noting possible resistance could form from the 111.10ish region.
H4 perspective:
After failing to sustain gains beyond 110 in early hours Friday, the pair encountered a fresh floor of buying off channel support extended from the low 109.15. Technical support, coupled with the US index trading above weekly resistance at 97.72 and US equities climbing higher, saw the day conclude reclaiming 110+ status.
Although the pair is technically above 110, as well as the higher-timeframe picture exhibiting scope to press north, there are still two cautionary H4 points to consider:
- H4 supply marked in green at 110.26-109.90.
- H4 channel resistance stretched from the high 109.96.
Areas of consideration:
In order to become buyers above 110 early week, traders might want to consider waiting and seeing if the H4 candles formulate a retest off the psychological boundary. This helps confirm buyer intent and also gives credence to higher-timeframe direction. Upon a successful rejection off 110, a long on the close of the candle is an option with a protective stop-loss order plotted beneath its lower shadow.
Today’s data points: FOMC Member Clarida Speaks.
USD/CAD:
Weekly gain/loss: +0.36%
Weekly close: 1.3461
Weekly perspective:
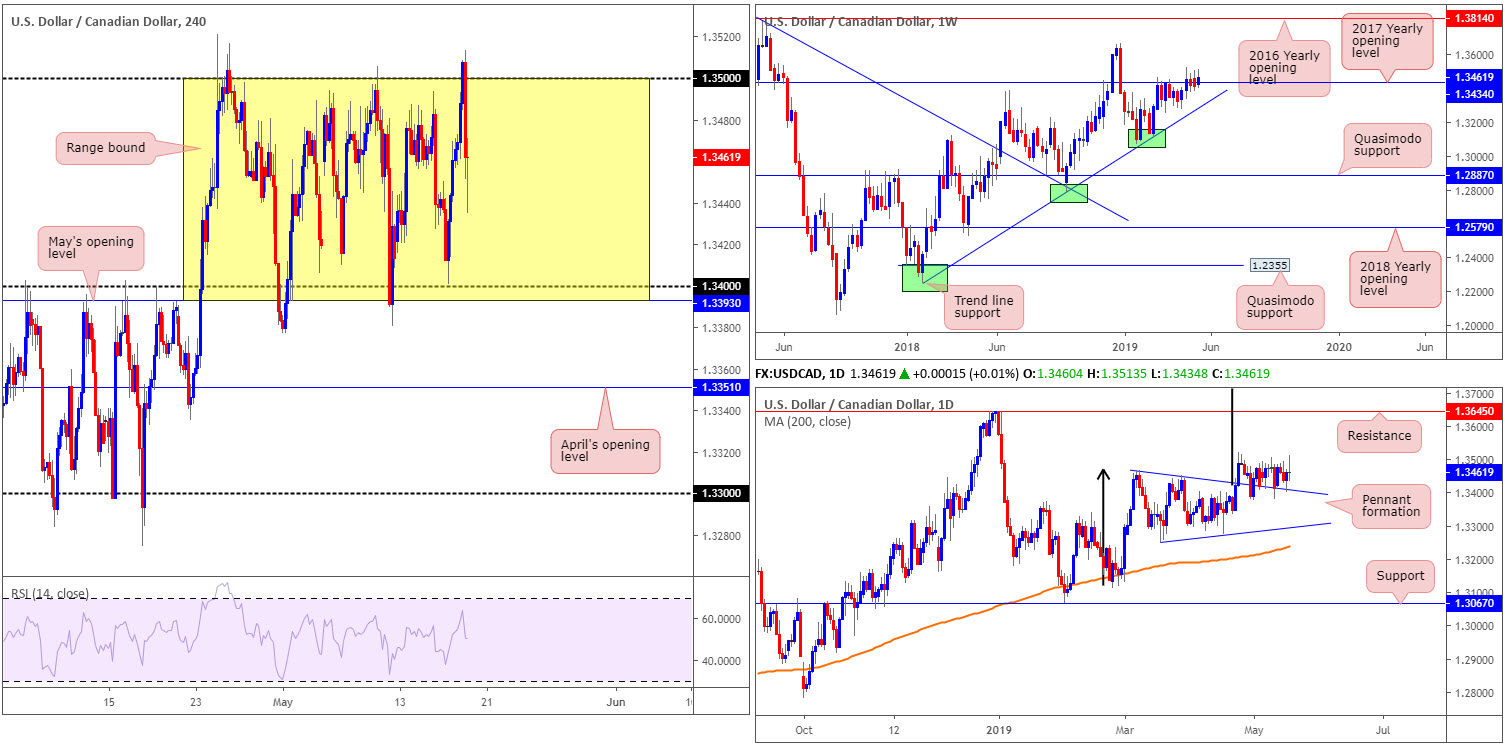
Although longer-term flows broke out above the 2017 yearly opening level at 1.3434, so far price action has failed to generate much follow-through momentum. Areas outside of this level to be aware of fall in around the 2018 yearly high of 1.3664, and a trend line support etched from the low 1.2247.
Daily perspective:
A closer reading of price action shows the daily candles continue to feed off support drawn from the top edge of a pennant pattern (1.3467). Although the traditional price target (calculated by taking the distance from the beginning of the preceding move and adding it to the breakout price) remains on the chart at 1.3768 (black arrows), the next upside target from a structural standpoint falls in around resistance at 1.3645.
H4 perspective:
Technically speaking, the H4 candles remain within a 100-point+ range between May’s opening level at 1.3393 and the round number 1.35.
Price action, however, advanced to a fresh high of 1.3513 in early US hours Friday, its highest level since April 25. Despite this, buyers failed to hold upside momentum and turned lower into the close amid headlines surrounding US/Canada trade negotiations.
Areas of consideration:
1.34/May’s opening level at 1.3393 is an area of interest this week for possible longs. Not only does the base represent the lower edge of the current H4 range, it is also further reinforced by the top edge of the daily pennant formation highlighted above. For conservative traders, waiting for a H4 bullish candlestick to print from this region will help identify buyer intent and also serve as a structure to base entry and risk levels from.
In the event we fail to reach 1.34 and turn higher, nonetheless, the market may observe a H4 close form above 1.35. Should this occur, traders have the choice of either buying the breakout candle and placing stop-loss orders beneath its tail, or waiting and seeing if a retest scenario takes shape and entering on the back of the rejection candle’s structure. The next upside target on the H4 scale can be seen around 1.3570 (not seen on the screen), though according to the higher timeframes we could be heading much higher.
Today’s data points: FOMC Member Clarida Speaks; Canadian banks are closed in observance of Victoria Day.
USD/CHF:
Weekly gain/loss: -0.07%
Weekly close: 1.0108
Weekly perspective:
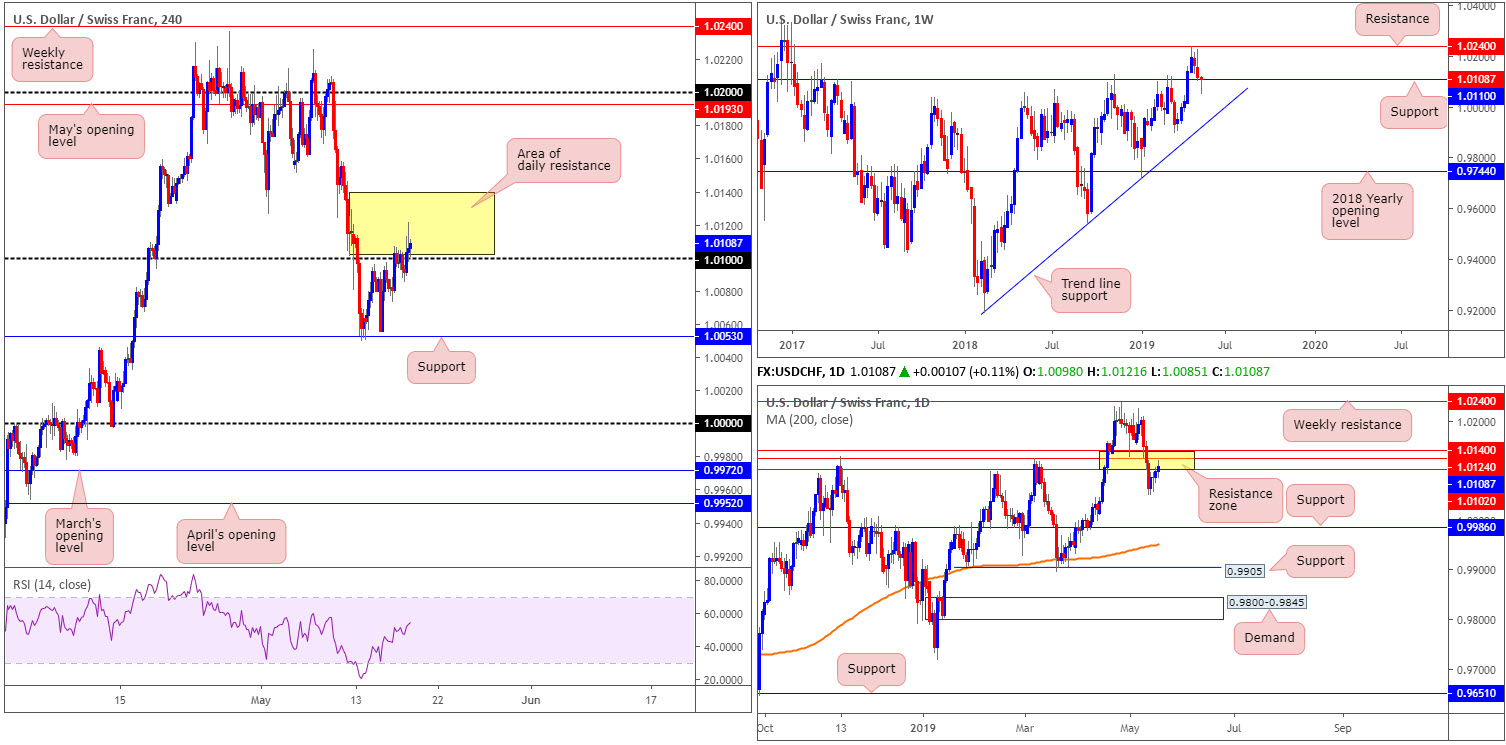
The buck’s retreat from the 2019 high 1.0236 set towards the end of May continued last week, though downside momentum decreased considerably and formed a nice-looking hammer formation off support at 1.0110. For that reason, the order of the week may be to the upside, targeting resistance plotted at 1.0240. A failure of the aforementioned support, nonetheless, positions trend line support (etched from the low 0.9187) in the firing range.
Daily perspective:
Contrary to weekly price, a resistance zone between 1.0102/1.0140 is in motion on the daily timeframe (yellow). A rejection from this barrier this week has last Tuesday’s low at 1.0050 in sight, followed then by a possible run towards support fashioned at 0.9986.
H4 perspective:
The US dollar gained modestly versus the Swiss franc Friday amid a broad-based USD advance (US dollar index). Registering its fourth consecutive daily gain, the H4 candles wrapped up the week brushing aside 1.01. While the push above 1.01 is considered a bullish indicator, traders should remain cognizant of where we’re trading on the higher timeframes. Granted, weekly buying may emerge on the back of weekly price finding support off 1.0110, though pressing through the collection of resistances on the daily timeframe between 1.0040/1.0102 is likely to be a challenge.
Areas of consideration:
With the H4 candles yet to produce much in the way of bullish intent above 1.01 (check out the real bodies of the candles) and daily price testing an area of resistance, traders considering a long position above 1.01 are encouraged to exercise caution.
The research team believes the buyers have yet to prove themselves on the H4 timeframe. A retest of 1.01 in the form of a strong bullish rotation candle (a full or near-full-bodied candle), however, would certainly place buying above 1.01 in a more favourable light. But until that time, patience is key.
Should we push beneath 1.01 this week, shorts on the retest of the figure are also of interest, targeting H4 support at 1.0053 as the initial port of call.
Irrespective of what direction one selects around 1.01, waiting for additional H4 candlestick confirmation to develop is encouraged. Entry and risk levels can then be defined according to the selected candlestick formation.
Today’s data points: FOMC Member Clarida Speaks.
Dow Jones Industrial Average:
Weekly gain/loss: -0.72%
Weekly close: 25756
Weekly perspective:
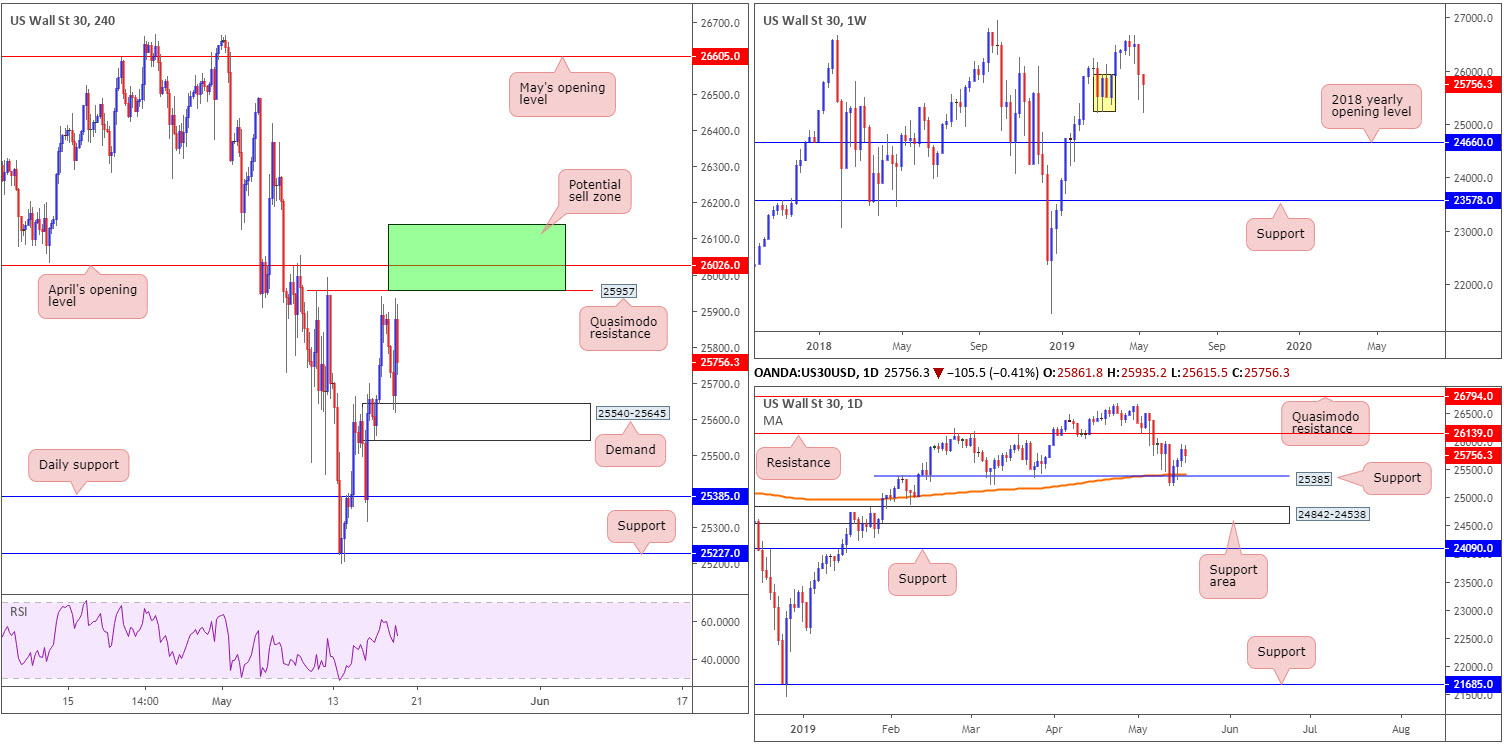
Demand marked in yellow at 25217-25927, although unlikely to be considered a strong area on this timeframe owing to limited momentum produced from the base, remains in the fold. However, traders may also want to acknowledge weekly price finished the week in the form of a hammer candlestick pattern. In the event this entices buyers into the market, we could be looking at a run towards the 26668 April 22 high, while a move to the downside has the 2018 yearly opening level to target at 24660.
Daily perspective:
Early week observed the index shake hands with notable support at 25385 on the daily timeframe, which happened to intersect with the 200-day SMA. Technically, this provided a platform for buyers to enter the market, with the next upside point of interest falling in at resistance fixed from 26139.
H4 perspective:
The Dow Jones Industrial Average fell for the first time in three days Friday, amid a market rattled by a barrage of trade-related headlines.
H4 flow has the candles positioned a few points south of a Quasimodo resistance at 25957, trailed closely by April’s opening level at 26026. To the downside, nonetheless, price finds nearby support from demand at 25540-25645. Beyond here, the research team also has daily support mentioned above at 25385 sited on the chart.
Areas of consideration:
While there is scope for a push higher on the weekly timeframe, daily price has resistance plotted within touching distance at 26139. On top of this, we also have short-term resistance on the H4 timeframe between 26026 and 25957. This resistance makes the current weekly hammer formation a problematic long, according to our technical studies.
On account of the above, the green area plotted on the H4 timeframe between 26139 (the daily resistance level) and 25957 (the collection of H4 resistances) is a zone worthy of attention this week for shorts. An ideal scenario would be for the H4 candles to chalk up a notable bearish candlestick configuration. Entry can be applied according to the candlestick’s rules, though stop-loss placement may be either above the daily resistance at 26139 (conservative) or above the upper shadow of the candlestick signal (aggressive).
Today’s data points: FOMC Member Clarida Speaks.
XAU/USD (GOLD):
Weekly gain/loss: -0.66%
Weekly close: 1277.1
Weekly perspective:
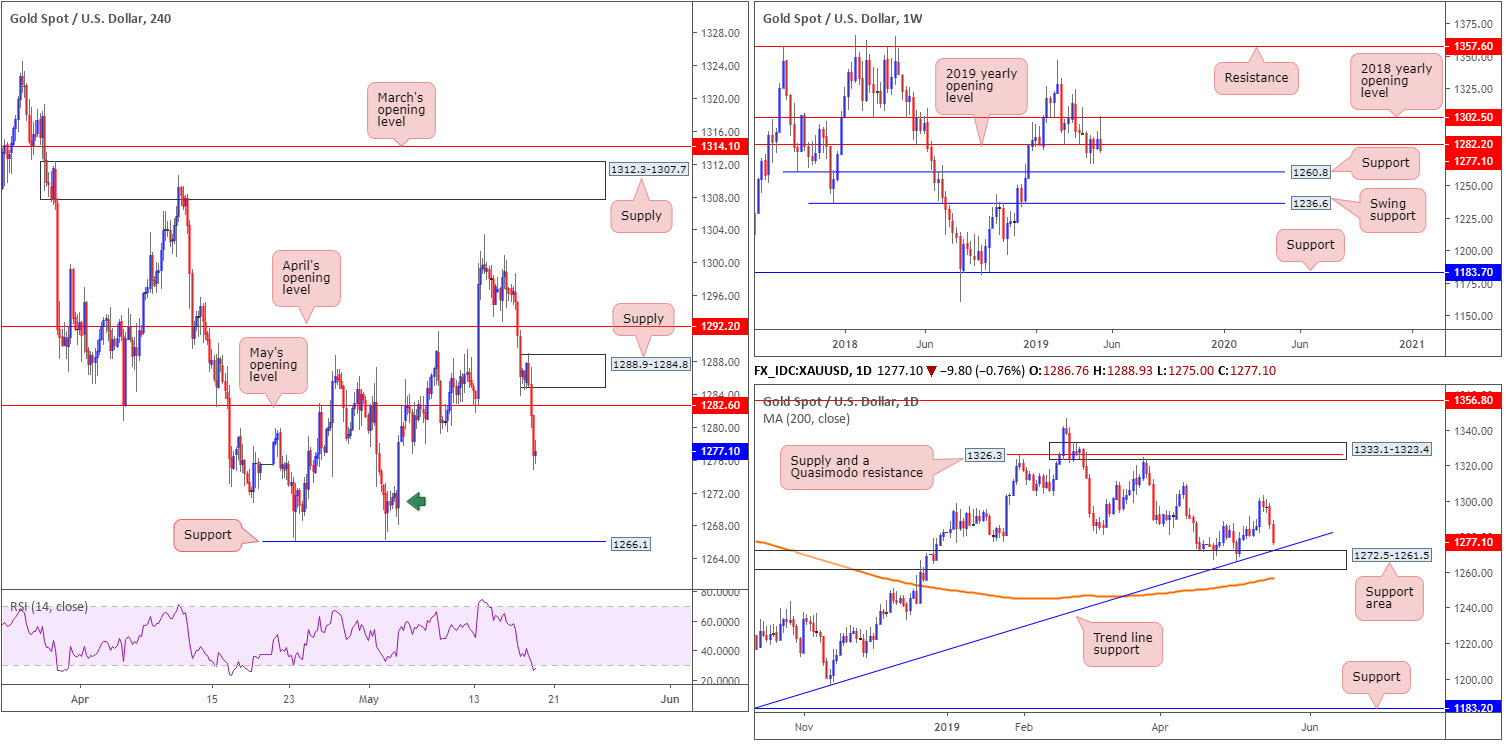
The 2018 yearly opening level at 1302.5, as you can see, was aggressively challenged last week and held almost to the point. Selling from this angle brought price action back beneath its 2019 yearly opening level at 1282.2 and produced a bearish shooting star pattern. This, by and of itself, has likely garnered the attention of candlestick enthusiasts and could weigh on the market this week towards support coming in at 1260.8.
Daily perspective:
Sited just north of the weekly support level mentioned above at 1260.8 is a daily support area seen at 1272.5-1261.5. The zone boasts a reasonably solid history and merges with a trend line support taken from the low 1160.3. What’s also notable from a technical perspective is the 200-day SMA appears poised to converge with the said support zone in the near future.
H4 perspective:
A quick recap of Friday’s movement on the H4 timeframe reveals bullion extended losses, as the prevailing risk-on atmosphere limited demand for safe-haven assets. Also weighing on losses was a dominant greenback and some upbeat earnings figures from large US corporations.
Technically, the research notes limited support until reaching demand (green arrow) at 1268.1-1272.3, followed closely by support at 1266.1. Note the current H4 demand area also resides around the top edge of the daily support area at 1272.5-1261.5. Should price turn higher before probing lower, resistance surfaces at May’s opening level drawn from 1282.6 (merges closely with the 2019 yearly opening level mentioned above on the weekly timeframe at 1282.2).
Areas of consideration:
The H4 supply at 1288.9-1284.8, positioned directly above May’s opening level at 1282.6 (and the 2019 yearly opening level on the weekly timeframe at 1282.2) is an area sellers potentially have interest in this week. This is due to the stop-loss orders likely accumulating above May’s opening level, thus providing strong liquidity to sell into.
The H4 demand marked with a green arrow at 1268.1-1272.3 is also a point of interest for longs this week, owing to its connection to the top base of a daily support area at 1272.5-1261.5.
Both areas, according to our technical reading, house considerable strength and are likely to hold should a test (under normal market conditions) be observed. However, for the more conservative traders, they may wish to wait and see how H4 action behaves before pulling the trigger. While this may sacrifice the ‘better’ entry, it’s offset by having additional confluence backing the trade, and therefore a higher probability of moving in favour.
The accuracy, completeness and timeliness of the information contained on this site cannot be guaranteed. IC Markets does not warranty, guarantee or make any representations, or assume any liability with regard to financial results based on the use of the information in the site.
News, views, opinions, recommendations and other information obtained from sources outside of www.icmarkets.com.au, used in this site are believed to be reliable, but we cannot guarantee their accuracy or completeness. All such information is subject to change at any time without notice. IC Markets assumes no responsibility for the content of any linked site. The fact that such links may exist does not indicate approval or endorsement of any material contained on any linked site.
IC Markets is not liable for any harm caused by the transmission, through accessing the services or information on this site, of a computer virus, or other computer code or programming device that might be used to access, delete, damage, disable, disrupt or otherwise impede in any manner, the operation of the site or of any user’s software, hardware, data or property.