Friday 13th September: Dollar index struggling to gain traction ahead of retail sales data.

Key risk events today:
US Core Retail Sales m/m; US Retail Sales m/m; US Prelim UoM Consumer Sentiment.
EUR/USD:
The European Central Bank (ECB) went above and beyond on Thursday in rolling out an enormous stimulus package. The central bank unveiled fresh stimulus measures to bolster the eurozone, including cutting a key interest rate and reintroducing open-ended QE, announcing bond buying for €20 billion per month starting November 1st. The deposit facility rate was already negative, though has now been cut 10bps from minus 0.4% to minus 0.5%.
Despite a boisterous session, ranging 160 points, Europe’s shared currency concluded the day higher against the buck by around 0.50%.
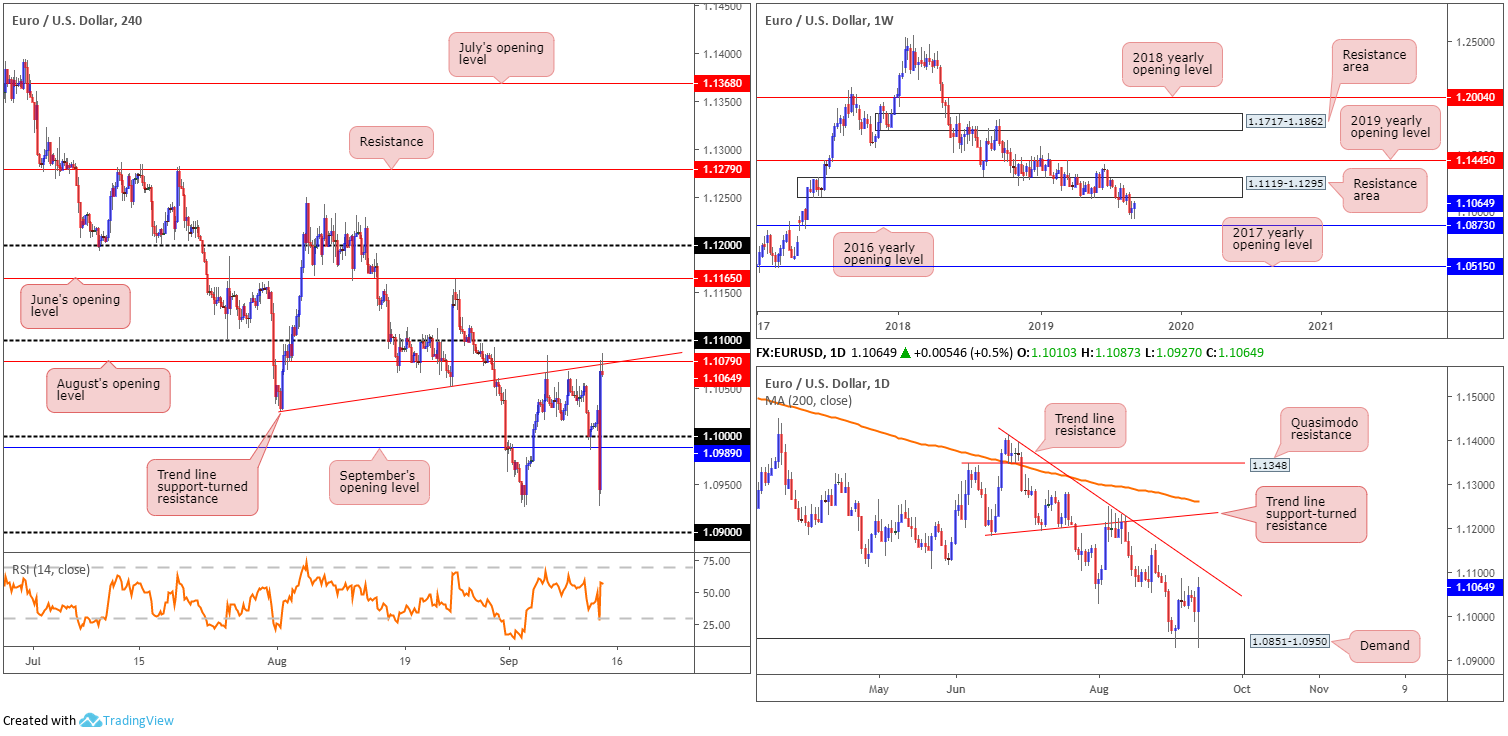
Higher-timeframe analysis shows weekly price languishing south of 1.1119-1.1295, a demand-turned resistance area. Current action is leaning towards a retest of the zone with the 2016 yearly opening level at 1.0873 fixed as the next downside target. Elsewhere, daily flow remains buoyed by demand pencilled in at 1.0851-1.0950 – houses the 2016 yearly opening level within its lower limits. Thanks to strong bidding yesterday, forming a clear-cut bullish outside day formation, trend line resistance taken from the high 1.1412 is now in sight.
Closer examination of price action on the H4 timeframe reveals the candles settled around the underside of August’s opening level at 1.1079, which happens to intersect with a trend line support-turned resistance etched from the low 1.1026. Note, another layer of potential resistance resides close by at 1.11, whereas to the downside, 1.10 remains in view, closely shadowed by September’s opening level at 1.0989.
Areas of consideration:
Although the H4 candles are defending 1.1079, the 1.11 handle is prime for an attack, according to our chart studies. Round numbers, as most are aware, are prone to stop runs. This is due to the number of orders these levels attract. With the underside of weekly resistance set just north at 1.1119 and the daily trend line resistance that comes in a touch above the psychological mark, a fakeout through 1.11 to these higher-timeframe barriers is a reasonable possibility. Buy stops tripped above 1.11 and higher-timeframe sellers entering the fold from the said zones will likely cause strong selling, carrying price action back down to at least 1.10ish.
On account of the above, traders are urged to set alerts at 1.11. A fakeout through this number to the said higher-timeframe levels that closes south on a H4 basis is a strong sell signal, with entry on the close of the candle likely eyed and stops plotted above the fakeout high.
GBP/USD:
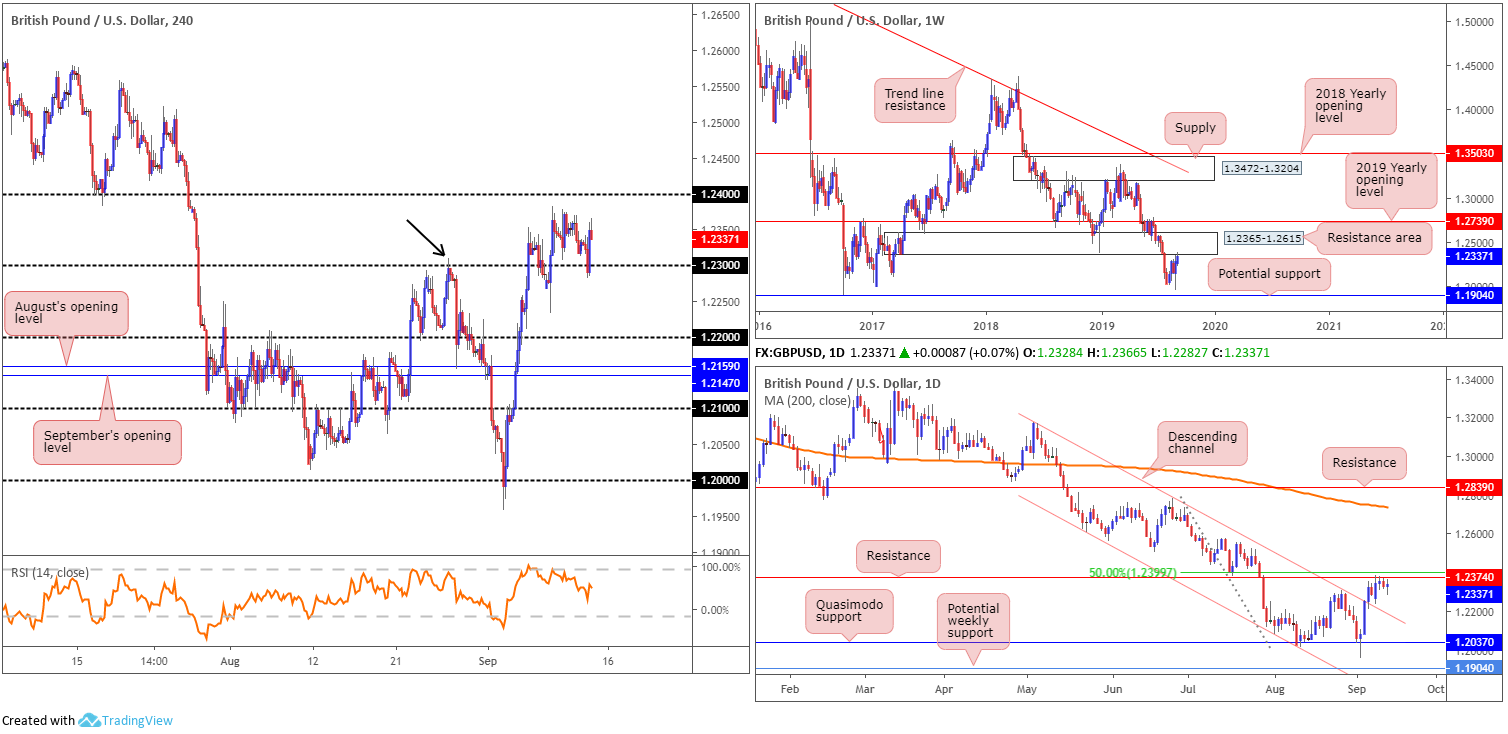
The British pound wrapped up Thursday’s session a shade higher vs. the buck, +0.07%. Recovering from a session low at 1.2282, trailing the euro lower after ECB movement, the GBP/USD respected 1.23 as support and clocked highs at 1.2366 going into the close.
Having seen the notable high set at 1.2309 (black arrow) recently engulfed on the H4 scale, many traders will likely look upon the retest at 1.23 as a cue to begin buying this market. While a run higher could certainly materialise, caution is suggested. Higher-timeframe analysis has a weekly resistance area positioned at 1.2365-1.2615 in motion, and daily price is tackling resistance at 1.2374, closely shadowed by a 50.0% resistance value at 1.2399.
Areas of consideration:
Although the retest off 1.23 is appealing, and could entice additional buying, entering long into higher-timeframe resistance is an enormous partition to overcome. With that being the case, Thursday’s outlook remains unchanged:
Considering the technical position on the higher timeframes, sellers likely have the upper hand. Before pressing the sell button, though, traders are urged to let H4 price prove itself: reclaiming 1.23 to the downside which should clear the pathway south to at least 1.22. A H4 close below 1.23 that’s followed up by a retest is considered an ideal sell signal (entry and risk can be determined on the back of the rejection candle’s framework).
AUD/USD:
Although clocking fresh weekly highs at 0.6894, the commodity-linked currency failed to generate anything meaningful to the upside, concluding the session little moved. In response to this, the research team feels the previous technical briefing holds:
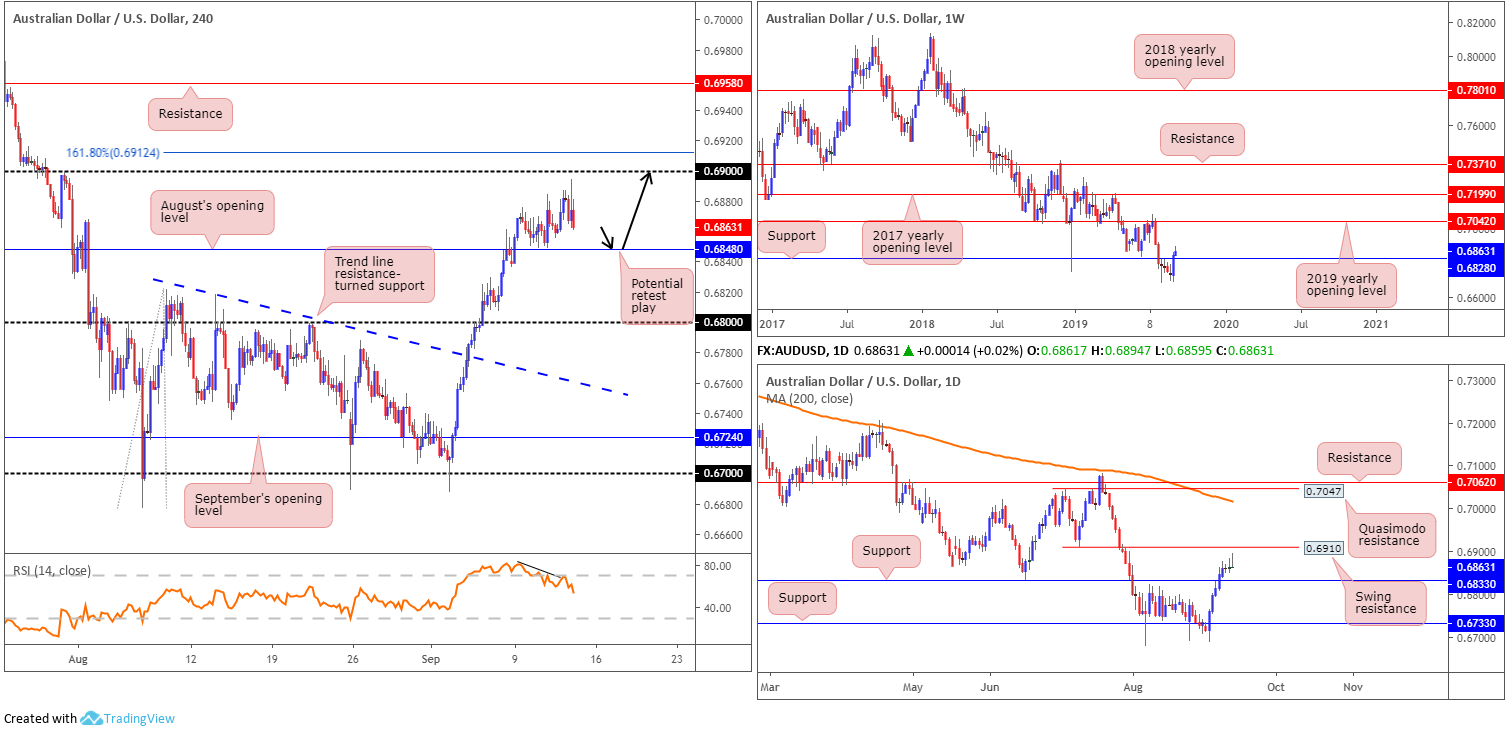
Kicking things off on the weekly timeframe, we can see the pair staged a strong comeback last week. By way of a bullish outside day, the unit wrapped up the week north of support at 0.6828. If buyers remain in the driving seat, an approach towards the 2019 yearly opening level at 0.7042 is likely on the cards.
In conjunction with weekly structure, the daily timeframe also ended last week north of support at 0.6833. The next upside target on this scale, nonetheless, falls in at 0.6910, a swing resistance, though beyond here the research team has eyes on Quasimodo resistance at 0.7047 and resistance at 0.7062. It might also interest some traders to note the 200-day SMA also lurks close by at 0.7023 (orange).
Across the page, H4 movement is set just north of August’s opening level at 0.6848, with upside reasonably clear to 0.69, closely followed by a 161.8% Fibonacci ext. point at 0.6912. Indicator-based traders, however, may wish to acknowledge the RSI is exiting overbought terrain and producing negative divergence.
Areas of consideration:
Considering the bullish theme on the higher timeframes right now, entering long based on a retest at August’s opening level drawn from 0.6848 on the H4 is still the favoured option. A retest of this level in the shape of a H4 bullish candlestick signal will likely entice buyers into the market, with eyeballs on 0.69 as the initial upside target, set just beneath daily resistance at 0.6910 and the 161.8% H4 Fibonacci ext. point mentioned above at 0.6912.
Should this trade eventually come to fruition, traders are also urged to take into account yesterday’s high at 0.6894 which could house active sellers.
USD/JPY:
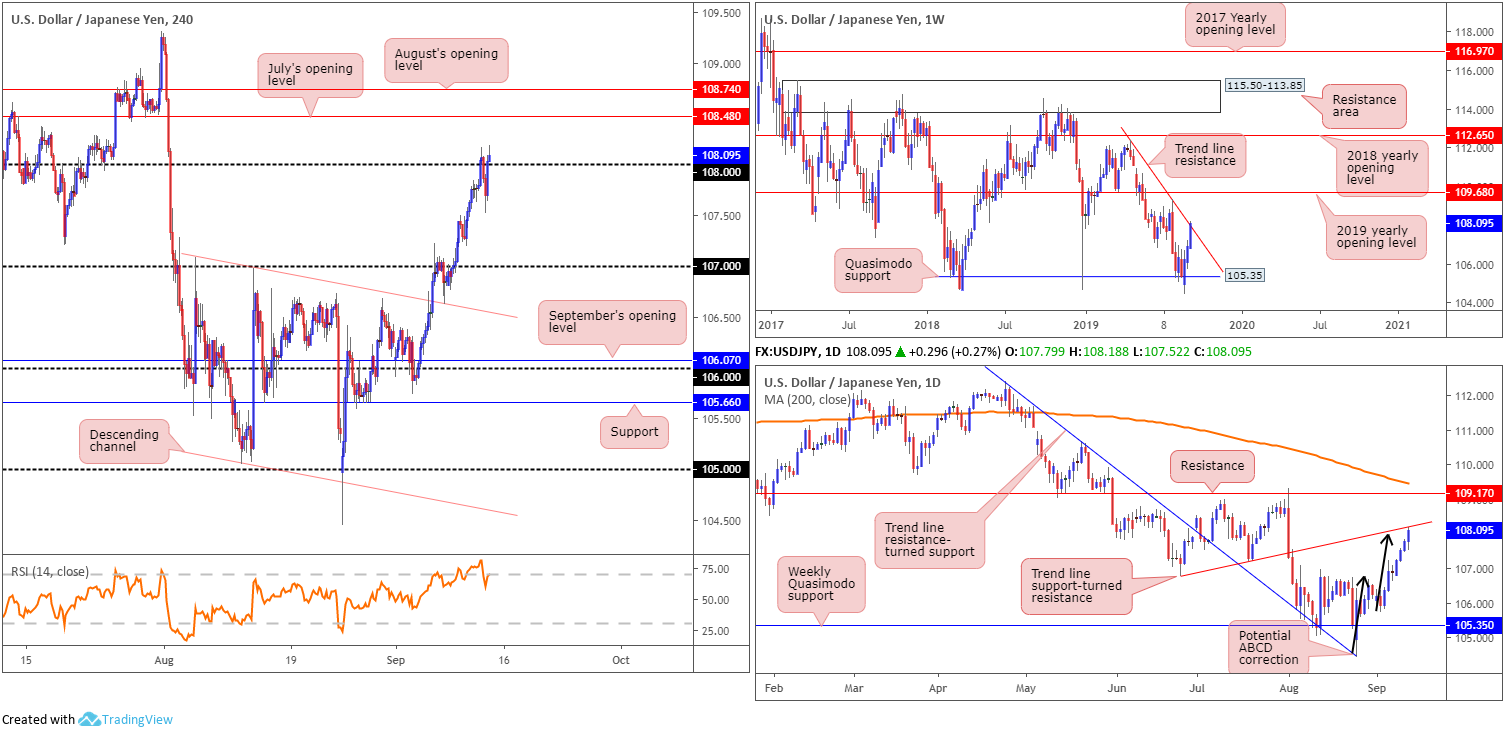
Thursday saw the USD/JPY shape its fourth successive winning day, clocking highs at 108.18, levels not seen since the start of August. Rising US Treasury yields along with renewed trade optimism diminished demand for the safe-haven Japanese yen.
Buy stops above the 108 handle on the H4 timeframe are well and truly under fire, as we write. Continued bidding above 108 places July’s opening level at 108.48 in the firing range as the next viable resistance, closely followed by August’s opening level at 108.74.
Meanwhile, the story on the higher timeframes has daily trade crossing swords with a trend line support-turned resistance (etched from the low 106.78) in the shape of a ABCD correction terminating at 108. In terms of where we stand on the weekly timeframe, Quasimodo support at 105.35 held form and has positioned the current weekly candle at the underside of trend line resistance (extended from the high 112.40).
Areas of consideration:
While the initial stop run above 108 drew the candles more than 50 points lower yesterday, the swift turnaround and repossession of 108 into the later stages of yesterday’s session is concerning for any seller. The only thing likely stopping a run to July’s opening level at 108.48 on the H4 timeframe is the trend line resistances on both the weekly and daily timeframes. Given higher-timeframe structure, should H4 price reclaim 108 to the downside once again and form a reasonably notable bearish candlestick formation, a short is still worthy of consideration, targeting 107 and possibly beyond, according to the higher timeframes.
USD/CAD:
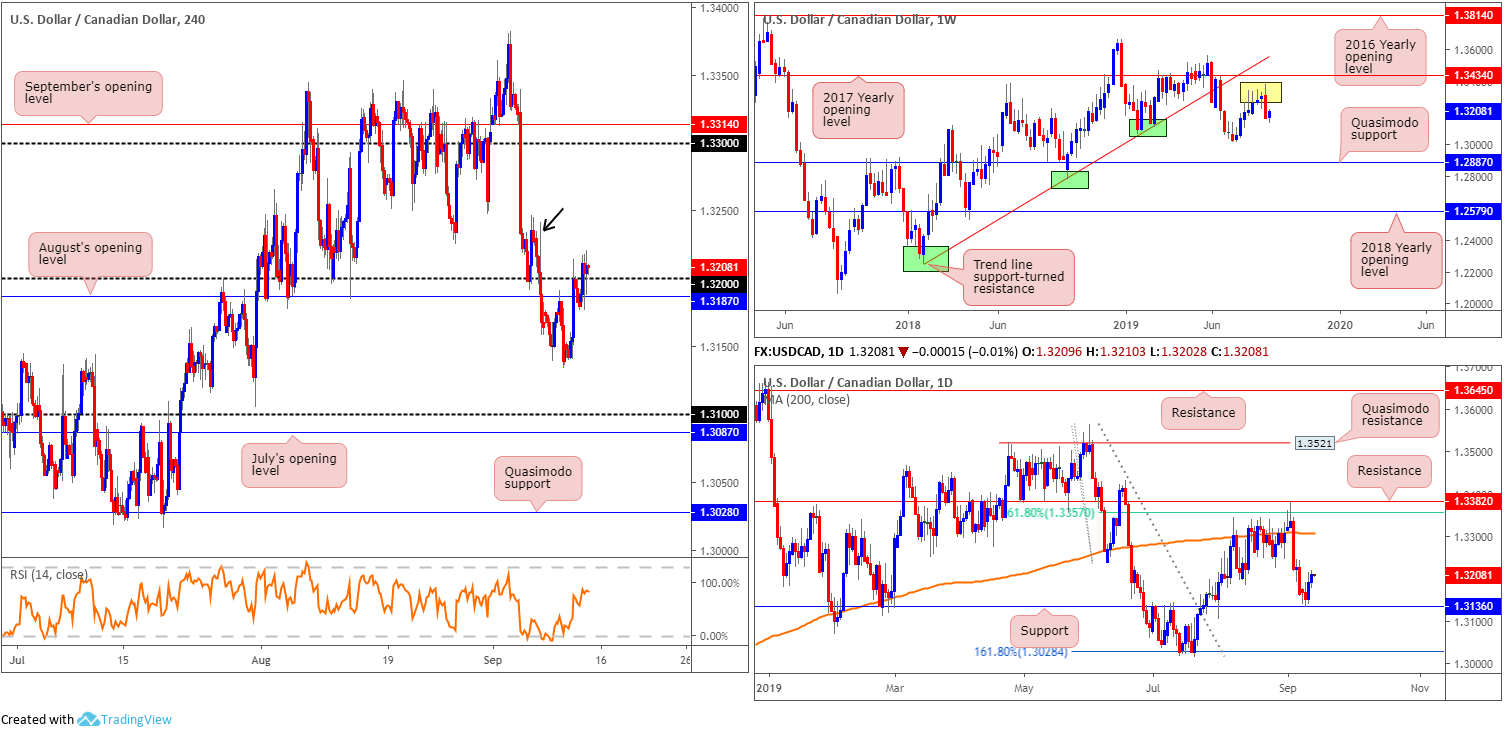
WTI prices ceded ground for a second consecutive session Thursday, with USD/CAD movement clinging to gains just north of 1.32 and August’s opening level at 1.3187. Supply above 1.32 is limited, according to our chart studies. Directly to the left, a large upper shadow marked with a black arrow at 1.3241 is visible and likely consumed most sellers around this region. Beyond here, reasonably thin air is evident until reaching the 1.33 neighbourhood.
In tandem with H4 direction, daily price displays room to gravitate as far north as its 200-day SMA (orange) at 1.3307, after printing a two-day bullish run off support at 1.3136. Weekly price, on the other hand, is attempting to correct last week’s precipitous decline, shaped in the form of a bearish outside week. Resistance on this timeframe can be seen at the 2017 yearly opening level drawn from 1.3434, whereas to the downside we have the 1.3016 July 15 low, followed by Quasimodo support at 1.2887.
Areas of consideration:
Even though back-to-back candles retested 1.32 as support and held, upside strength appears limited as each contains sizeable upper shadows. Should a notable bullish candlestick pattern develop off 1.32, however, a long is certainly worthy of consideration. With entry and risk to be determined according to the candlestick configuration, traders are urged to watch for a H4 close above 1.3250 to form. Clearing this figure likely unlocks the pathway towards 1.33, which as we know meanders close by the 200-day SMA and also September’s opening level at 1.3314.
USD/CHF:
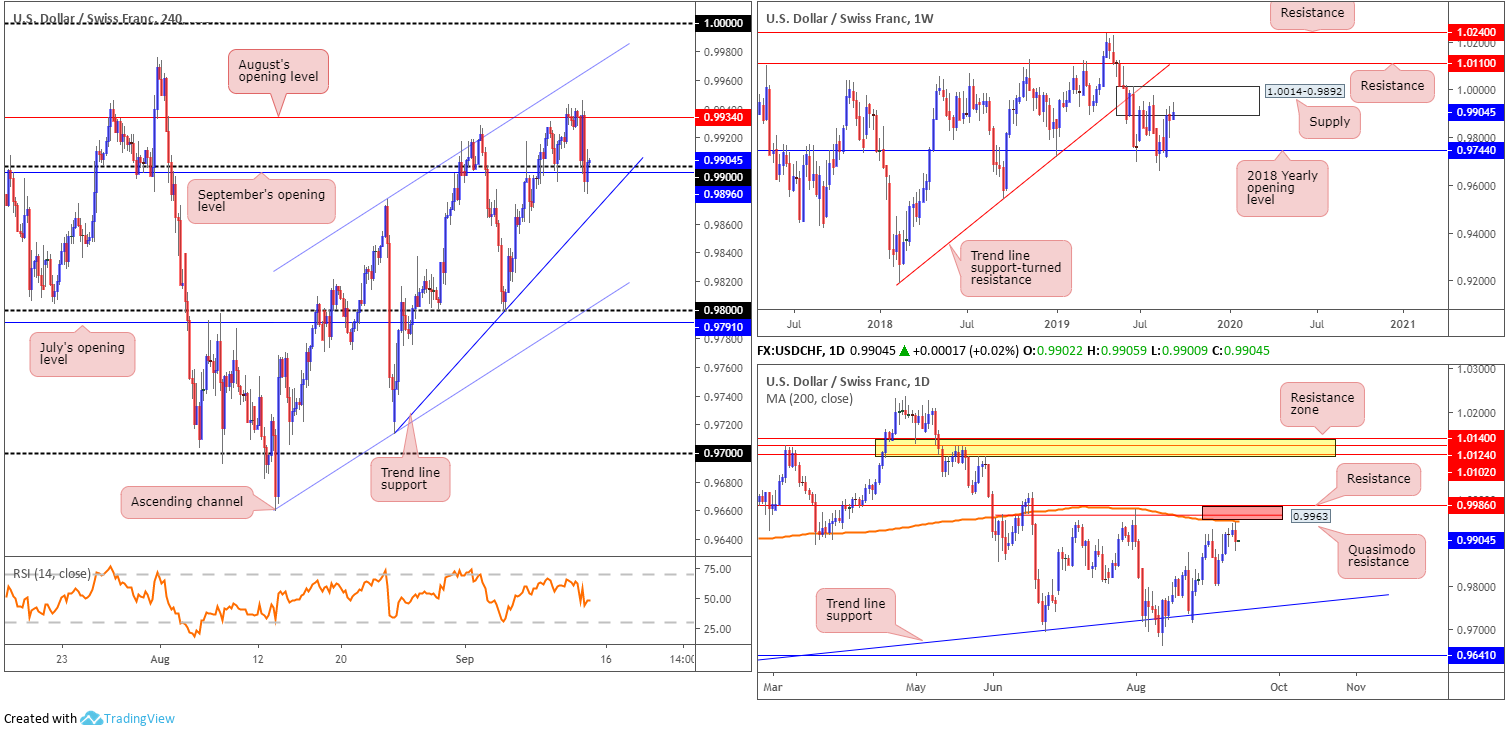
Early US hours Thursday witnessed the USD/CHF pair shift northbound as the EUR/USD (an inversely correlated market) came under heavy selling pressure in response to the European Central Bank rolling out an enormous stimulus package.
H4 action failed to sustain gains beyond August’s opening level at 0.9934 and retreated to a low of 0.9880, likely tripping sell stops around 0.99 and September’s opening level at 0.9896 along the way. Trend line support extended from the low 0.9713 offers a potential floor beyond the said supports, followed by an opening to channel support (taken from the low 0.9659) and the 0.98 handle.
On a wider perspective, daily activity produced a noticeable bearish outside day in recent trading, though left an interesting area of resistance at 0.9986/0.9953 unchallenged (Quasimodo resistance at 0.9963, a 200-day SMA [orange – 0.9953] and resistance coming in from 0.9986 [red]). Longer-term flow, nevertheless, has the current candle engaging with familiar supply coming in at 1.0014-0.9892. A rotation lower from here has the 2018 yearly opening level at 0.9744 in sight. In the event buyers brush aside the said supply (unlikely a straightforward feat), resistance at 1.0110 is in view, as is a long-term trend line support-turned resistance taken from the low 0.9187.
Areas of consideration:
As of current price, selling this market is difficult according to H4 structure. It would take a break of trend line support (0.9713) to clear sufficient space to channel support (0.9659).
Failing the above, the daily resistance area between 0.9986/0.9953 is still open for possible shorting opportunities. As emphasised in yesterday’s report, an ideal entry point would be the H4 channel resistance taken from the high 0.9877, as this line intersects with the upper boundary of the said daily zone. A test of the H4 channel area in the shape of a H4 bearish candlestick signal (entry and risk to be set according to this structure) is considered a high-probability setup with the likelihood of a sizeable move occurring from its formation.
Dow Jones Industrial Average:
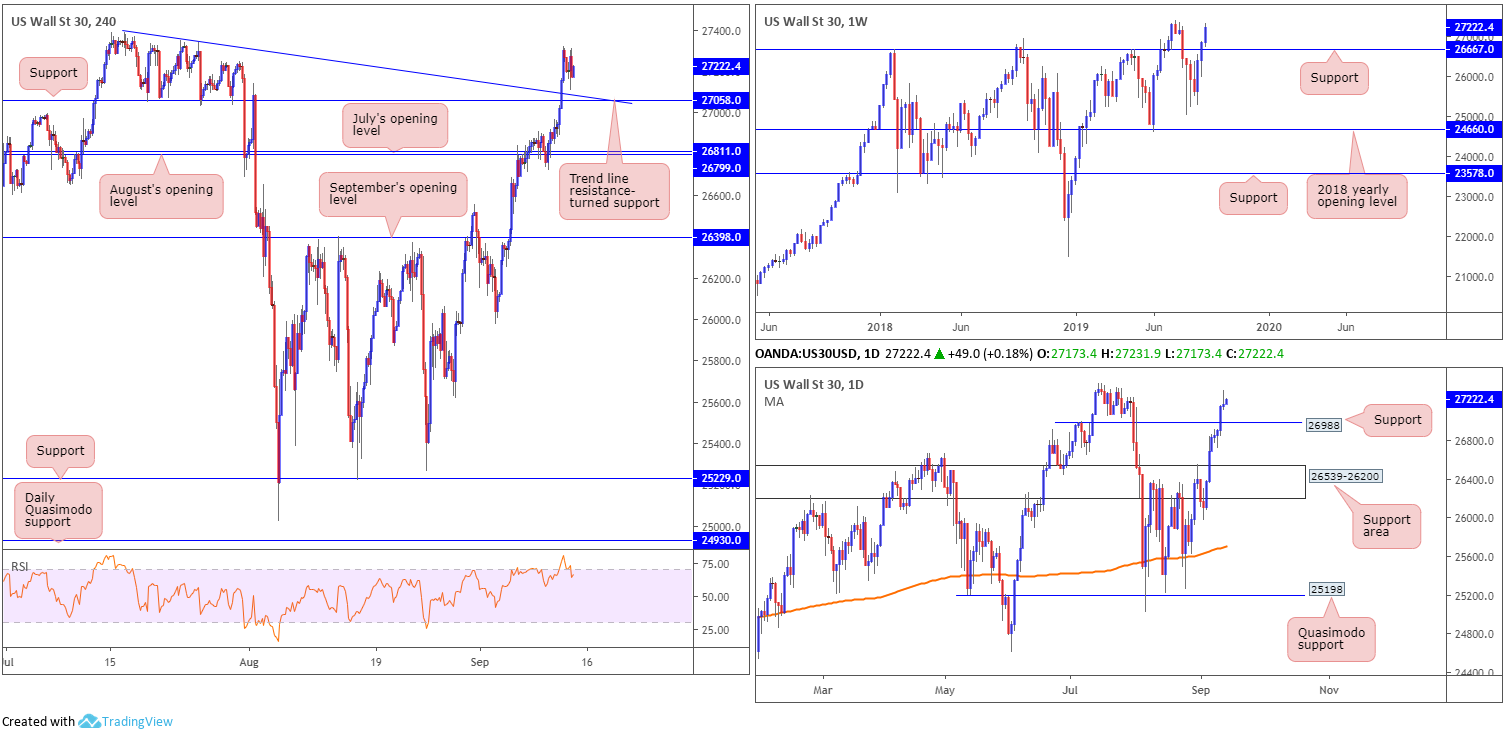
US equities firmed Thursday, buoyed on the back of positive developments on the US/China trade front and a promise of continued stimulus from the European Central Bank. The Dow Jones Industrial Average added 45.41 points, or 0.17%; the S&P 500 added 8.64 points, or 0.29% and the tech-heavy Nasdaq 100 advanced 29.76 points, or 0.38%.
With respect to the Dow’s technical landscape, price action is poised to approach all-time highs at 27388. As highlighted in Thursday’s report, daily price engulfed Quasimodo resistance at 26988 and is now serving as possible support. A retest of this barrier may come to fruition before we touch gloves with all-time highs.
A closer reading of price action on the H4 timeframe saw recent bidding overthrow resistance at 27058 (now acting support) and trend line resistance etched from the high 27388. To the upside, the research team notes limited resistance until reaching all-time highs.
Areas of consideration:
Outlook unchanged.
On account of the above chart studies, longs are in favour. Therefore, a retest at the area between 26988 (the daily support level) and H4 support at 27058 is eyed (and its intersecting trend line support). A retest formed by way of a H4 bullish candlestick signal will likely be sufficient to entice involvement even from the most conservative buyers. Entry and risk can be determined according to the candlestick’s structure, with a take-profit target set at the all-time high underscored above at 27388.
XAU/USD (GOLD):
For traders who read Thursday’s briefing you may recall the following:
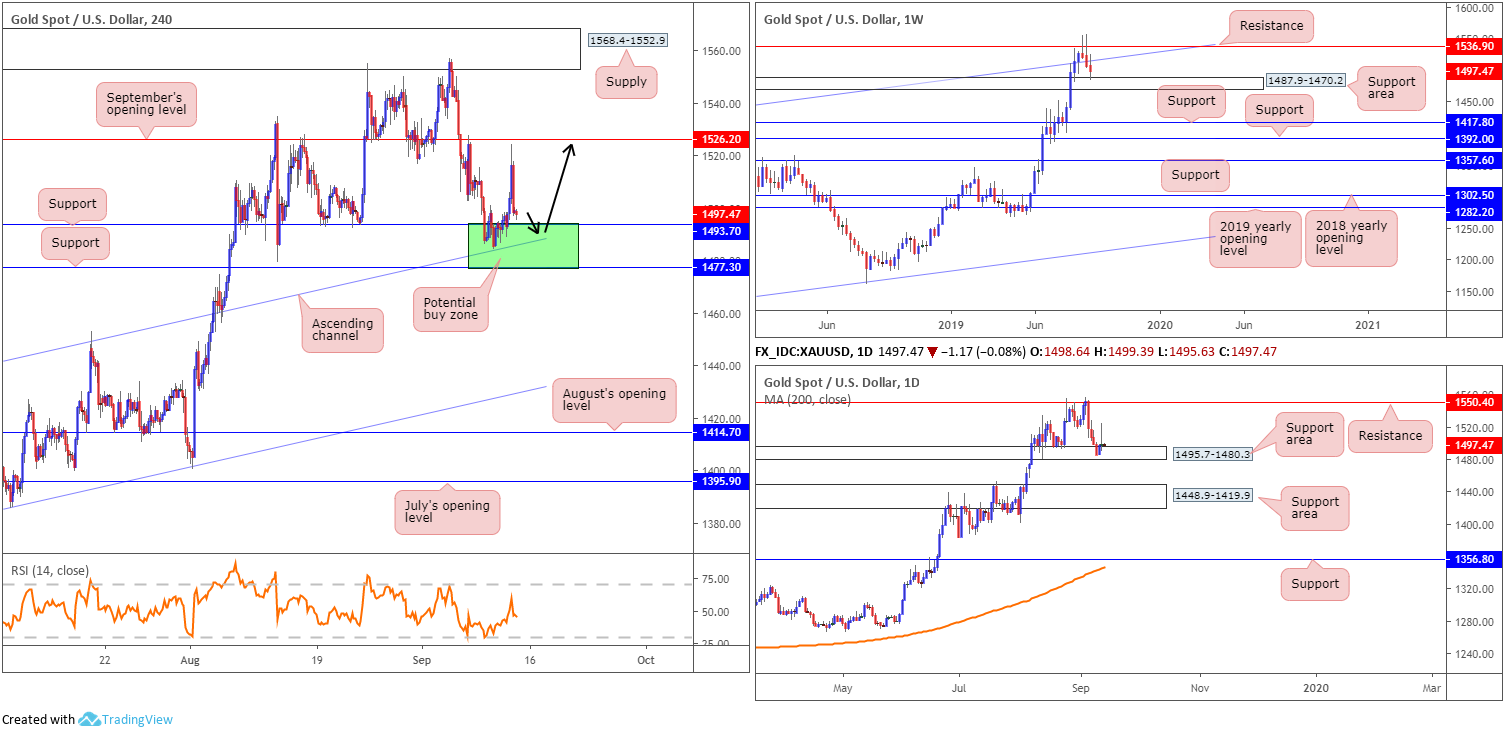
The green area on the H4 timeframe between 1477.3/1493.7 is considered a notable buy zone. Not only does it hold H4 channel support within, it merges with a daily support area coming in at 1495.7-1480.3, and the top edge of the weekly support area at 1487.9.
Entry can be found anywhere within the green buy zone, with protective stop-loss orders positioned beneath 1477.3. For conservative traders desiring a little more confirmation, though, waiting for a H4 bullish candlestick formation to develop could be the way to go. This helps confirm buyer intent and provides entry and risk levels to trade with.
There was a nice-looking H4 inside candlestick formation printed in the early hours of trade Wednesday, which so far is holding firm. Well done to any of our readers long from the said H4 buy zone. The initial upside target from here is set around September’s opening level at 1526.2.
Well done to any of our readers who managed to jump aboard this mover as price came within shouting distance of September’s opening level.
Areas of consideration:
Going forward, it appears the H4 candles are to test the green H4 support zone at 1477.3/1493.7 once more. This, considering its connection to higher-timeframe structure, could certainly hold price action higher for a second time. As such, entry at 1493.7 is likely on the radar for some traders, with protective stop-loss orders positioned beneath 1477.3. As highlighted above, for conservative traders desiring a little more confirmation, waiting for a H4 bullish candlestick formation to develop could be the way to go. This helps confirm buyer intent and provides entry and risk levels to trade with.
The accuracy, completeness and timeliness of the information contained on this site cannot be guaranteed. IC Markets does not warranty, guarantee or make any representations, or assume any liability regarding financial results based on the use of the information in the site.
News, views, opinions, recommendations and other information obtained from sources outside of www.icmarkets.com.au, used in this site are believed to be reliable, but we cannot guarantee their accuracy or completeness. All such information is subject to change at any time without notice. IC Markets assumes no responsibility for the content of any linked site.
The fact that such links may exist does not indicate approval or endorsement of any material contained on any linked site. IC Markets is not liable for any harm caused by the transmission, through accessing the services or information on this site, of a computer virus, or other computer code or programming device that might be used to access, delete, damage, disable, disrupt or otherwise impede in any manner, the operation of the site or of any user’s software, hardware, data or property.