Monday 11th November: Weekly technical outlook and review.

Key
risk events today:
China New Loans; UK Prelim GDP q/q; UK GDP m/m; UK Manufacturing Production m/m; French banks closed in observance of Armistice Day; US banks closed in observance of Veterans Day; Canadian banks closed in observance of Remembrance Day.
EUR/USD:
Weekly gain/loss: -1.31%
Weekly close: 1.1017
Weekly perspective:
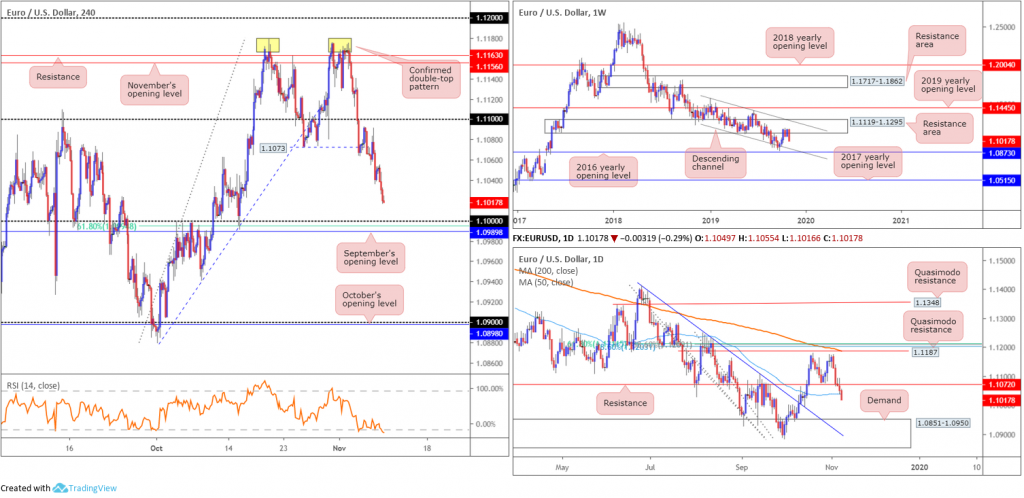
Following a short-lived phase of indecision, sellers marched south from the underside of a long-standing resistance area drawn from 1.1119-1.1295 last week, establishing a near-full-bodied bearish candle and recording its worst weekly decline since August. Increased selling this week has the lower boundary of a descending channel to target (extended from the low 1.1109), set a few points north of the 2016 yearly opening level at 1.0873.
Concerning trend direction, the primary downtrend has been in motion since topping in early 2018 at 1.2555.
Daily perspective:
Five successive days of selling, primarily opening by way of a clear-cut bearish engulfing candlestick formation, witnessed the EUR/USD tunnel through prominent support at 1.1072 (now a serving resistance) and the 50-day SMA (blue – 1.1038) last week. Note the 200-day SMA (orange – 1.1186) remains facing a southerly bearing, while the aforementioned 50-day SMA appears to be flattening.
With demand at 1.0851-1.0950 – houses the 2016 yearly opening level mentioned above on the weekly timeframe at 1.0873 – not yet entering the fold, this potentially invites further downside this week.
H4 perspective:
Europe’s single currency charged lower against the buck Friday, erasing more than 32 points, or 0.29%. The US dollar index continued to explore higher ground, reaching highs of 98.40 and registering its fifth consecutive daily gain.
As underscored in recent technical research, a distinct double-top pattern formed (peaks plotted at 1.1179/1.1175) after breaking the 1.1073 October 24 low (the confirmation point). Some technicians would label the peaks as an ‘eve and eve’ formation, considered to be a higher-probability pattern. The next downside target on this scale can be seen at the 1.10 handle, sited close by September’s opening level at 1.0989 and a 61.8% Fibonacci retracement ratio at 1.0994.
Areas of consideration:
Traders short the H4 double top pattern likely reduced risk to breakeven before the close. The initial take-profit target, as underscored above, is set around the key figure 1.10. Considering its local confluence (sited close by September’s opening level at 1.0989 and a 61.8% Fibonacci retracement ratio at 1.0994), active buying is expected. However, with higher-timeframe structure suggesting a move to as low as the top edge of daily demand plotted at 1.0950 this week, its unlikely the buying will be anything to get excited about.
GBP/USD:
Weekly gain/loss: -1.24%
Weekly close: 1.2772
Weekly perspective:
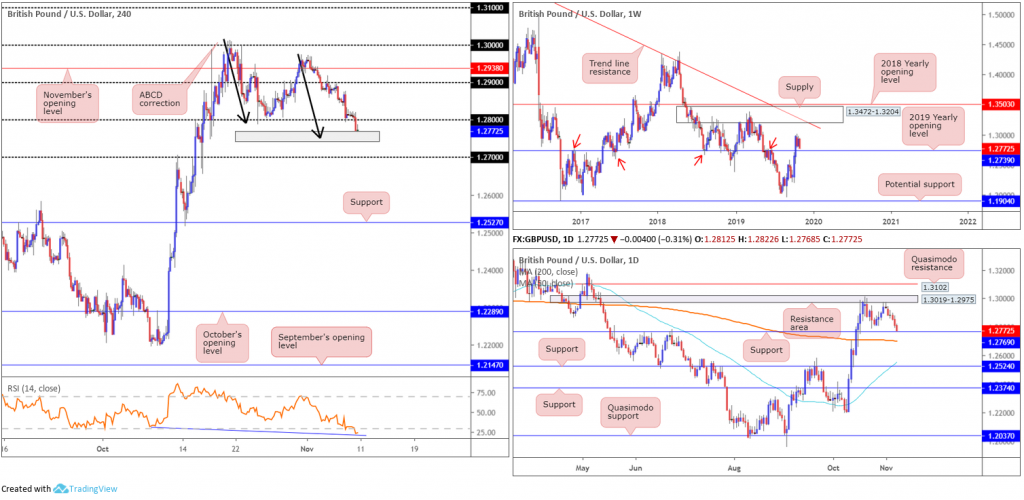
Shaped by way of a near-full-bodied bearish candle, GBP/USD movement concluded the week closing within striking distance of the 2019 yearly opening level at 1.2739. As evident from the chart (red arrows), the level boasts reasonably significant history, therefore the odds of a rejection forming from here is high. To the upside on this timeframe, traders likely note supply at 1.3472-1.3204 and long-term trend line resistance etched from the high 1.5930.
The immediate trend faces a downward trajectory from 1.4376, with a break of the 1.1904 low (labelled potential support) confirming the larger downtrend from 1.7191.
Daily perspective:
Upside attempts remain capped by a familiar resistance area coming in at 1.3019-1.2975. Failure to engulf this area placed notable support at 1.2769 in sight, which happened to enter the mix at the close of trade Friday. Closely shadowed by the 200-day SMA (orange – 1.2702 [flattening]), the combination of these two supports may be sufficient to attract buyers this week. Another layer of support is visible at 1.2524, which intersects closely with the 50-day SMA (blue – 1.2552 [rising]), in the event we navigate lower ground.
H4 perspective:
Following a brief period of consolidation a few points north of 1.28, likely gathering buy orders, GBP/USD action swung lower and shook hands with an interesting area of support marked in grey. Made up of weekly support at 1.2739 and daily support coming in at 1.2769, as well as a H4 ABCD correction pattern taken from the high 1.3012 (black arrows) and RSI confirmation (hidden bullish divergence within oversold territory – blue line), this area is likely of interest for potential longs today/early this week. What’s also interesting is a number of sell stops were tripped on the break of 1.28, both from traders attempting to fade the figure and those short the breakout, thus potentially providing liquidity to buy.
Areas of consideration:
The highlighted 1.2739/1.2769 area is possibly of interest today as support, and forms as a final take-profit target for shorts from the underside of 1.29 based on Tuesday’s H4 shooting star candlestick pattern (noted in previous reports).
A bounce from 1.2739/1.2769 followed up with a break back above 1.28 on a H4 closing basis could entice buyers into the market. A conservative entry on the close of the breakout candle is then an option, with protective stop-loss orders either plotted beneath 1.2739 or the lower shadow of the breakout candle.
AUD/USD:
Weekly gain/loss: -0.82%
Weekly close: 0.6856
Weekly perspective:
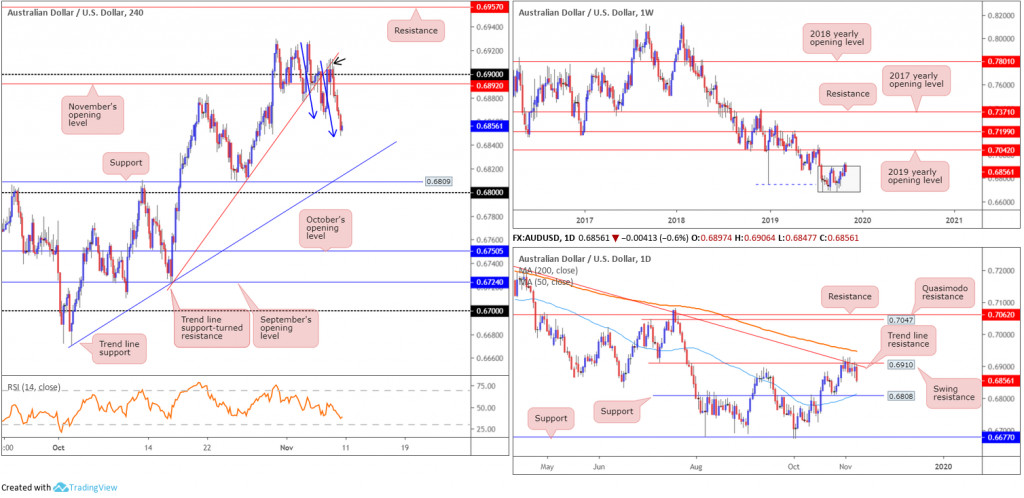
Recent activity on the weekly timeframe witnessed the AUD/USD deliver a two-candle fakeout to the top edge of a 3-month long consolidation zone between 0.6894/0.6677 (light grey). Although likely to encourage further selling over the coming weeks, resistance outside of the said range holds at the 2019 yearly opening level drawn from 0.7042, in the event we push higher.
With a primary downtrend in play since early 2018, breaking higher is likely to be a challenge.
Daily perspective:
In conjunction with weekly analysis, daily swing resistance seen at 0.6910 – coupled with trend line resistance taken from the high 0.7393 – held price action lower last week. Further downside from this point will likely draw in support at 0.6808, aligning closely with the 50-day SMA (blue – 0.6812 ). Note the 200-day SMA (orange – 0.6946) remains pointing south.
H4 perspective:
Friday kicked off defensively after the Reserve Bank of Australia (RBA) reiterated the board is prepared to ease policy further if needed. This, alongside a robust US dollar and US President Trump stating he has not yet agreed to roll back tariffs on China, added to the downbeat tone throughout the day.
Traders who read Friday morning’s technical briefing may recall the following piece (slightly adapted):
With buyers and sellers squaring off around the 0.69 region and trend line support-turned resistance (0.6723) this morning, as well as resistance observed on the higher timeframes, technical studies suggest sellers have the upper hand. Should a notable H4 bearish candlestick signal form from 0.69 today, this may encourage a run lower, targeting yesterday’s session low at 0.6861, followed by H4 support coming in at 0.6809/trend line support etched from the low 0.6670.
Denoted by a black arrow, Friday sported an inside candlestick formation prior to the descent and engulfed 0.6861, potentially clearing the path to the H4 trend line support/H4 support combination highlighted above.
Areas of consideration:
From a technical standpoint, additional downside is a possibility this week at least until reaching H4 support at 0.6809 (essentially marking the same base as daily support at 0.6808). Despite this, though, a minor pullback is expected due to the completion of a H4 ABCD correction taken from the high 0.6928 (blue arrows), though is unlikely to breach 0.69.
Those short Friday’s H4 inside candle formation likely reduced risk to breakeven before the close, with eyes on lower levels this week. Traders who missed the move may, assuming a correction based on the H4 ABCD pattern, get a second opportunity to enter short, preferably around the 0.69 region.
USD/JPY:
Weekly gain/loss: +0.97%
Weekly close: 109.21
Weekly perspective:
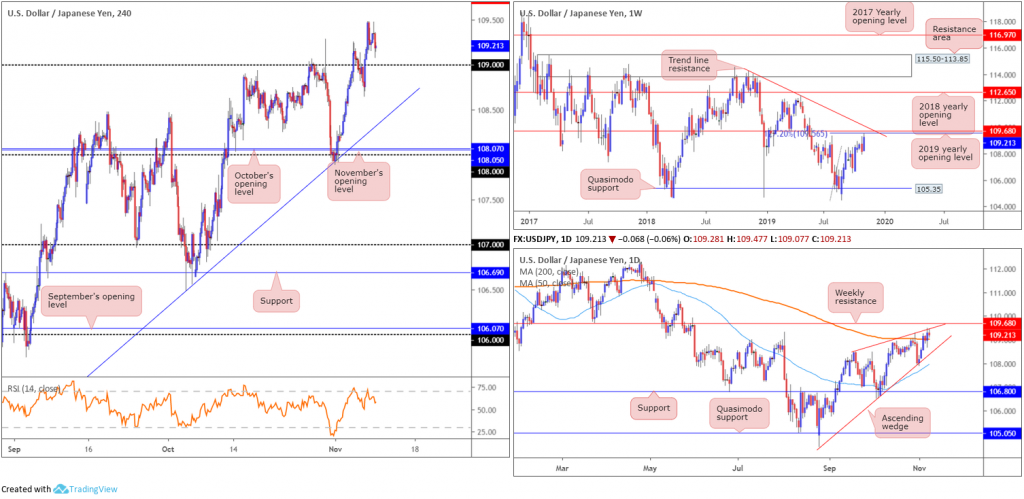
USD/JPY bulls entered an offensive phase last week, adding more than 100 points, or 0.97%. While this is likely to enliven momentum-based traders, resistance nears in the form of the 2019 yearly opening level at 109.68 and a 127.2% Fibonacci ext. point at 109.56 (taken from the low 104.44). Also sited close by is trend line resistance extended from the high 114.23.
Daily perspective:
Activity on the daily timeframe holds north of the 200-day SMA (orange – 109.02), which, by and of itself, is considered a bullish indicator. Having noted weekly resistance plotted nearby at 109.68, as well as a daily ascending wedge formation unfolding since early September (104.44/108.47 – red lines), the likelihood of a continuation north, long term that is, is unlikely.
H4 perspective:
Friday saw US President Trump flood the wires, stating he has not yet agreed to roll back tariffs on China. This sparked fresh doubts and marginally weighed on USD/JPY movement.
Technically, trade remains buoyant north of 109 at the moment, though lack of interest beyond 109.50, alongside the relative strength index (RSI) recently exiting overbought territory, may prompt a retest at 109 this week. The next upside hurdle on the H4 timeframe falls in around Quasimodo resistance at 109.74 (not visible on the screen), which coincides closely with weekly resistance mentioned above at 109.68.
Areas of consideration:
While traders will have eyes on 109 as a point of potential support today, in hopes of joining the immediate trend, the fact we came within 8 points of connecting with weekly structure is concerning. Therefore, a cautious stance in regards to longs is recommended this week.
In the event we continue to punch higher from current price and cross swords with H4 Quasimodo resistance at 109.74, selling this market countertrend is an option. Knowing the Quasimodo resistance boasts additional backing from weekly structure is certainly appealing. Given this is a countertrend trade, though, traders may find comfort in waiting for additional H4 bearish candlestick confirmation to form before pulling the trigger. A bearish candlestick signal will not guarantee a winning trade, but it will identify seller intent and provide entry and risk levels to work with.
USD/CAD:
Weekly gain/loss: +0.66%
Weekly close: 1.3225
Weekly perspective:
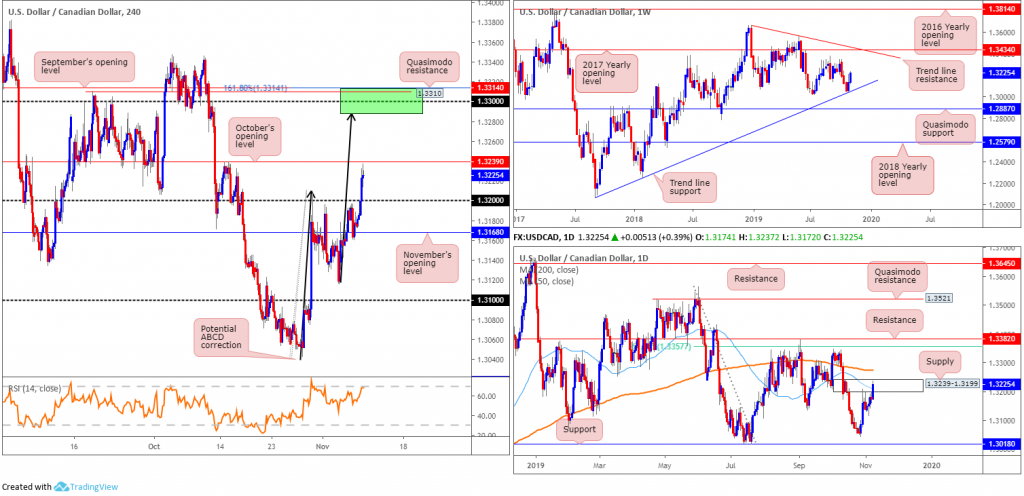
Price action on the weekly scale continues to exhibit a bullish presence as buyers extend the recovery off trend line support (taken from the low 1.2061) in reasonably strong fashion. Additional upside from this point has tops around 1.3342 in sight, closely followed by the 2017 yearly opening level at 1.3434 and trend line resistance taken from the peak at 1.3661.
Overall, the immediate trend faces north since bottoming in September 2017, though this move could also be considered a deep pullback in a larger downtrend from the 1.4689 peak in early January 2016.
Daily perspective:
A closer reading of price action on the daily timeframe reveals supply at 1.3239-1.3199 came under pressure in the later stages of last week. Further to this, closing above the 50-day SMA (blue – 1.3209) suggests a possible approach towards the 200-day SMA (orange – 1.3274) may come about this week.
H4 perspective:
The combination of dollar strength weighing on the majority of its G10 peers Friday, and less-than-stellar Canadian job’s data, sent the USD/CAD sharply higher. Canadian employment data for October disappointed with the number of jobs in the economy falling by -1.8k, against expectations for a 14.7k rise. Unemployment printed in line with expectations at 5.5%, as did the participation rate at 65.7%.
Finishing 0.39% in the green, H4 price convincingly dethroned 1.32 to the upside and wrapped up within touching distance of October’s opening level at 1.3239. Note this monthly opening level also denotes the top edge of the current daily supply. Beyond 1.3239, limited resistance is visible until reaching 1.33. Supporting 1.33 as a resistance area, we have a potential ABCD correction (black arrows) terminating at 1.3287, a 161.8% Fibonacci ext. point at 1.3314, Quasimodo resistance at 1.3310 and September’s opening level at 1.3314 (green). In addition, the 200-day SMA is seen lurking just south of this zone.
Areas of consideration:
1.3314/1.3287
on the H4 timeframe is certainly an area of resistance to keep an eye on this
week for potential shorts.
More immediate, however, we could witness a retest at 1.32 form as support today/early this week. A long based off this level has the backing of weekly price rallying from its trend line support, and daily price recently crossing above its 50-day SMA. In order to help avoid a whipsaw to November’s opening level at 1.3168, though, traders may opt to wait and see if a H4 bullish candlestick signal forms before pulling the trigger, targeting 1.3239 as the initial upside target.
USD/CHF:
Weekly gain/loss: +1.18%
Weekly close: 0.9970
Weekly perspective:
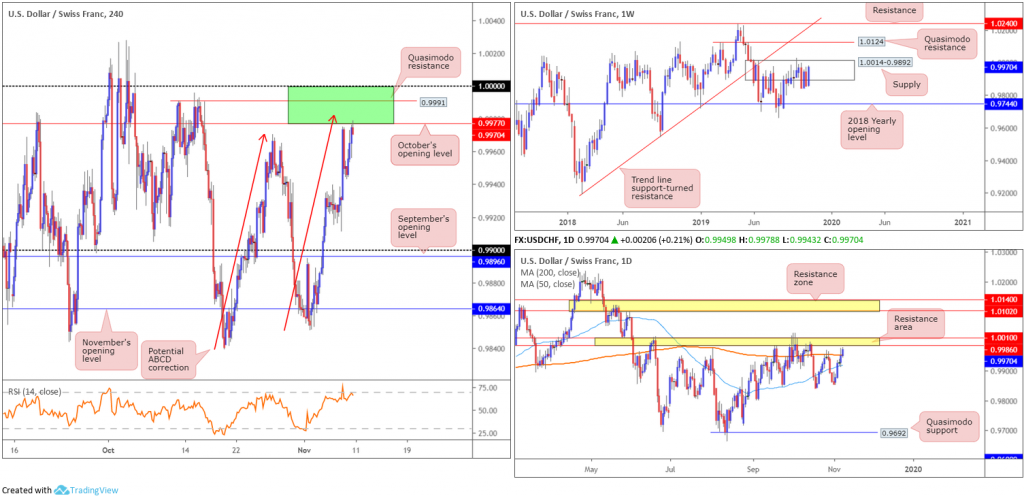
Supply at 1.0014-0.9892 remains in play, despite recent buying. The beginning of October witnessed a penetration to the outer edge of the supply area’s limit, possibly tripping a portion of buy stops and weakening sellers. An upside move out of the said supply may draw in Quasimodo resistance at 1.0124, while downside has the 2018 yearly opening level at 0.9744 in sight.
According to the primary trend, price also reflects a slightly bullish tone; however, do remain aware we have been rangebound since the later part of 2015 (0.9444/1.0240).
Daily perspective:
Technical research on the daily timeframe reveals price overthrew the 200-day SMA function Friday (orange – 0.9953). While market participants view this as a bullish indicator, a familiar resistance area coming in at 1.0010/0.9986 may hamper upside attempts this week.
Should further buying persist, however, a move to another layer of resistance drawn from 1.0140/1.0102 may develop. Traders may wish to acknowledge this area also converges with the Quasimodo resistance noted on the weekly timeframe at 1.0124.
H4 perspective:
Broad-based USD strength Friday lifted the H4 candles to October’s opening level at 0.9977, where a modest reaction was observed into the close. Accompanied closely by a Quasimodo resistance level at 0.9991, a H4 ABCD correction (red arrows) at 0.9982 and the 1.0000 figure (parity), we have ourselves a reasonably tight area of resistance to work with today/early this week.
Areas of consideration:
The green area on the H4 scale between 1.0000/0.9977 is likely of interest for shorts. Not only is it positioned within the walls of the current weekly supply, the H4 zone is also glued to the underside of the noted daily resistance area and comes complete with an H4 ABCD correction. A sell from here has the 200-day SMA set as the initial target.
Dow Jones Industrial Average:
Weekly gain/loss: +1.38%
Weekly close: 27647
Weekly perspective:
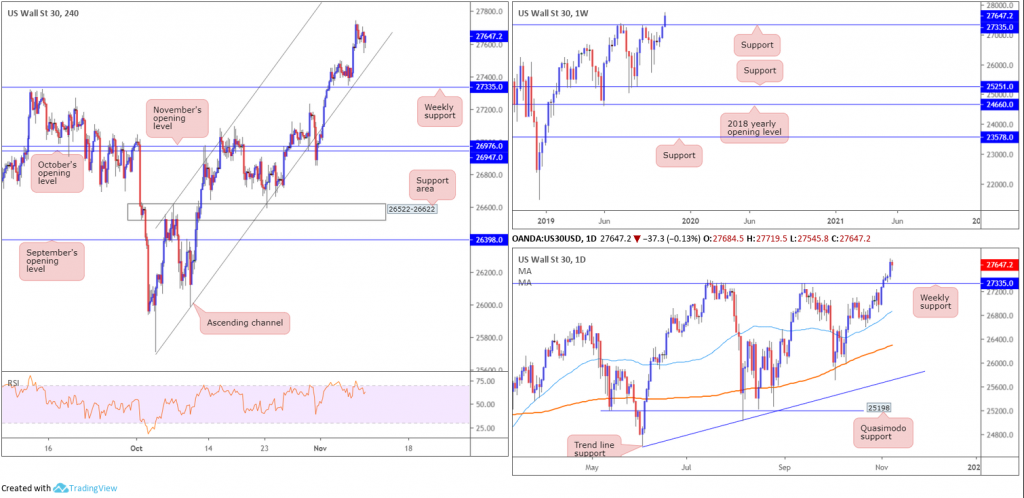
Longer-term flows on the weekly timeframe pressured through resistance at 27335 last week, reaching fresh all-time highs of 27742. With price closing in reasonably strong fashion, a pullback to 27335 could be in store this week for potential long opportunities.
Daily perspective:
Technically speaking, there’s little difference between the weekly and daily timeframes this week. Weekly support is also set as a central floor on this scale at 27335.
H4 perspective:
Despite US President Trump sparking fresh doubts about when the world’s two largest economies will end a 16-month trade war, US stocks inched higher Friday. The Dow Jones industrial average added 6.44 points, or 0.02%; the S&P 500 added 7.90 points, or 0.26% and the tech-heavy Nasdaq 100 advanced 36.24 points, or 0.44%.
From A technical standpoint, the Dow’s H4 candles remain within the walls of an ascending channel formation taken from a low of 25710 and a high at 26620. A retest of the channel’s support is certainly an option this week, with a break of this barrier portending an approach towards weekly support underscored above at 27335.
Areas of consideration:
In similar fashion to Friday’s technical outlook, the market still likely has eyes on H4 channel support highlighted above. A retest of this line – coupled with a H4 bullish candlestick configuration – is likely sufficient to prompt another run higher. Entry and risk can be calculated according to the H4 candlestick’s parameters, targeting the previous day’s high as the initial take-profit target.
XAU/USD (GOLD):
Weekly gain/loss: -3.65%
Weekly
close: 1458.8
Weekly
perspective:
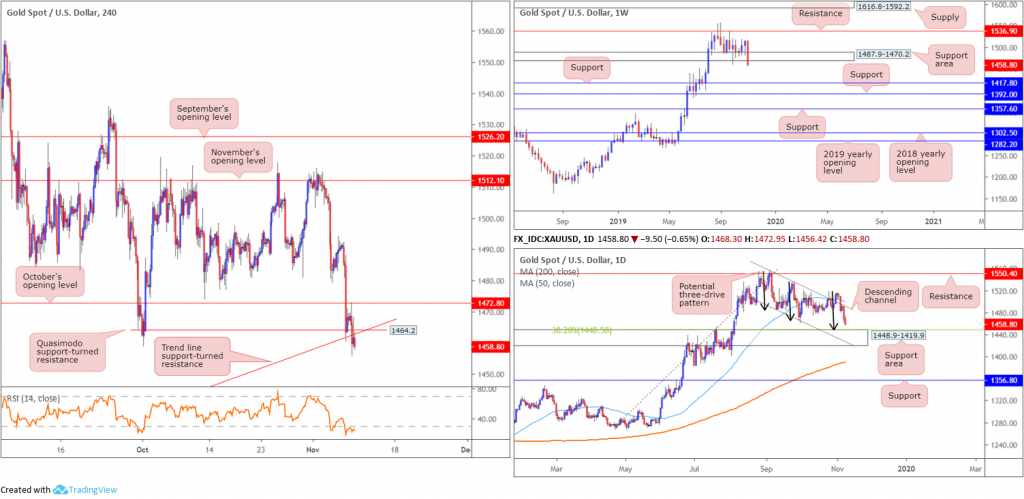
Gold suffered hefty losses against the dollar in recent trading, feeling its largest decline since November 2016. Erasing more than $55, or 3.65%, and closing in the form of a full-bodied bearish candle, weekly price drove through the lower edge of a support area coming in at 1487.9-1470.2, potentially setting the long-term stage for a move towards two layers of support at 1392.0 and 1417.8.
Daily perspective:
In terms of daily positioning, the candles remain confined within a descending channel formation (taken from the high 1557.1 and a low of 1484.6). Technically, the yellow metal is seen poised to cross swords with a support area pencilled in at 1448.9-1419.9 (aligns closely with a 38.2% Fibonacci retracement ratio at 1448.5). What’s also interesting here is the completion of a potential three-drive pattern around the top edge of the said support zone (black arrows).
H4 perspective:
With the dollar index closing strongly higher Friday, it was no surprise to see a decline in gold. Retesting the underside of October’s opening level at 1472.8 and following through with a close beneath Quasimodo support at 1464.2 and a trend line support etched from the low 1381.9, the week ended with H4 price retesting the said broken levels as resistance and closing lower. The next port of call in terms of support from here falls in around the 1433.5 neighbourhood (not visible on the screen), sited within the upper boundary of the daily support area mentioned above at 1448.9-1419.9.
Areas of consideration:
Having watched weekly price dethrone a significant support area and daily price exhibit space to press lower to a daily support area at 1448.9-1419.9, selling the H4 rejection candle off the underside of the H4 Quasimodo support-turned resistance at 1464.2 and H4 trend line support-turned resistance could be an option.
With a protective stop-loss order plotted above 1468.2 and an entry at current price, there’s ample room to reduce risk to breakeven before connecting with the first downside target: the top edge of the daily support area at 1448.9.
The
accuracy, completeness and timeliness of the information contained on this site
cannot be guaranteed. IC Markets does not warranty, guarantee or make any
representations, or assume any liability regarding financial results based on
the use of the information in the site.
News,
views, opinions, recommendations and other information obtained from sources
outside of www.icmarkets.com.au, used in this site are believed to be reliable,
but we cannot guarantee their accuracy or completeness. All such information is
subject to change at any time without notice. IC Markets assumes no
responsibility for the content of any linked site.
The
fact that such links may exist does not indicate approval or endorsement of any
material contained on any linked site. IC Markets is not liable for any harm
caused by the transmission, through accessing the services or information on
this site, of a computer virus, or other computer code or programming device
that might be used to access, delete, damage, disable, disrupt or otherwise
impede in any manner, the operation of the site or of any user’s software,
hardware, data or property.