Friday 28th February: Technical Outlook and Review.

Key risk events today:
German Prelim CPI m/m; Canada GDP m/m and RMPI m/m; US Core PCE Price Index m/m and Personal Spending m/m; Chicago PMI.
(Previous analysis as well as outside sources – italics).
EUR/USD:
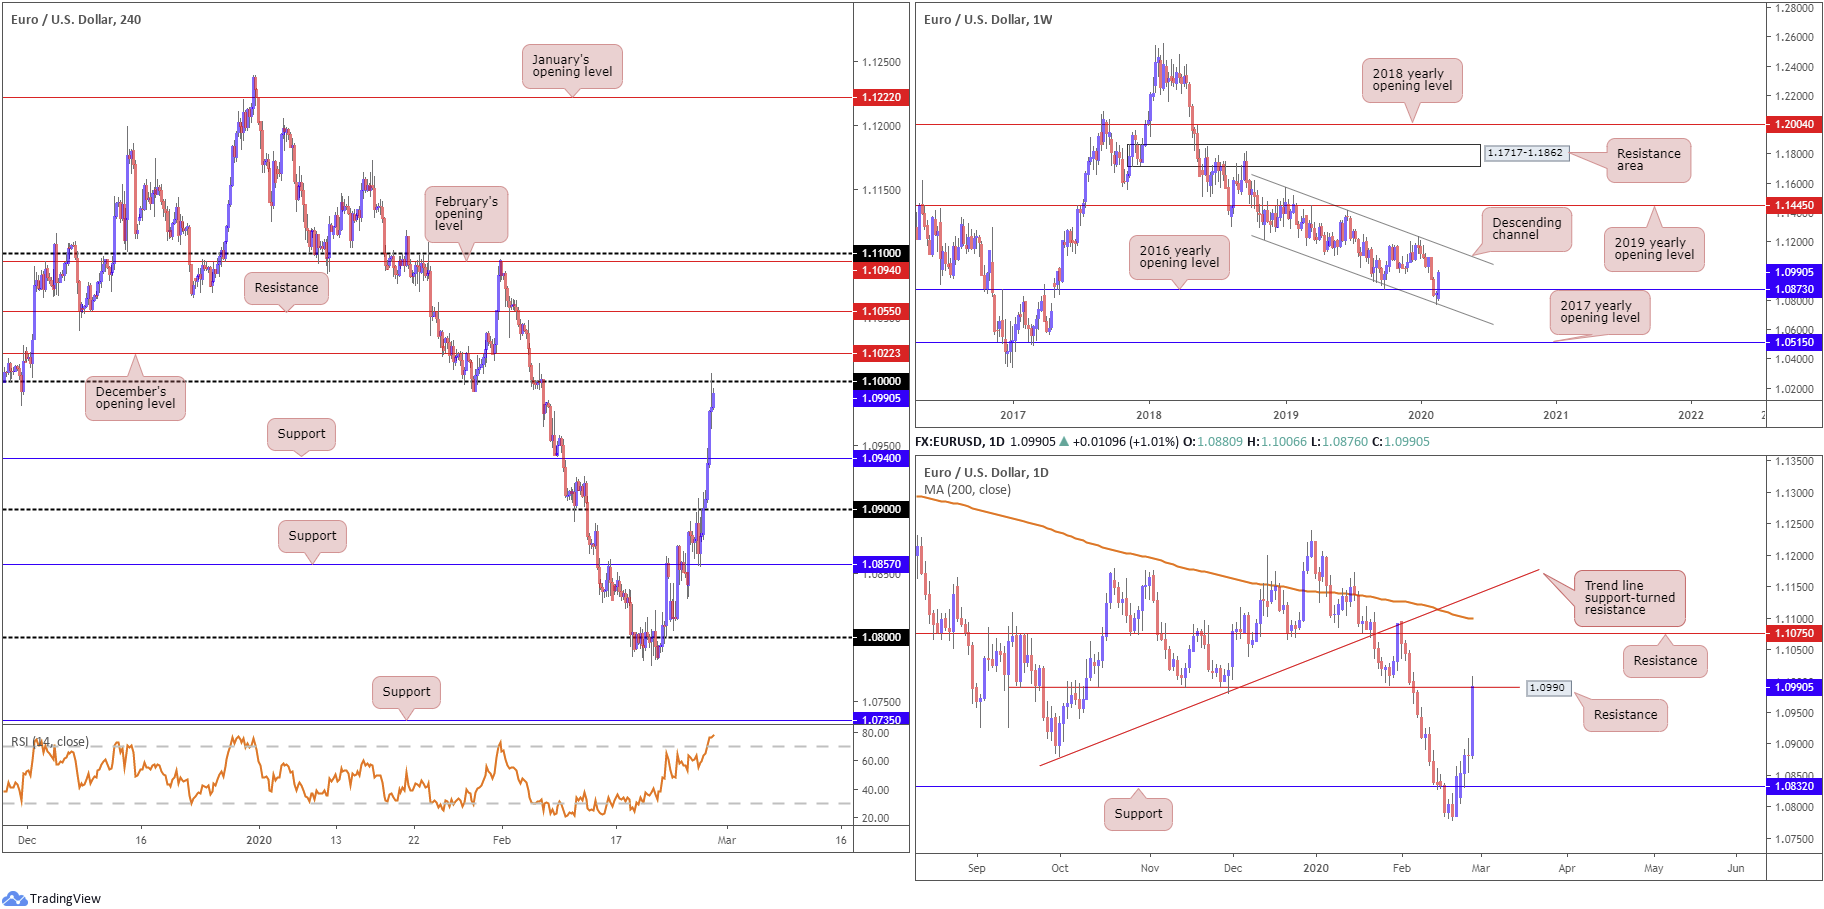
Increased selling in US Treasury yields weighed on the US dollar index Thursday, with the 10-year benchmark shaking hands with all-time lows at 1.23%. Optimistic data out of the US – durable goods and pending home sales – failed to offer much respite, with the DXY testing lows at 98.36 and marginally fading daily support priced in at 98.45.
EUR/USD jumped through 1.09 and H4 resistance at 1.0940 to test the key figure 1.10, adding more than 100 points yesterday. Circulating north of 1.10 we have December’s opening level at 1.1022, with a break highlighting H4 resistance plotted at 1.1055. Note also the relative strength index (RSI) tests overbought terrain, a touch beneath 80.00.
On more of a broader perspective, daily price is shaking hands with resistance coming in at 1.0990. A break of this base could lead to an approach towards resistance at 1.1075, positioned close by the 200-day SMA (orange – 1.1099). The weekly timeframe, however, diverts focus to the recent break of resistance at 1.0873, the 2016 yearly opening level, after bottoming off channel support, taken from the low 1.1109. This could eventually see an approach to channel resistance, extended from the high 1.1569.
Areas of consideration:
Well done to any readers who remain long north of 1.08; this was a noted setup to watch for last week. Price has since moved 200 points – absolutely mouth-watering risk/reward.
Going forward, despite weekly flow suggesting increased upside, the combination of daily resistance at 1.0990 and the key figure 1.10 on the H4 timeframe, along with the RSI testing overbought territory, could hamper buying today. Therefore, short sales off 1.10, with protective stop-loss orders tucked above 1.1023, are an option today, targeting H4 support at 1.0940.
GBP/USD:
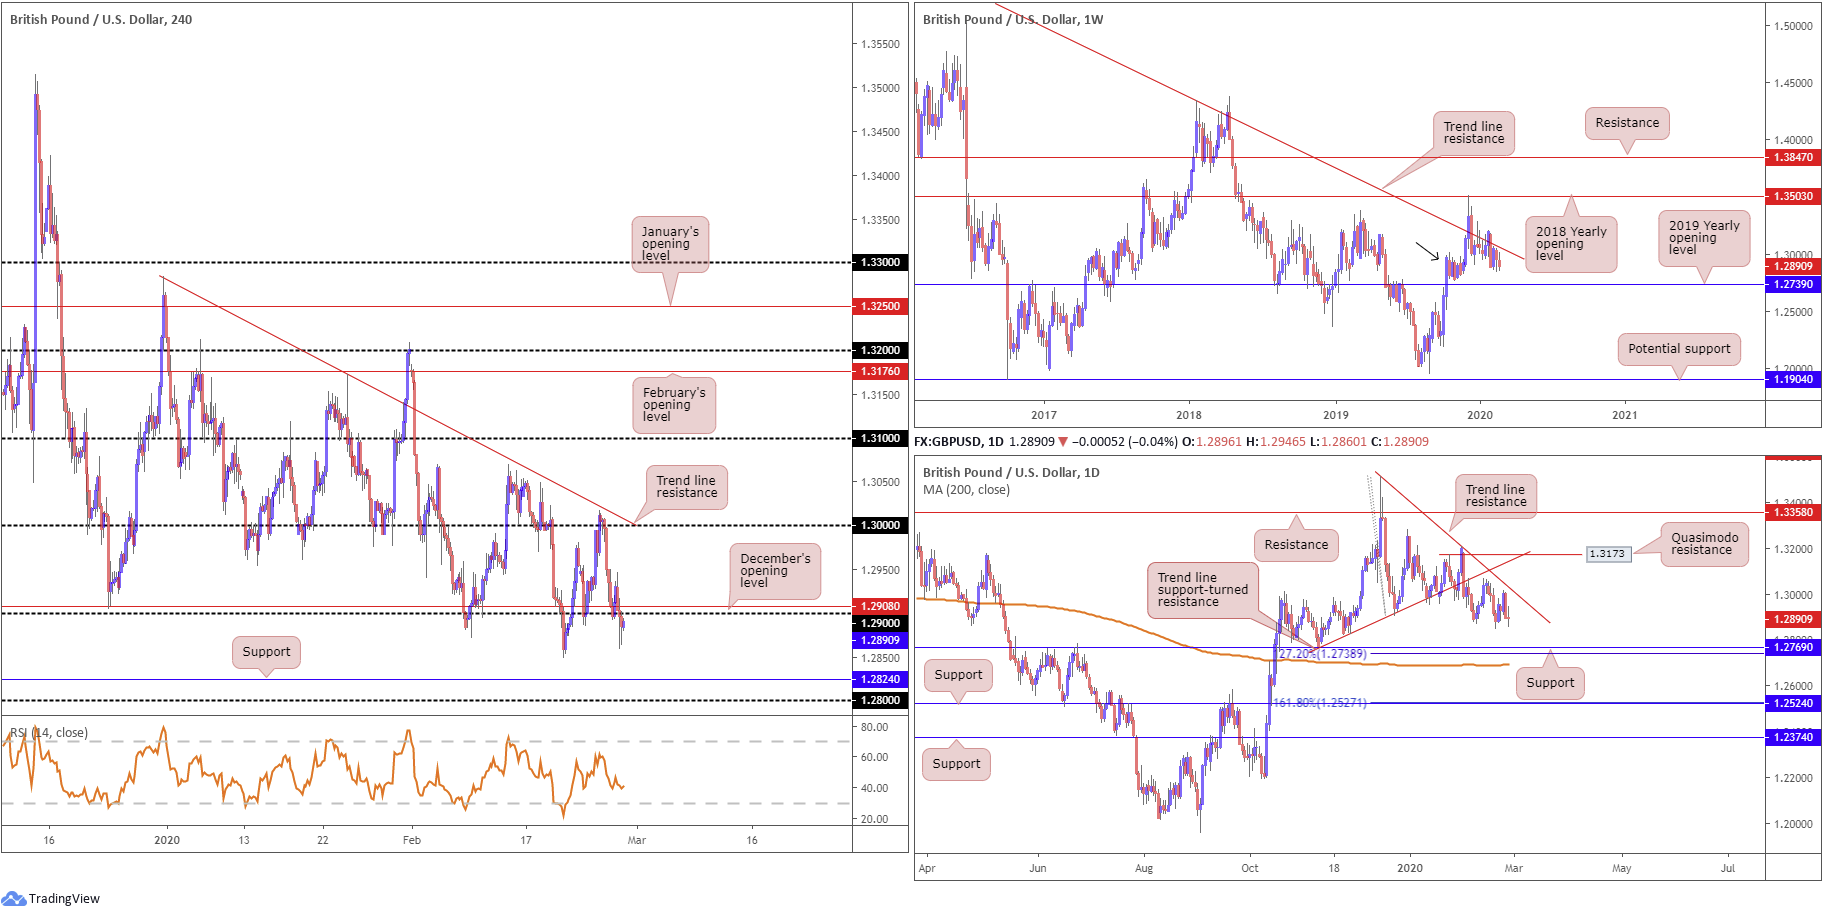
In recent sessions, the H4 candles dipped a toe in waters south of the 1.29 handle, testing weekly lows around the 1.2860 region. The US dollar index observed further loss, extending its recent pullback from multi-year tops amid a slump in US Treasury yields to fresh all-time lows at 1.23%, likely helping limit loss beneath 1.29.
Technically, the close beneath 1.29 is possibly viewed as a bearish pointer, with some anticipating a retest at the underside of the round number today. Aside from the 1.2849 February 20th low, the next support target on the H4 scale can be seen at 1.2824.
Further out, weekly price is seen languishing beneath long-standing trend line resistance, pencilled in from the high 1.5930, though demand around the 1.2939 region is also still in motion (black arrow). Continued downside may imply a break of the said demand, tripping sell stops and testing the 2019 yearly opening level at 1.2739. A break higher, on the other hand, could see the 2018 yearly opening level enter the fight at 1.3503.
From the daily timeframe, we can see price recently turned lower a touch below trend line resistance, taken from the high 1.3514. Further downside from here has support fixed at 1.2769, a 127.2% Fibonacci extension at 1.2738 and the 200-day SMA. Note the said SMA has been flattening since mid-October 2019.
Areas of consideration:
Given the overall bearish vibe in this market right now, a retest at 1.29 may hold and unlock the door for bearish scenarios to H4 support at 1.2824, closely shadowed by the 1.28 region. As round numbers are prone to whipsaws, sellers may find waiting for additional confirmation to form a safer alternative before pulling the trigger.
AUD/USD:
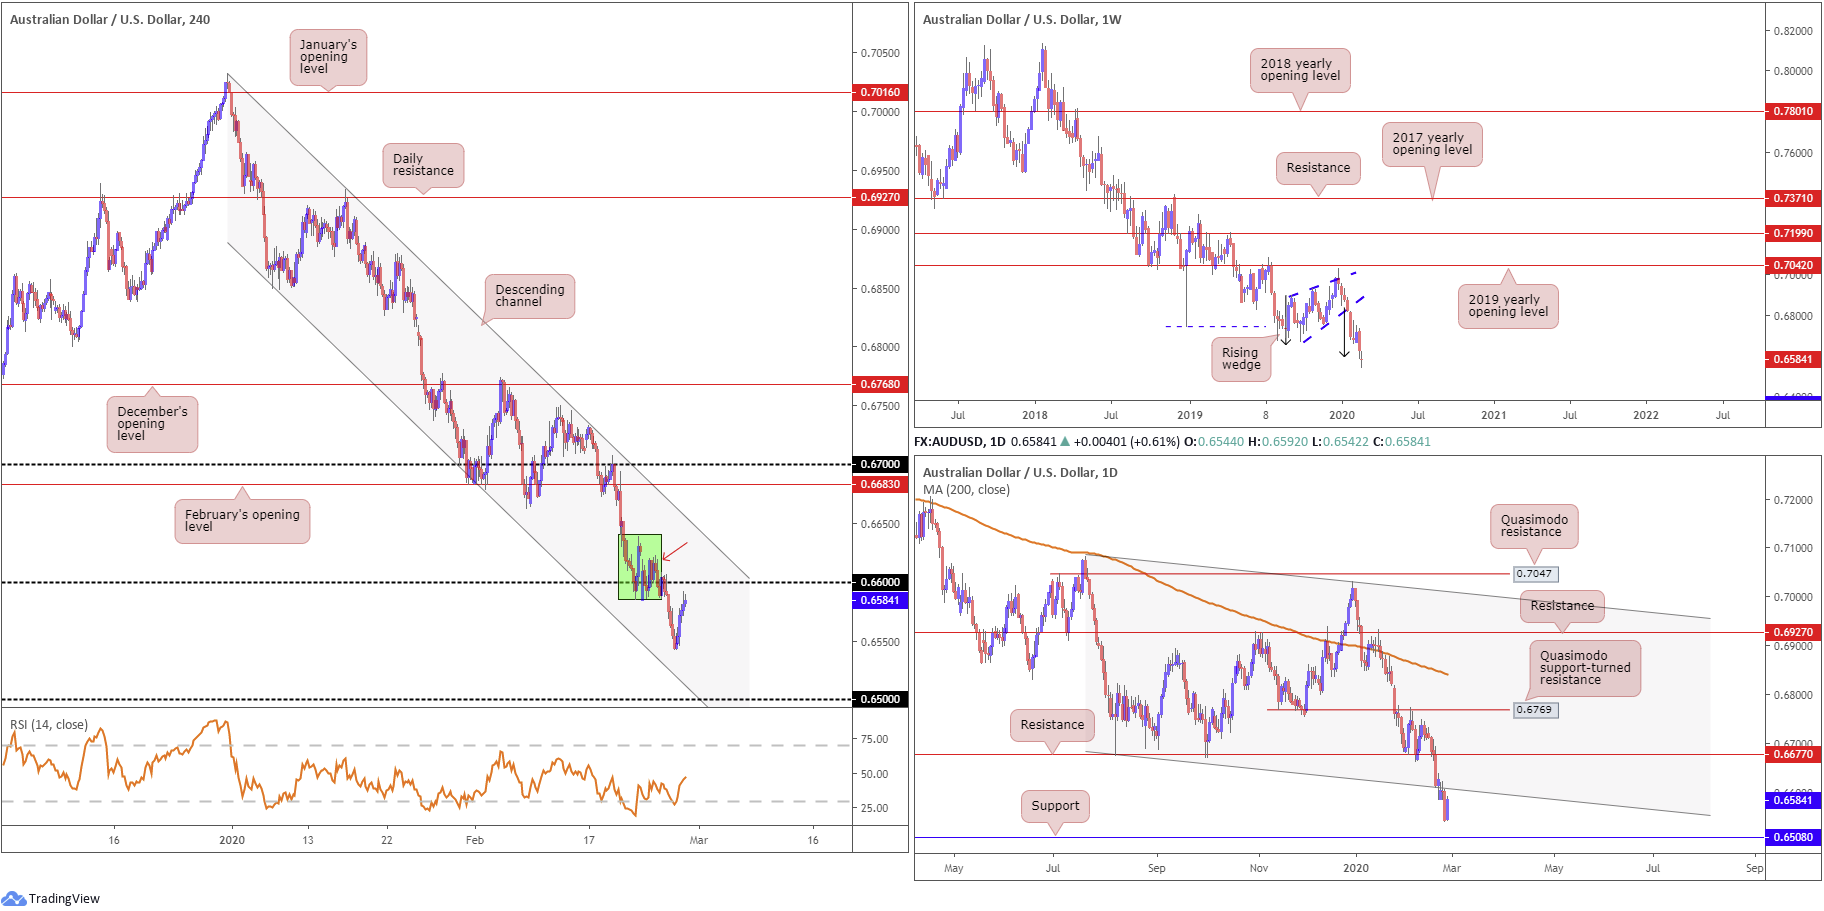
Following Wednesday’s pivotal run to multi-year lows at 0.6542, AUD/USD pencilled in a reasonably impressive recovery Thursday amid continued USD softness. Earlier in the day, private capital expenditures in Q4 disappointed, though the candles remained at pre-announcement levels.
0.66 is closing in fast on the H4 timeframe, with previous ranging activity (green) around this number likely a difficult slab to hack through. A break higher, nonetheless, could have buyers and sellers square off around channel resistance, extended from the high 0.7031.
Further afield, longer-term movement on the weekly timeframe recently shook hands with a rising wedge take-profit target at 0.6599 (black arrows – calculated by taking the height of the base and adding it to the breakout point). This pattern took five months to complete; well done to any readers who took part. With price nudging marginally beyond this barrier, however, continued downside on this scale could eventually see support at 0.6359 (not visible on the screen) enter view.
Aligning closely with the round number 0.66 on the H4 scale, daily price, leaving support at 0.6508, is also seen drawing nearer to channel support-turned resistance, taken from the low 0.6677.
Areas of consideration:
While a rebound higher could form on the weekly timeframe off the rising wedge take-profit target, the combination of daily channel support-turned resistance and the 0.66 handle on the H4 timeframe may serve as a reversal zone today, ultimately targeting daily support at 0.6508 and the 0.65 handle.
Conservative stop-loss placement is likely beyond H4 channel resistance, taken from the high 0.7031, though above the 0.6622 February 25th high might be more of a realistic location for most traders (red arrow).
USD/JPY:
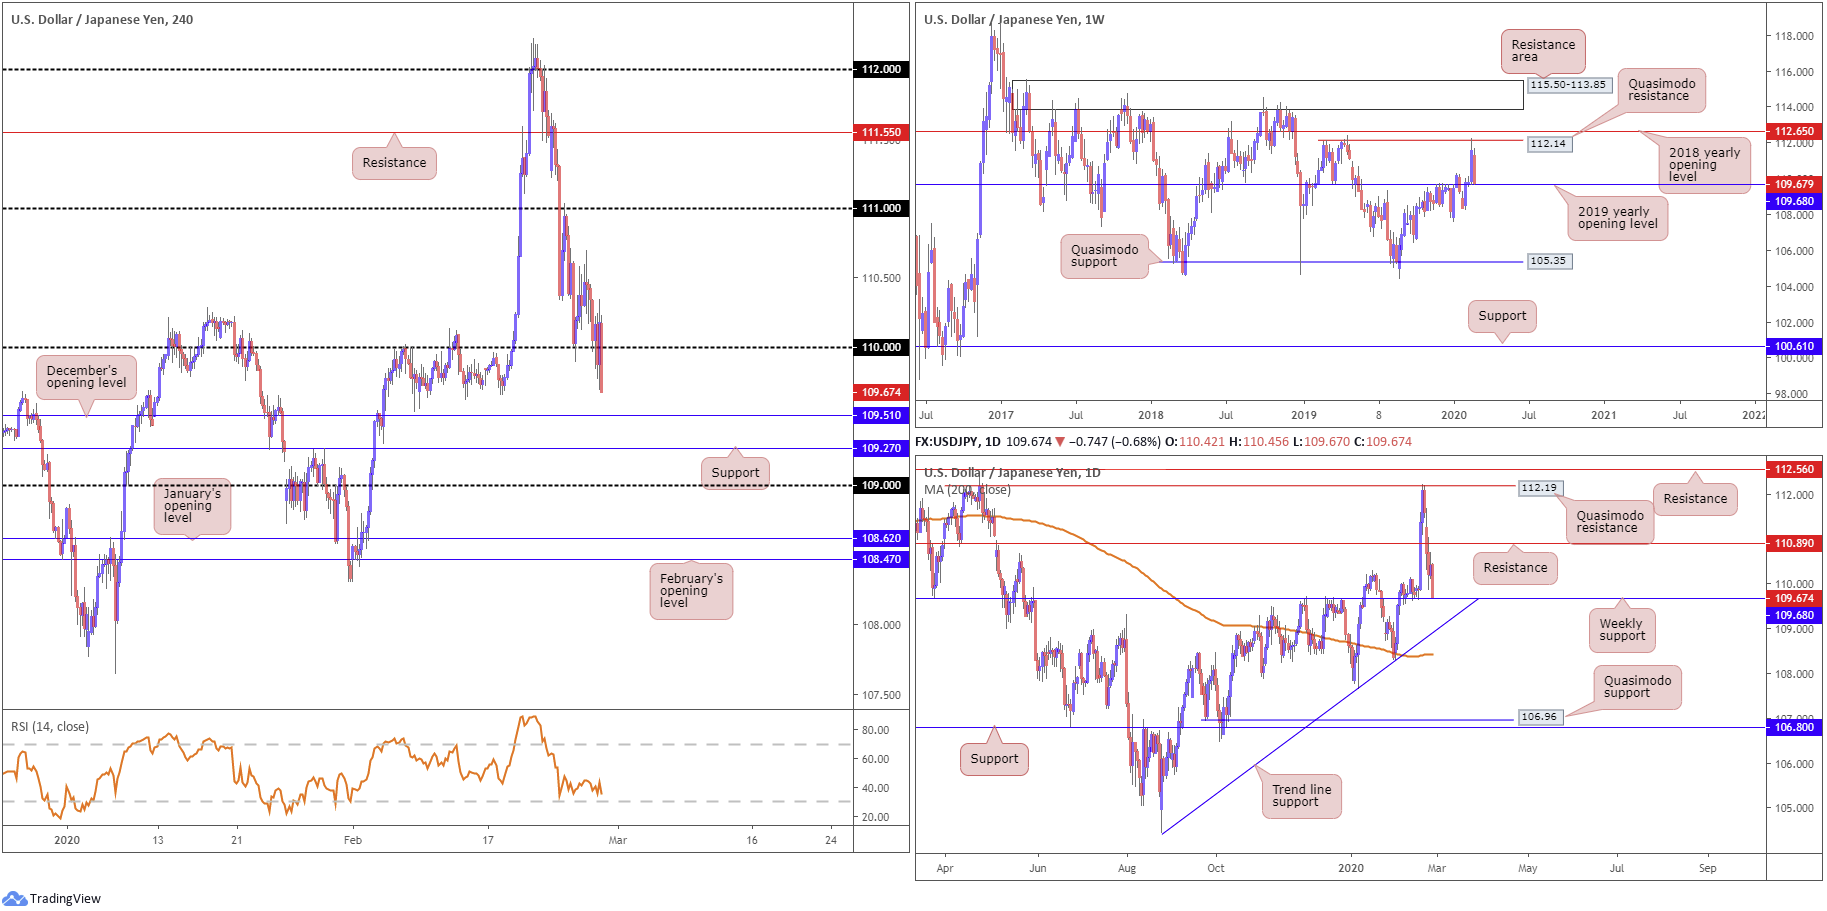
Thursday had price action revisit and breach 110 amid broad USD selling, weighed by US Treasury yields clocking all-time lows. December’s opening level at 109.51 on the H4 timeframe and support coming in at 109.27 remain set as the next layers of support on this scale. Beyond here, aside from 1.09, limited support is visible until reaching January’s opening level at 108.62. The relative strength index also continues to meander north of oversold waters, unable to crack 34.00.
Before smashing that sell button, though, weekly price is seen crossing paths with support coming in at 109.68, formed in the shape of the 2019 yearly opening level. This remains a key fixture in this market and could, despite the strong bearish vibe surrounding the dollar right now, offer the market some much-needed respite. Beyond weekly support, traders likely have eyes for daily trend line support, taken from the low 104.44, and the 200-day SMA (orange – 108.41).
Areas of consideration:
Well done to any readers who took advantage of bearish themes beneath 112 on Friday; this was a noted move to be aware of. The risk/reward from here is just mouth-watering.
Thursday’s technical briefing had the following to say, which remains valid going into Friday:
Going forward, 110 is likely to give way, knowing weekly support resides just beneath at 109.68. A test of this weekly base, followed up with a close back above 110, could prompt a recovery in this market, fuelled on the back of sell-stop liquidity taken from beneath 110.
Note, however, although we’re testing weekly support, the likelihood of a whipsaw forming through this base to December’s opening level at 109.51 or H4 support at 109.27 is a strong possibility. So, keep this in mind If you are looking for buying opportunities today.
USD/CAD:
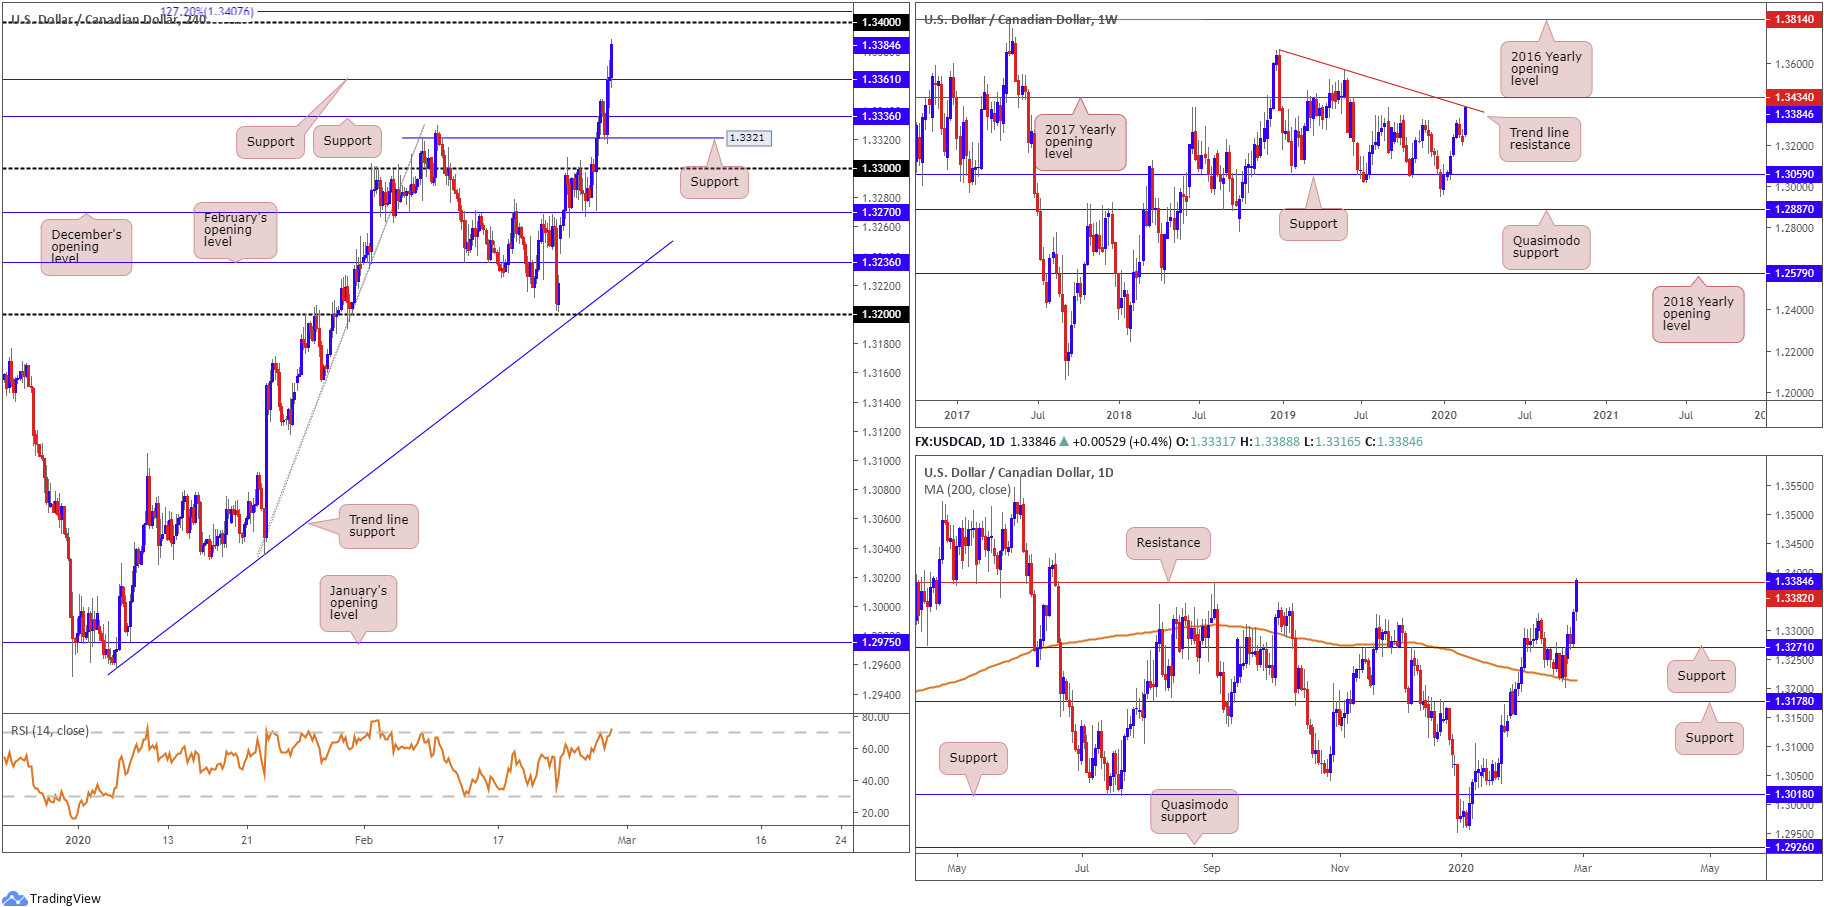
The US dollar, despite marked underperformance in the US dollar index, rallied to multi-month highs at 1.3388 against the Canadian dollar Thursday. Soft WTI prices, down more than 4.00%, weighed on the Canadian dollar and propped up the buck.
Technically, H4 price is seen nearing the 1.34 handle after overwhelming a number of key resistances. 1.34 is reasonably appealing from the H4 timeframe, joining closely with a 127.2% Fibonacci extension point at 1.3407, confirmed by the relative strength index (RSI) entering overbought territory.
Additional resistance is visible on the weekly timeframe, shaped by way of a trend line formation, taken from the high 1.3664 and the 2017 yearly opening level at 1.3434. By the same token, daily structure displays resistance around the 1.3382ish region.
Areas of consideration:
1.34 may serve as a possible reversal zone today, having seen it boast strong connections to weekly and daily resistances. Noting heavy weakness in oil markets, though, traders are urged to wait for additional confirmation to form off 1.34 before committing. This could be something as simple as a bearish candlestick pattern, such as a shooting star configuration. As for an initial downside target, H4 support lies in wait around 1.3361.
USD/CHF:
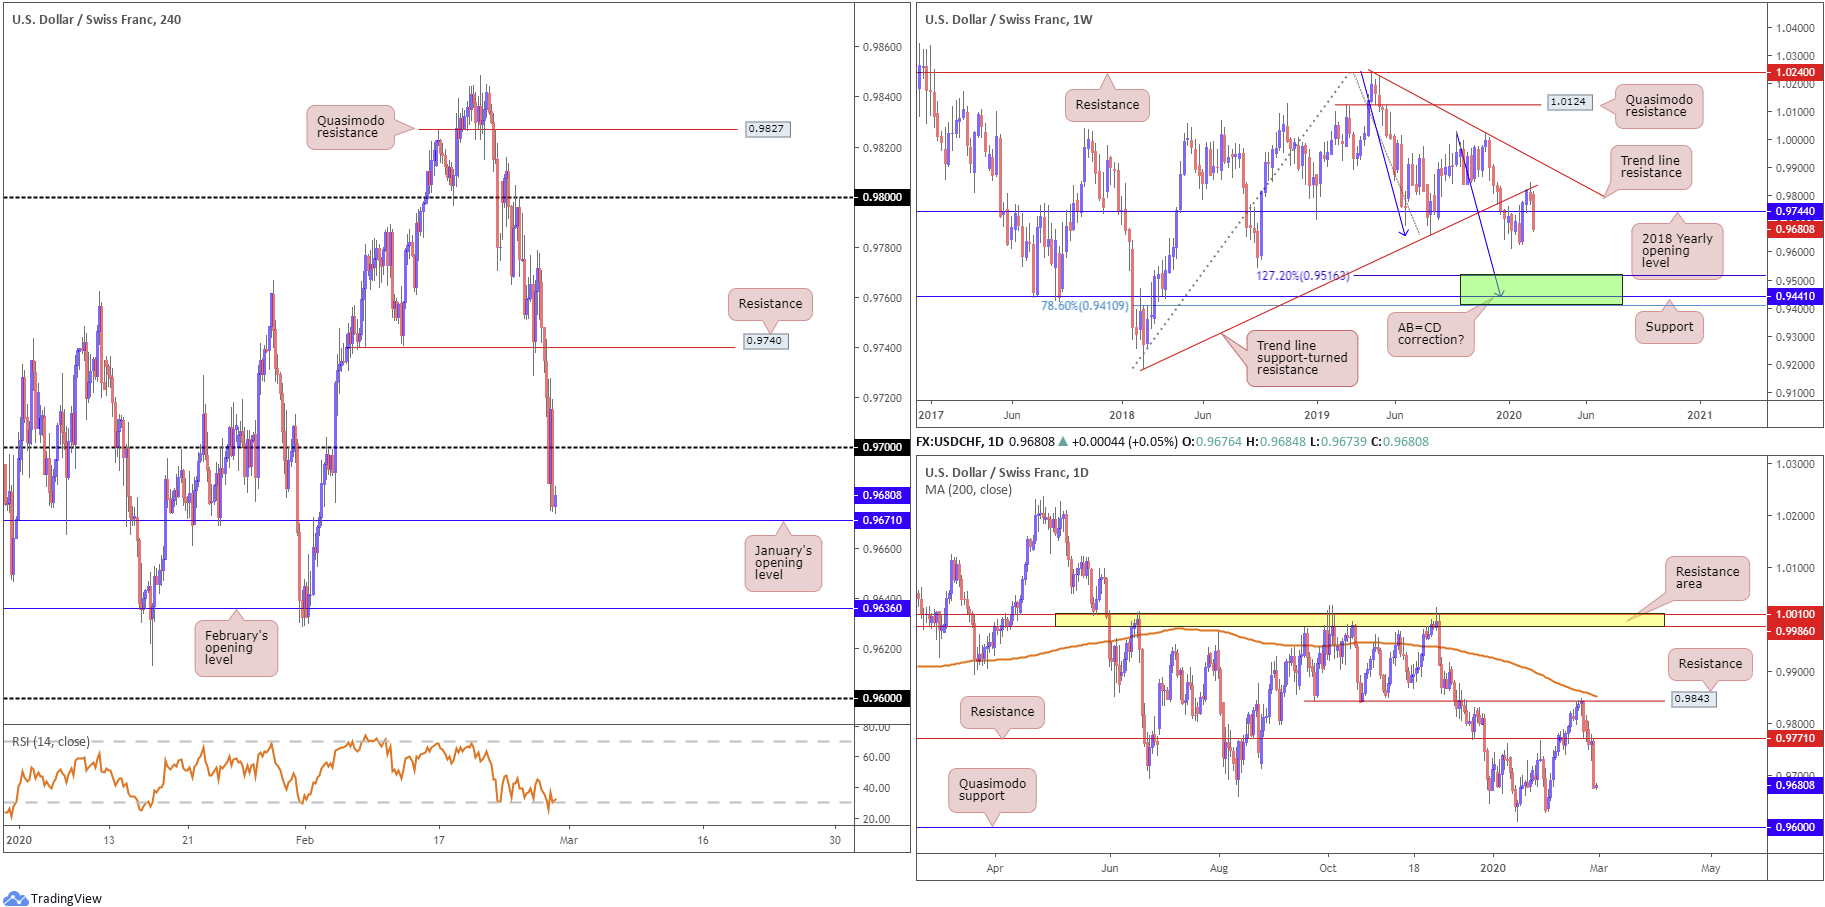
A broad risk-averse tone dominated market sentiment Thursday, as yield on the 10-year US Treasury note hit record lows. After failing to glean much backing off 0.97, USD/CHF is seen trading a touch north of January’s opening level at 0.9671 on the H4 timeframe. Beyond this threshold, February’s opening level at 0.9636 lies in wait, with a break exposing 0.96.
Looking at the weekly timeframe this morning, we can see the current candle extending ground south of the 2018 yearly opening level at 0.9744, capped by trend line support-turned resistance, drawn from the low 0.9187. From current price, the 0.9613 January 13th low is seen as possible support, followed by 0.9410/0.9516 (green) – comprised of a 78.6% Fibonacci retracement at 0.9410, support at 0.9441 and a 127.2% AB=CD bullish correction (black arrows]) at 0.9516.
Following last week’s rejection off daily resistance at 0.9843, price has since daily thrashed support at 0.9771 and is on course to test Quasimodo support at 0.9600, sited just south of 0.9613 January 16th low.
Areas of consideration:
Demand for the safe-haven Swiss franc may continue today, setting the stage for possible short-based scenarios off the underside of 0.97. Void of local and higher-timeframe confluence, however, traders may seek additional confirmation before getting involved. In terms of downside targets, January’s opening level at 0.9671 rests as an initial base, followed by February’s opening level at 0.9636.
Dow Jones Industrial Average:
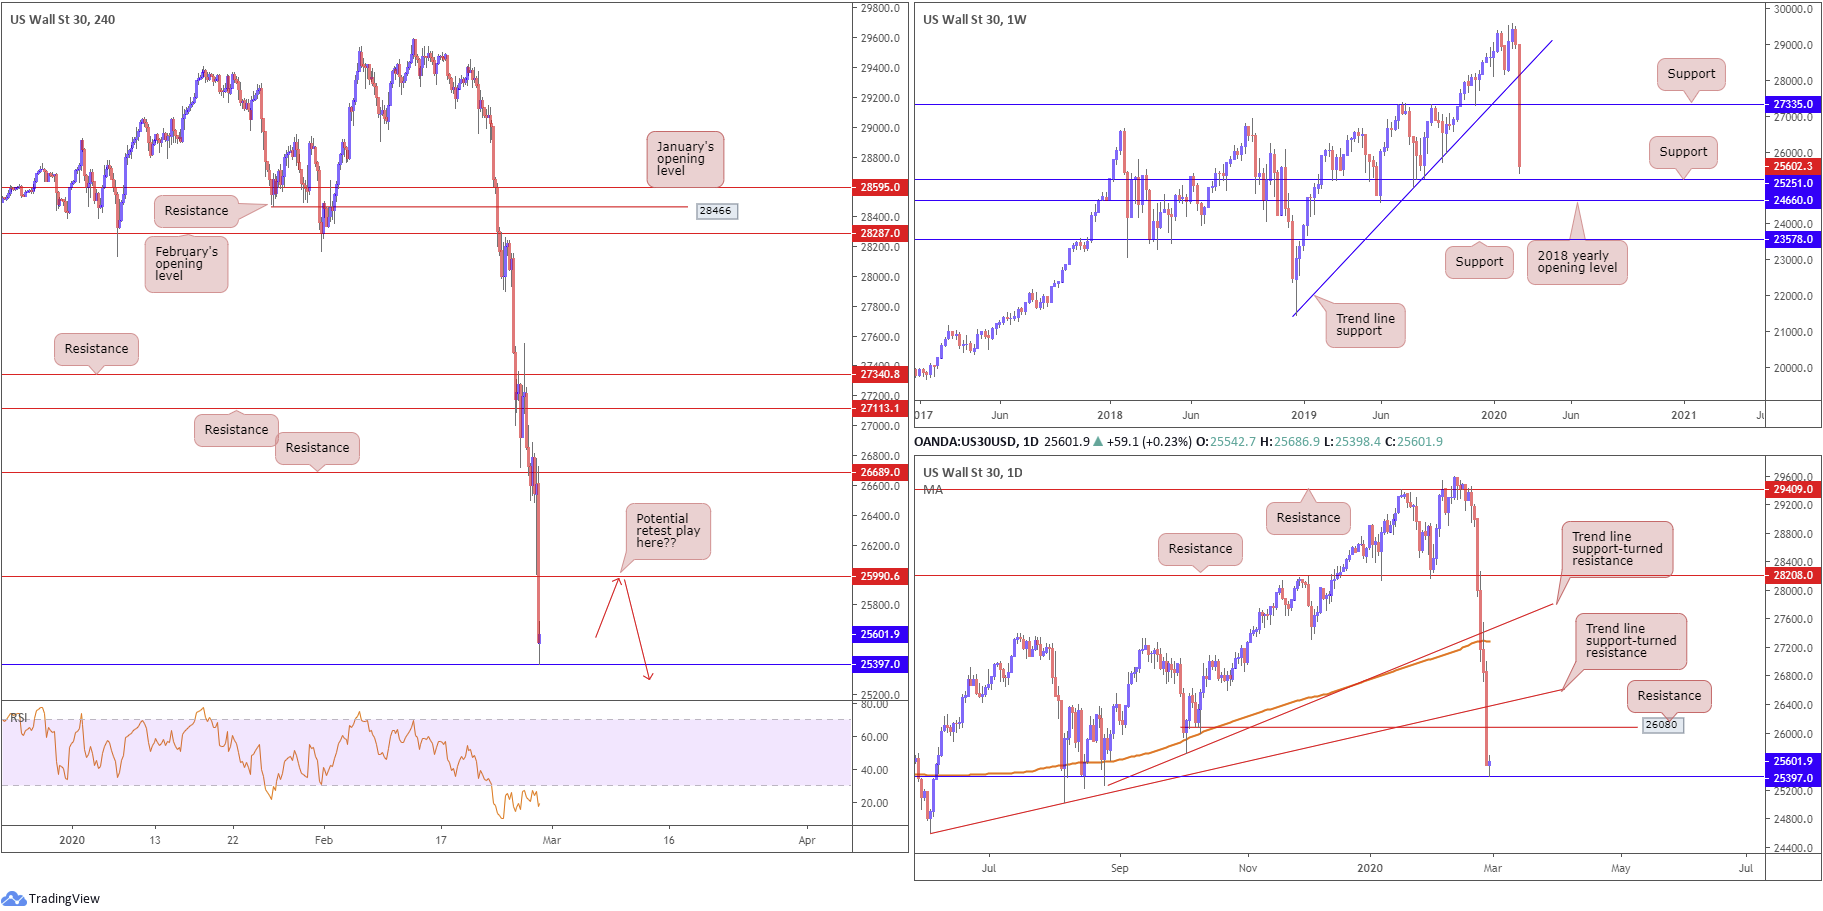
Major US benchmarks finished lower for a sixth successive session Thursday amid heightened concern surrounding the global coronavirus epidemic. The Dow Jones Industrial Average lost 1190.95 points, or 4.42%; the S&P 500 declined 137.63 points, or 4.42% and the tech-heavy Nasdaq 100 ended lower by 437.09 points, or 4.93%.
This week witnessed trend line support, taken from the low 21452, and support at 27335 both cede ground. Technical headlines on this scale has the index currently facing support coming in at 25251, which also represents a Quasimodo formation (left shoulder taken from 25215 March 11th 2019).
A closer reading on the daily timeframe has the unit currently fading support drawn in at 25397 after overthrowing trend line support, extended from the low 24604, and support coming in at 26080, now serving resistance. A similar view is visible on the H4 timeframe, with price tackling daily support at 25397. However, on this scale we can see the relative strength index trades within oversold terrain, producing mild bullish divergence, with the next resistance set at 25990.
Areas of consideration:
While daily and H4 structure forecast a recovery to at least H4 resistance at 25990, followed closely by daily resistance at 26080, weekly price suggests additional softness to support at 25251. Not many traders will likely have conviction in any support level right now, even more so after noting weekly price indicates an additional dip may be in store.
While longs off 25397 may be chancy, selling 25990 is considered reasonably high probability – that is assuming we have yet to cross swords with weekly support mentioned above at 25251.
XAU/USD (GOLD):
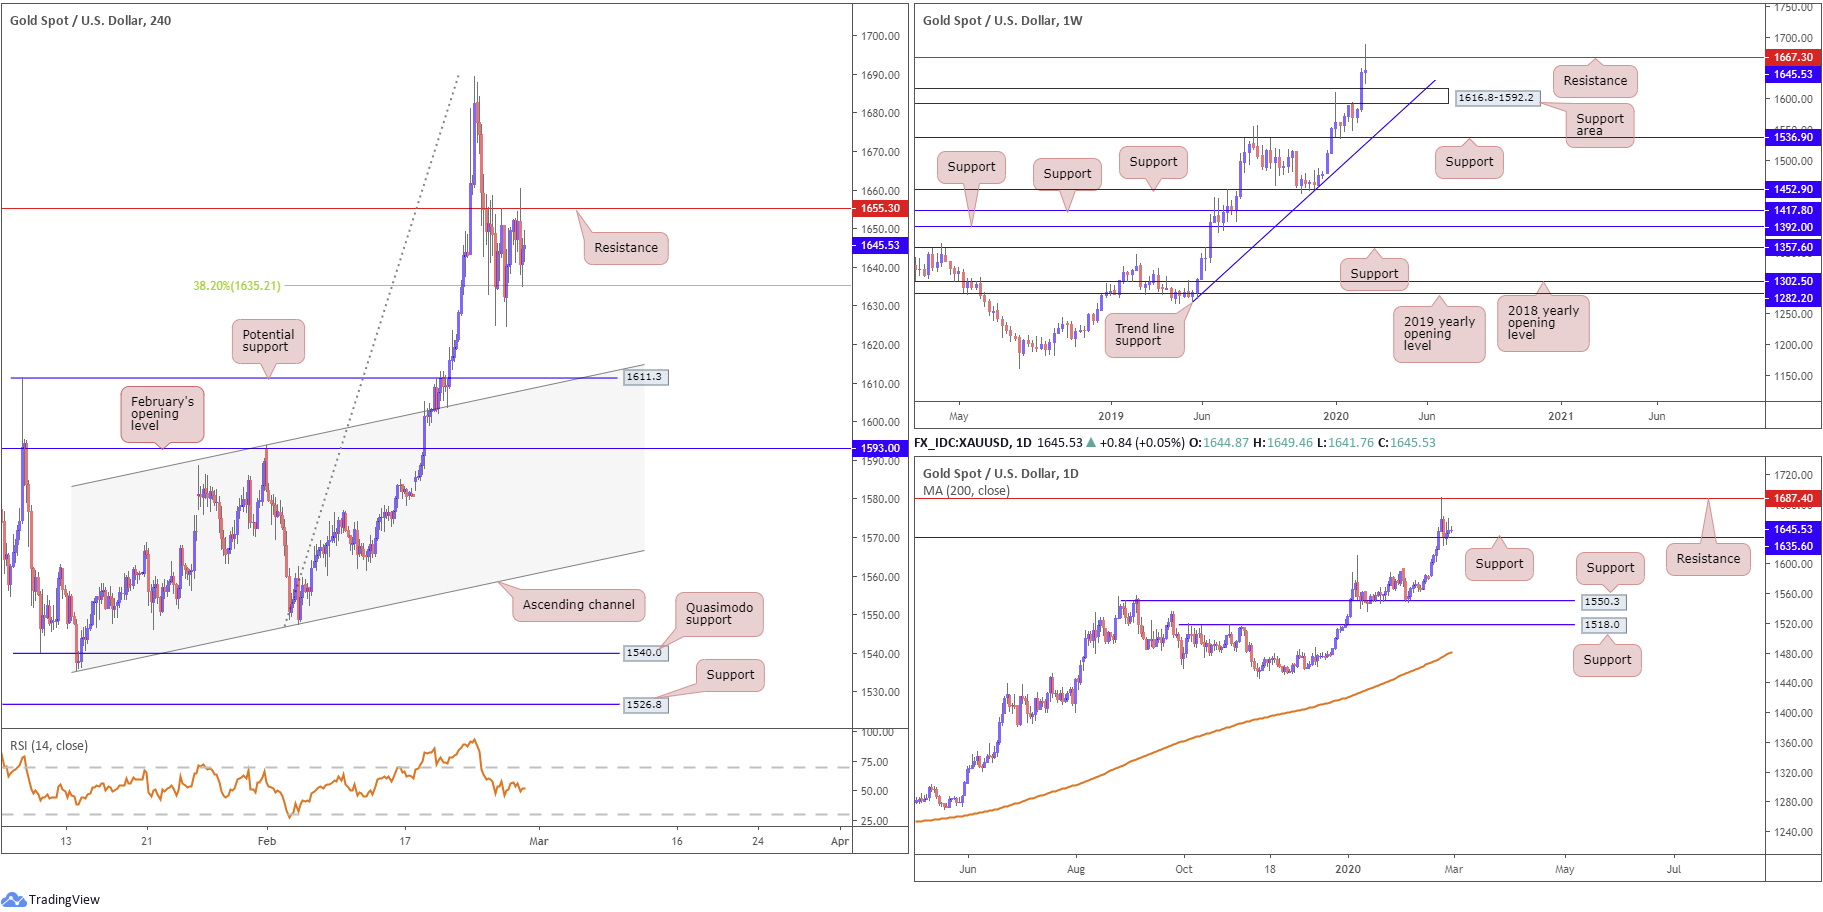
Risk aversion and dollar softness continues to drive XAU/USD flow. However, in view of another reasonably lacklustre performance yesterday, much of the following points aired here today will echo a similar vibe to Thursday’s technical briefing.
H4 action continues to find some respite off the 38.2% Fibonacci retracement level at 1635.2, though upside is capped by resistance at 1655.3. Interestingly, the Fibonacci level aligns with daily support at 1635.6. H4 Support at 1611.3, which happens to merge with channel resistance-turned support, taken from the high 1593.9, remains another point of interest on this scale. Meanwhile, indicator-based traders may also wish to acknowledge the relative strength index (RSI) is attempting to bottom around the 50.0 value, following a downward move out of overbought territory.
Higher-timeframe action has weekly price fading resistance at 1667.3. Continued selling from here could draw in a support area at 1616.8-1592.2. On the daily timeframe, resistance entered the fold at 1687.4, with support recently making a show at 1635.6.
Areas of consideration:
Daily support at 1635.6 could continue to hold price action higher today. However, the top edge of the weekly support area is also of interest at 1616.8, given it converges closely with H4 support at 1611.3.
Whether additional confirmation, such as candlestick patterns, is needed before pulling the trigger off either of the aforementioned supports is, of course, trader dependent. Traders are, however, urged to recognise we do have weekly resistance in play at 1667.3, despite the primary trend facing north.
The accuracy, completeness and timeliness of the information contained on this site cannot be guaranteed. IC Markets does not warranty, guarantee or make any representations, or assume any liability regarding financial results based on the use of the information in the site.
News, views, opinions, recommendations and other information obtained from sources outside of www.icmarkets.com.au, used in this site are believed to be reliable, but we cannot guarantee their accuracy or completeness. All such information is subject to change at any time without notice. IC Markets assumes no responsibility for the content of any linked site.
The fact that such links may exist does not indicate approval or endorsement of any material contained on any linked site. IC Markets is not liable for any harm caused by the transmission, through accessing the services or information on this site, of a computer virus, or other computer code or programming device that might be used to access, delete, damage, disable, disrupt or otherwise impede in any manner, the operation of the site or of any user’s software, hardware, data or property.