Thursday 2nd July: Technical Outlook and Review

Key risk events today:
Australia Trade Balance; US Average Hourly Earnings m/m, Non-Farm Employment Change, Unemployment Rate and Unemployment Claims.
(Previous analysis as well as outside sources – italics).
EUR/USD:
Worse-than-expected ADP and advancing equities dampened USD demand Wednesday, leading to a modest climb in EUR/USD.
For technical traders who read Wednesday’s briefing you may recall the following (italics):
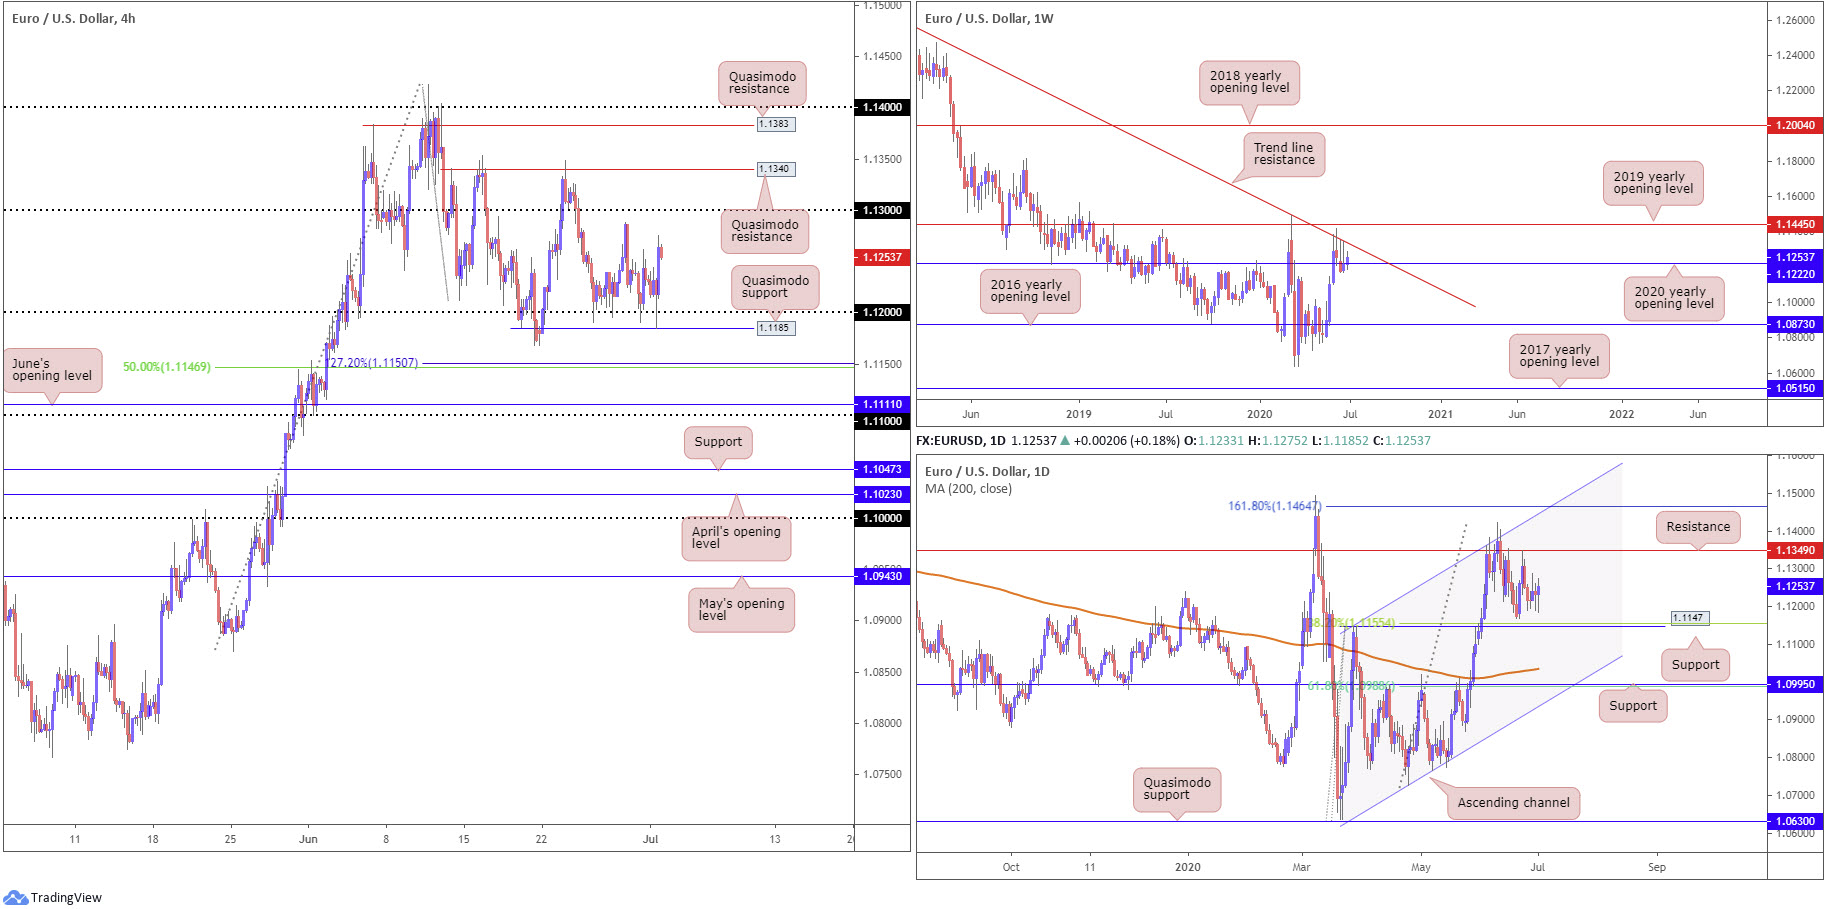
In light of recent support from 1.12 on the H4, buyers have likely tucked protective stop-loss orders under the round number, usually between 10-20 pips. This unlocks the door to a possible fakeout scenario today, involving a dip through 1.12 into H4 Quasimodo support at 1.1185. Not only would this move trip liquidity (stops) below 1.12, it would drag in any willing buyers off the Quasimodo formation. A H4 close back above 1.12 off 1.1185, therefore, would likely be a welcomed sight for buyers, perhaps targeting 1.13.
As evident from the H4 chart, a fakeout through 1.12 occurred yesterday, one that challenged H4 Quasimodo support at 1.1185. Well done to any readers who managed to jump aboard this move.
Further afield, trade remains fading long-standing trend line resistance, taken from the high 1.2555, on the weekly timeframe. Consequently, the 2020 yearly opening level at 1.1222 is also under fire. Any sustained move below the aforementioned barrier seats the 2016 yearly opening level at 1.0873 on the hit list, while a EUR/USD bid shifts focus on the possibility of reaching the 2019 yearly opening level at 1.1445.
The story on the daily timeframe, since the beginning of June, has price languishing south of resistance at 1.1349. Support derived from the 1.1147 27 March high, therefore, could soon become a reality, a level that merges closely with a 38.2% Fibonacci retracement ratio at 1.1155. Interestingly, breaching 1.1147 reveals the 200-day SMA (orange – 1.1035), closely followed by support at 1.0995 and a 61.8% Fibonacci retracement ratio at 1.0988.
Areas of consideration:
Traders long the 1.12 fakeout likely have eyes on 1.13 as an upside target. A break of the latter could lead to H4 Quasimodo resistance at 1.1340, followed by daily resistance at 1.1349.
In the event we eventually break 1.1185 on the H4, traders may wish to acknowledge the 127.2% Fibonacci extension point at 1.1150 and 50.00% retracement ratio at 1.1146 as a potential support area. Notably, this area converges with daily support at 1.1147 and 38.2% Fibonacci retracement ratio at 1.1155.
GBP/USD:
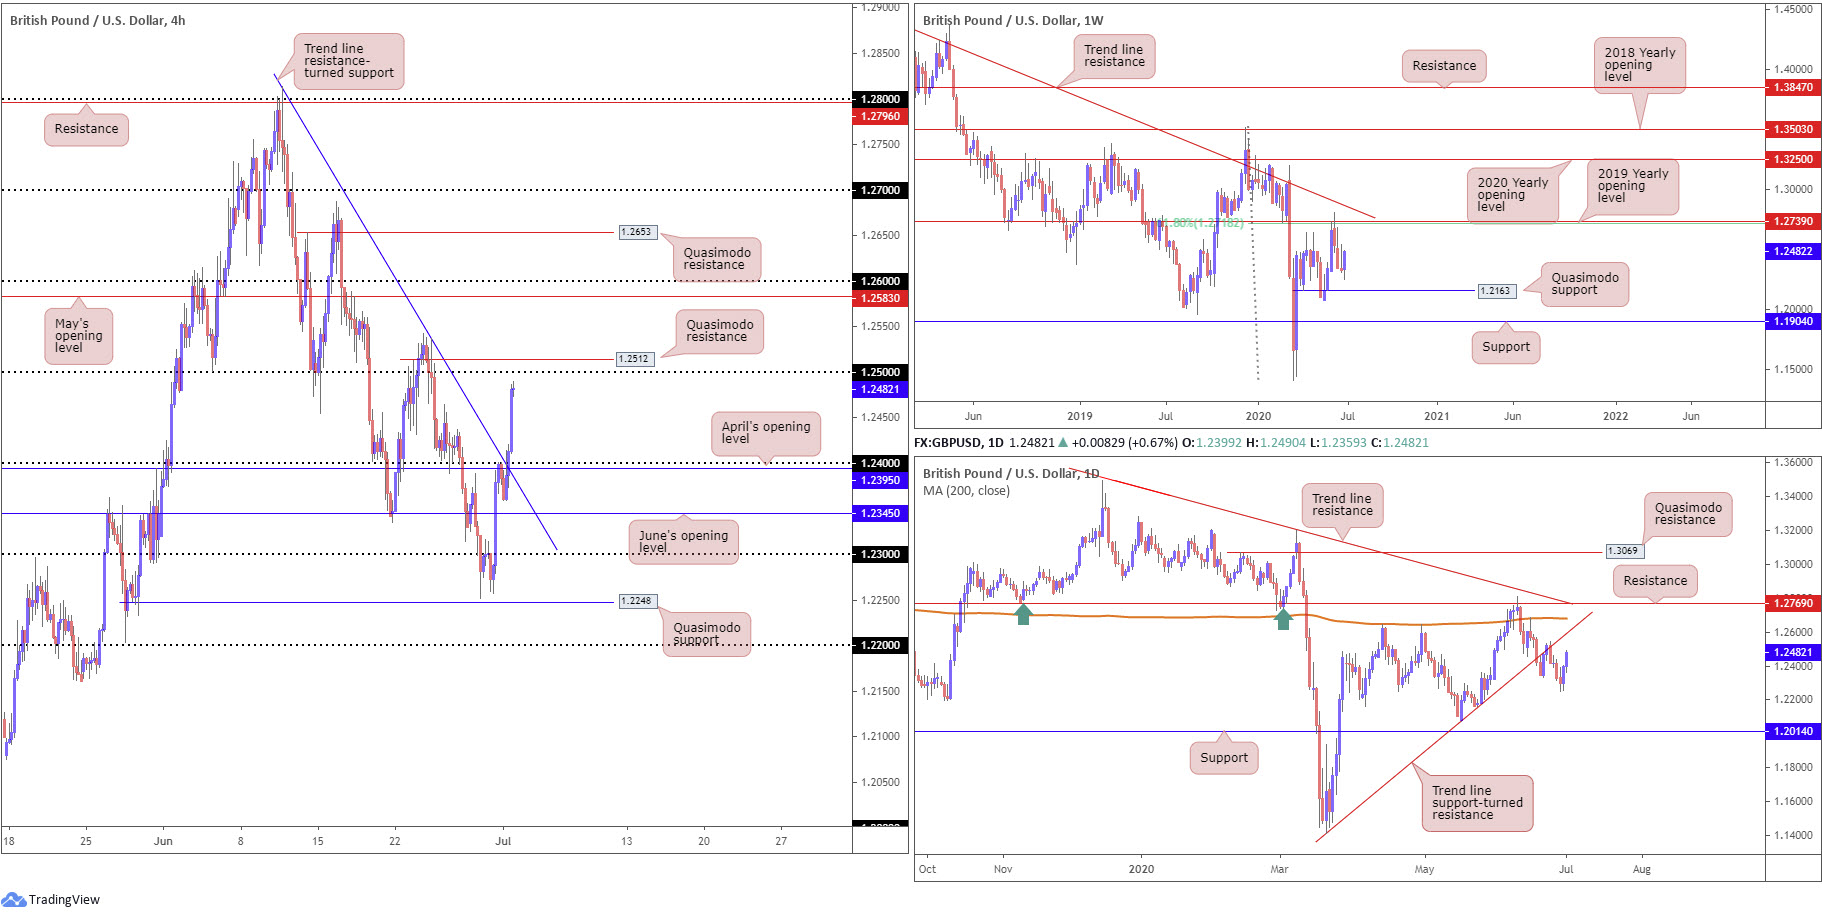
The British pound continued to add to gains against the US dollar Wednesday, latching onto a strong grip following the break of the 1.24 handle on the H4 and June’s opening level at 1.2345, as well as trend line resistance, taken from the high 1.2813. Recent buying has positioned the unit within striking distance of 1.25, closely followed by Quasimodo resistance at 1.2512.
Technical studies on the higher timeframes shows the current weekly candle emphasising a strong bullish tone, despite room to move lower to 1.2163 (Quasimodo support). Following-through buying is certainly a possibility from here, though, until shaking hands with a 61.8% Fibonacci retracement ratio at 1.2718 and 2019 yearly opening level at 1.2739.
Price action on the daily timeframe, meanwhile, closed a touch off best levels yesterday. Resistance can be found at a trend line support-turned resistance, taken from the low 1.1409. In terms of downside support, there appears room for an approach to support coming in at 1.2014, sited just south of the 1.2075 May 18 low. Before reaching this far south, though, weekly Quasimodo support must be absorbed at 1.2163.
Areas of consideration:
Today’s spotlight is focused on the 1.25 handle and H4 Quasimodo formation at 1.2512, as a possible base of resistance. However, in view of the higher timeframes indicating we could push beyond here, caution is recommended. As a result, focus will also likely be on the possibility of a H4 close north of 1.25. This may be enough to prompt another wave of buying, targeting May’s opening level at 1.2583 and the 1.26 handle.
AUD/USD:
AUD/USD pencilled in modest gains Wednesday, largely bolstered on the back of reasonably upbeat risk sentiment and a better-than-expected Chinese Caixin Manufacturing PMI print. Despite this, though, Aussie Building Approvals fell sharply in May.
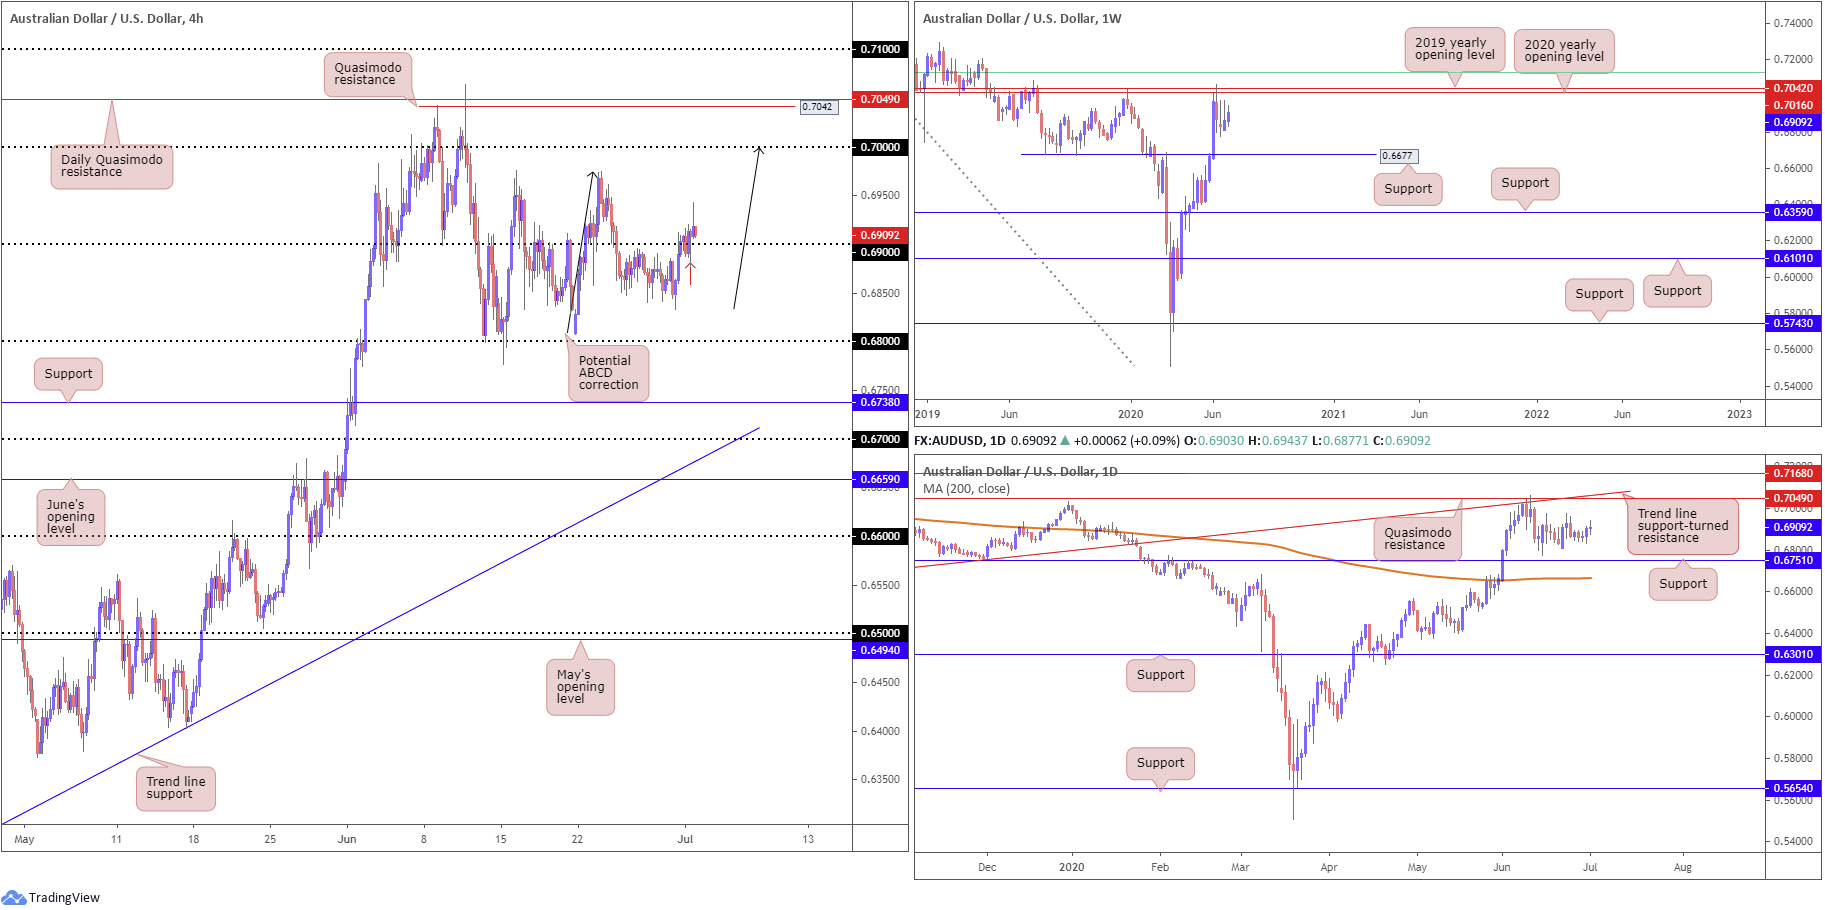
Intraday flow was messy around the 0.69 handle during Asia and European hours, no doubt causing confusion on the lower timeframes. Nevertheless, we managed to secure ground above the round number amid the US session, shining the spotlight on the 0.6976 peaks, as well as the key figure 0.70 and a converging ABCD pattern (black arrows).
Resistance, forged in the shape of a 2020 yearly opening level and a 2019 yearly opening level, at 0.7016 and 0.7042, respectively, continues to offer a dominant presence on the weekly timeframe. It might also interest traders to note that just above the said resistances we have a 61.8% Fibonacci retracement ratio at 0.7128 (green). In terms of support, crosshairs remain fixed on 0.6677.
From the daily timeframe, we remain wandering in no man’s land. Despite this, structure is still visible nearby. Quasimodo resistance at 0.7049 is in sight, merging closely with trend line support-turned resistance, taken from the low 0.6670. Attention on this timeframe also remains at support coming in from 0.6751. Interestingly, lurking beneath here we also have the 200-day SMA (orange – 0.6666), located close by weekly support mentioned above at 0.6677.
Areas of consideration:
With H4 candles establishing a position above 0.69, this will likely drive buyers into the market.
Breakout buyers may already be long, with protective stop-loss orders tucked under the 0.6877 low (red arrow). Conservative traders, on the other hand, may prefer to wait and see if a retest at the round number emerges before pulling the trigger.
Regardless of the entry technique, upside targets rest at 0.6976 and 0.70.
USD/JPY:
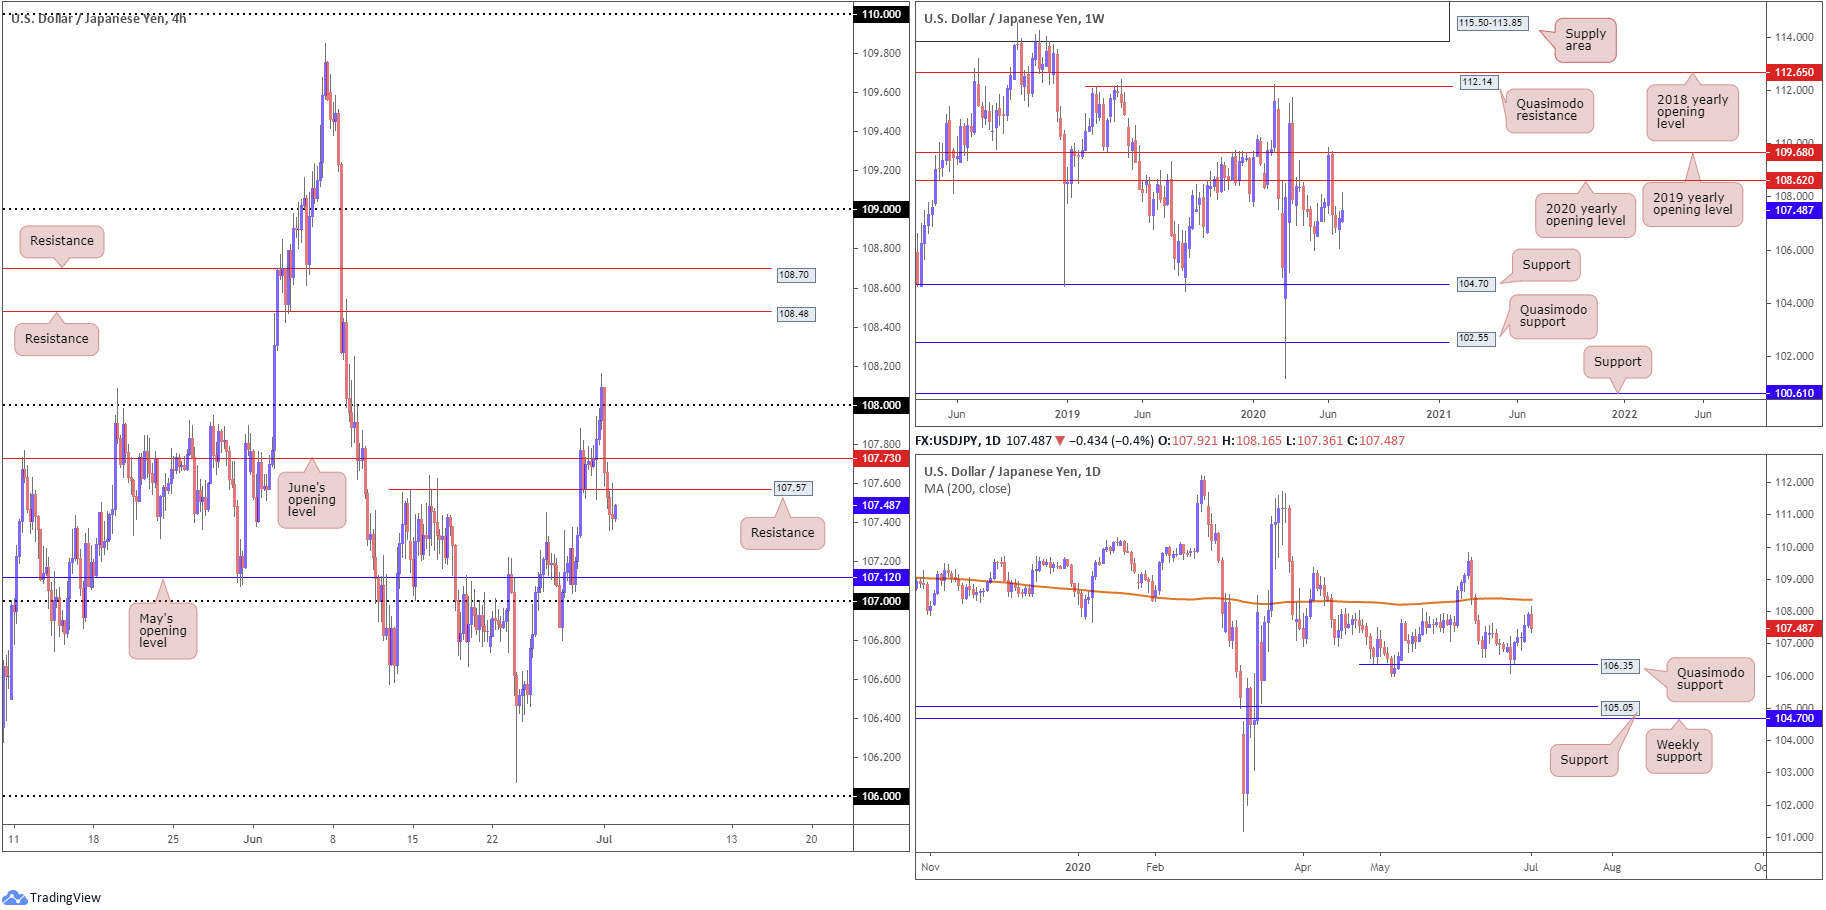
Early trade had H4 surpass 108 to the upside and fold over from highs at 108.16. Throughout the day, sellers made their presence felt and made quick work of June’s opening level at 107.73 and support coming in at 107.57 on the H4. Both structures enter Thursday representing resistance, with downside exhibiting scope to approach May’s opening level at 107.12 as well as the 107 handle.
Snapping a two-day bullish phase and shaping a bearish outside day yesterday, daily price, albeit leaving behind the 200-day SMA (orange – 108.37), brings attention back to Quasimodo support at 106.35. Meanwhile, on the weekly timeframe, with the recent push ahead of the 105.98 6th May low, price could still potentially advance to the 2020 yearly opening level at 108.62.
Areas of consideration:
In recent hours, H4 resistance at 107.57 was recently retested, though sellers currently offer a non-committal tone. This implies a retest at 107.73 (June’s opening level on the H4) may unfold.
Given the daily bearish outside day, 107.57 and 107.73 denote solid levels of resistance today, offering reasonably appealing risk/reward to 107.12/107.
USD/CAD:
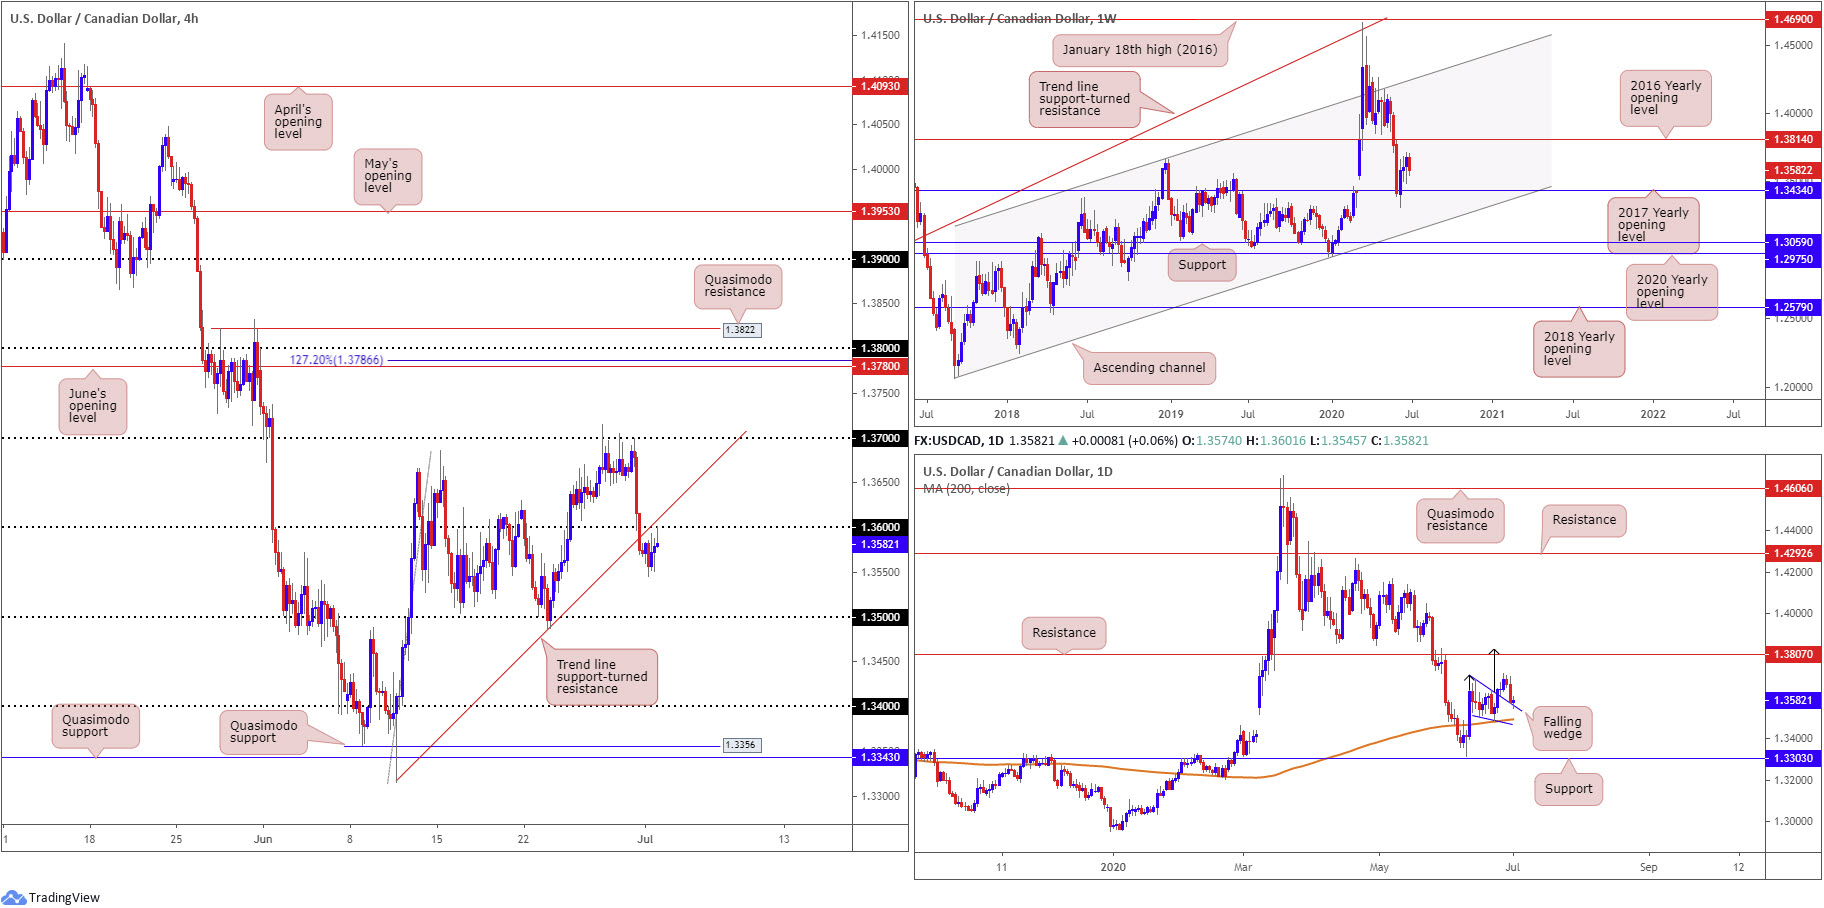
Buyers and sellers were pretty even Wednesday, following Tuesday’s decisive push through 1.36 and trend line support, taken from the low 1.3315. As can be seen from the H4 chart this morning, 1.36 is currently serving as resistance, positioned close by the recently engulfed trend line support.
The retest at the 1.36 resistance may appeal to intraday traders. The problem is daily price is also retesting the top edge of the current falling wedge pattern as a support (1.3686/1.3504). Take-profit targets out of falling wedges can be measured by taking the base value and adding this figure to the breakout point (black arrows), which as you can see in this case, converges closely with the next daily resistance at 1.3807.
From the weekly timeframe, room to advance ahead of the 2017 yearly opening level at 1.3434 certainly remains a possibility. A potential hurdle to be aware of, though, falls in by way of the 2016 yearly opening level at 1.3814, with follow-through buying likely to try and tackle a dense block of supply between 1.4190/1.3912.
Areas of consideration:
Usually the higher timeframes take precedence over lower-timeframe levels. Therefore, the retest at 1.36, although appealing, may fall flat.
A H4 close above 1.36, given the daily timeframe’s position, could stimulate a recovery beyond H4 trend line support-turned resistance, from 1.3315, towards at least 1.37, with an ultimate upside target at 1.38ish (higher-timeframe resistances).
USD/CHF:
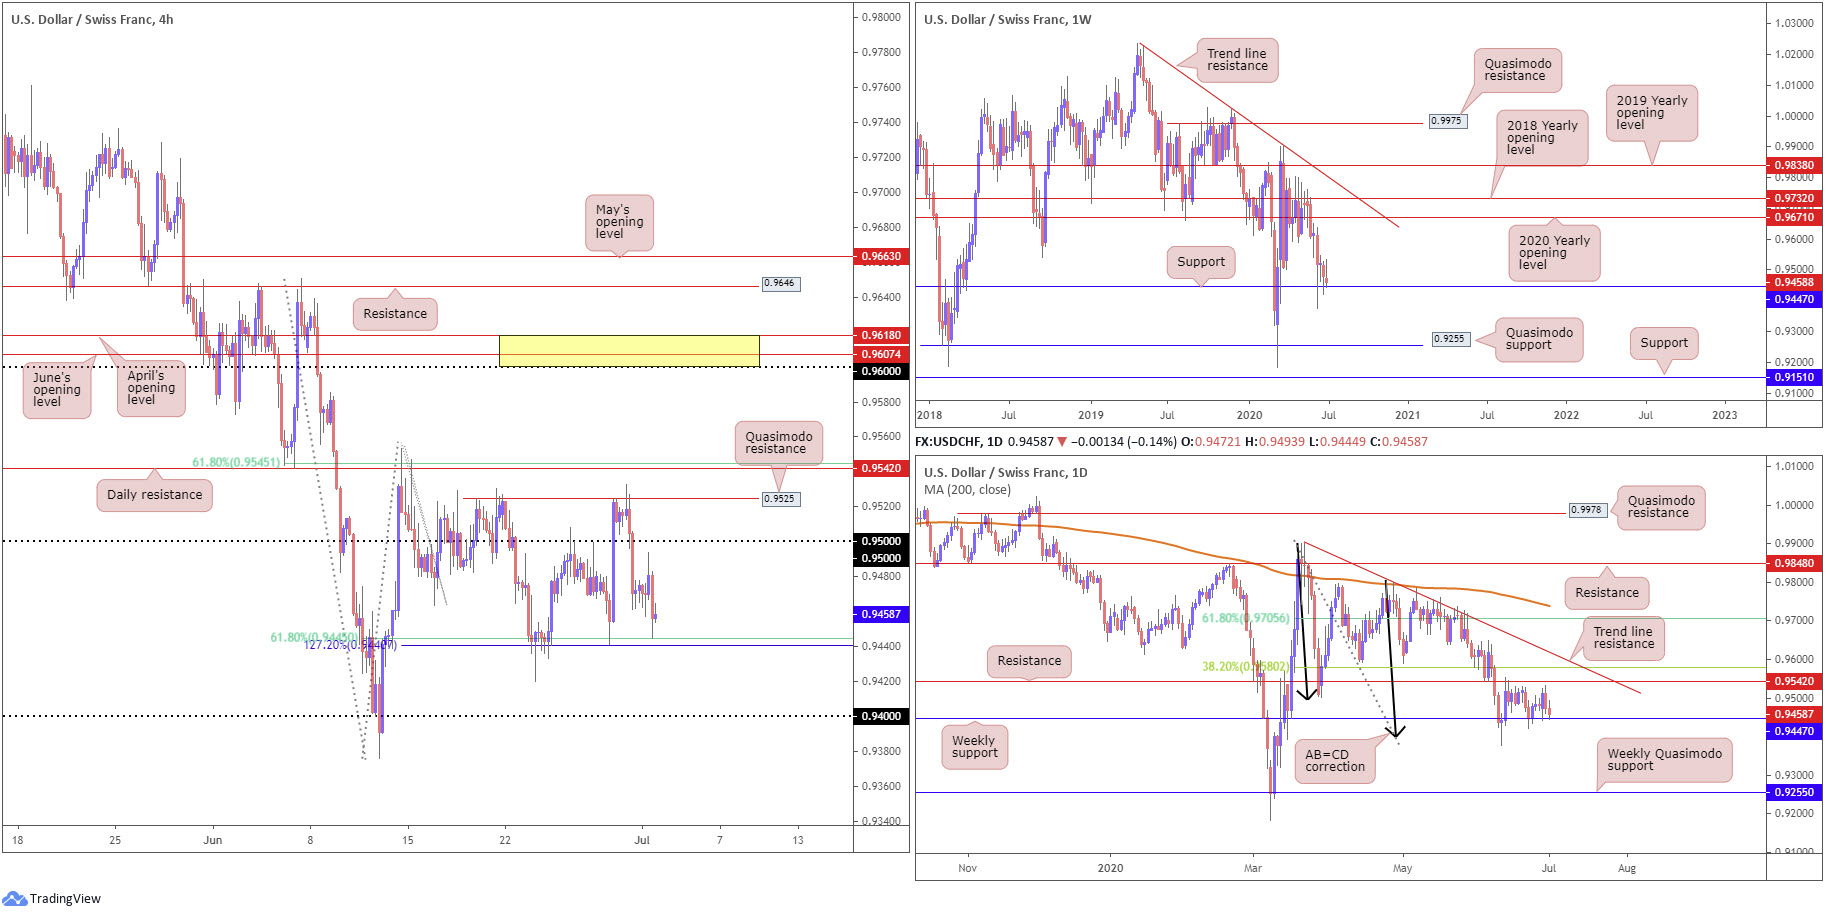
Amid a moderate improvement in risk sentiment Wednesday, the US dollar index, or DXY, navigated lower territory nearby the 97.00 handle. Based on the charts, USD/CHF cruised into weekly support drawn from 0.9447, a familiar level since June 11. Despite the lack of enthusiasm off 0.9447 so far, in the event we do see things turn here, the 2020 yearly opening level at 0.9671 is marked as the next resistance target on the weekly timeframe, stationed close by the 2018 yearly opening level at 0.9732.
After leaving 0.95 unchallenged on the H4 timeframe, candle action dipped to the 61.8% Fibonacci retracement ratio at 0.9445, a level shadowed closely by the 127.2% Fibonacci extension point at 0.9440. Note this combination also benefits from weekly support mentioned above at 0.9447.
On the daily timeframe, the initial break of weekly support at 0.9447 (11 June) threw breakout sellers into a bear trap as daily buyers vigorously defended AB=CD structure (black arrows) at 0.9395. The initial upside target out of the daily AB=CD pattern, traditionally speaking, can be found at the 38.2% Fibonacci retracement ratio at 0.9580 (derived from legs A-D), positioned above resistance at 0.9542, which, as you can see, has so far done a superb job in holding back buyers. In the event we overrun 0.9542 and also 0.9580 we could, according to traditional measures, cross swords with the next AB=CD target at 0.9705, the 61.8% Fibonacci retracement ratio, also taken from legs A-D. This implies a push above trend line resistance, taken from the high 0.9901.
Areas of consideration:
As stated in recent reports, weekly support at 0.9447 continues to remain a watched level in this market. Consequently, until this level surrenders, bullish strategies may be the way forward.
With H4 now engaging the 61.8% Fibonacci retracement ratio at 0.9445/127.2% Fibonacci extension at 0.9440, these levels, coupled with weekly support at 0.9447, puts forward active support worthy of attention. Combined, this area will likely see traders enter the market in search of bullish themes.
Dow Jones Industrial Average:
Wednesday had the Dow Jones Industrial Average dip 77.91 points, or 0.30%; the S&P 500 advance 15.57 points, or 0.50%, and the tech-heavy Nasdaq 100 conclude higher by 122.40 points, or 1.21%.
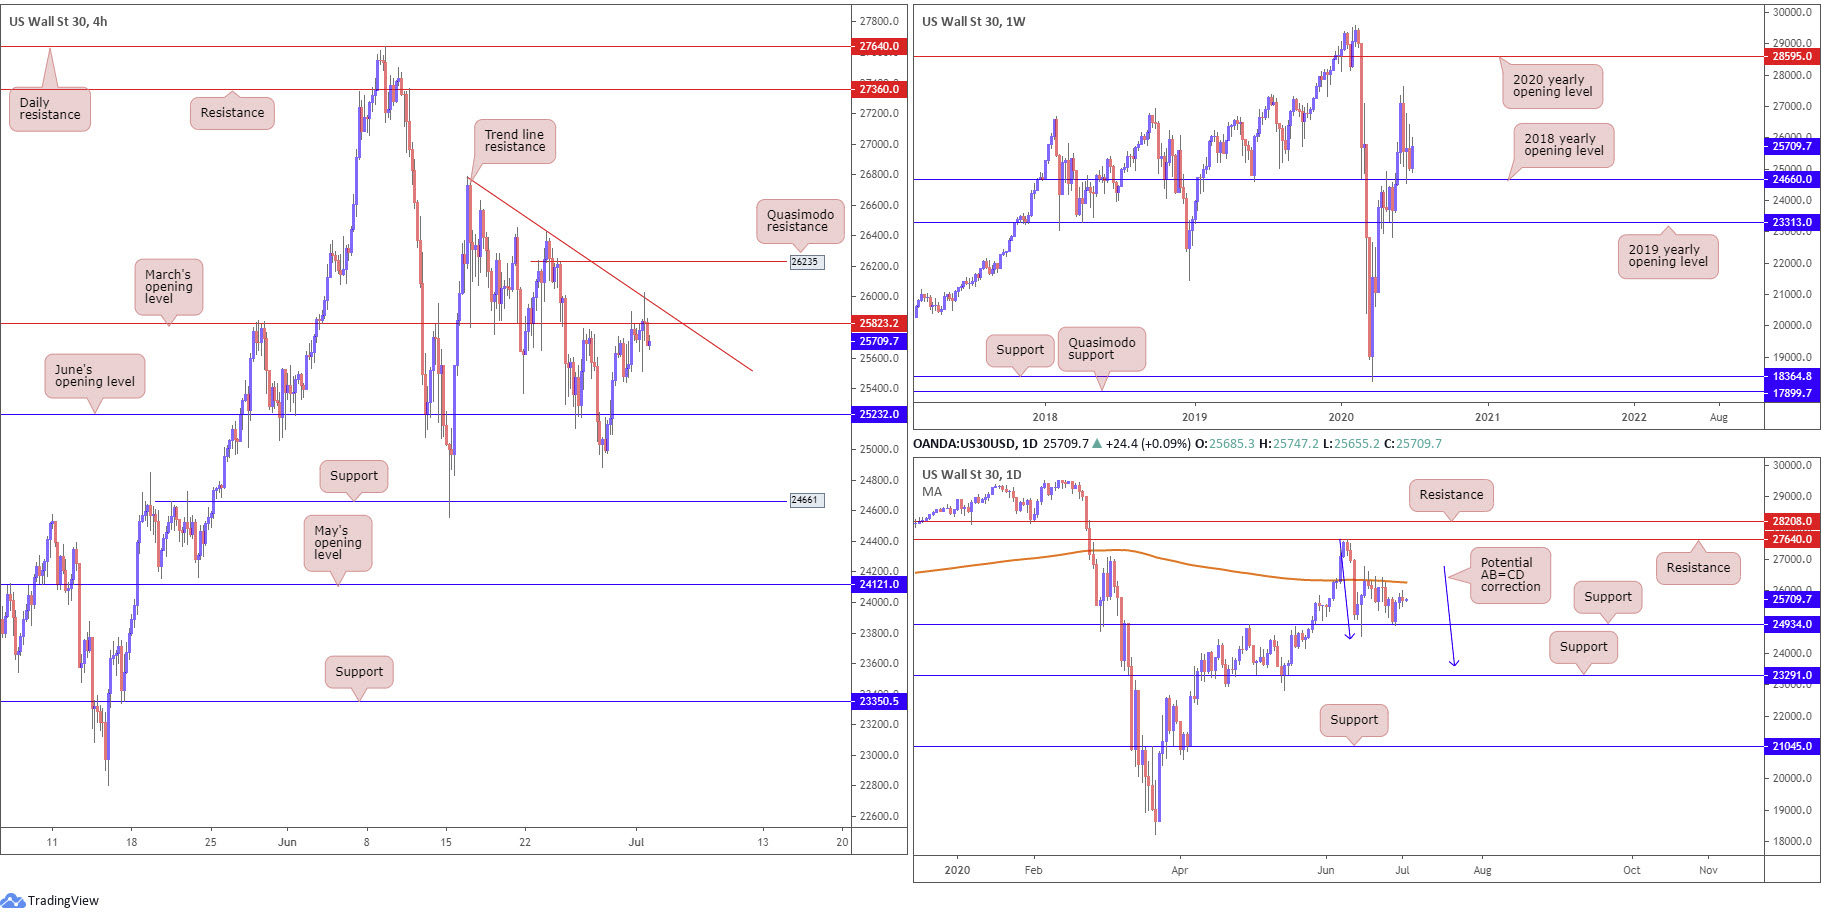
March’s opening level at 25823 remains a port of resistance on the H4 timeframe, albeit suffering a rather vigorous whipsaw to local trend line resistance, taken from the high 26787. Dipping further from current price throws June’s opening level at 25232 in the pot as feasible support today. A bid, on the other hand, will likely have price look for Quasimodo resistance coming in at 26235.
The 2018 yearly opening level at 24660 remains an important base of support on the weekly timeframe. In the event buyers manage to keep their head above water here, we may eventually pull in the 27638 high, followed by the 2020 yearly opening level at 28595. Below 24660, however, traders’ crosshairs may be fixed on the 2019 yearly opening level at 23313.
Since June 16, the 200-day SMA (orange – 26268) has absorbed upside attempts, with recent trade bringing in support from 24934 on the daily timeframe and rebounding higher. In case buyers struggle here, dipping a toe in waters south of 24934 may see support at 23291 call for attention. Another key observation is a potential AB=CD correction (blue arrows) at 23553.
Areas of consideration:
Having seen buyers attempting to establish a position north of weekly support (2018 yearly opening level) at 24660 and also daily support at 24934, it is questionable whether March’s opening level at 25823 and trend line resistance on the H4 will hold. In the event we do push lower, nonetheless, June’s opening level at 25232 is likely to be welcoming.
Equally uncertain is entering into long positions above current H4 trend line resistance, as the 200-day SMA lurks close by at 26268, along with H4 Quasimodo resistance at 26235. This may be possible if you’re able to drill down to the lower timeframes and secure a position offering a tight stop.
XAU/USD (GOLD):
For those who read Wednesday’s technical briefing you may recall the following (italics):
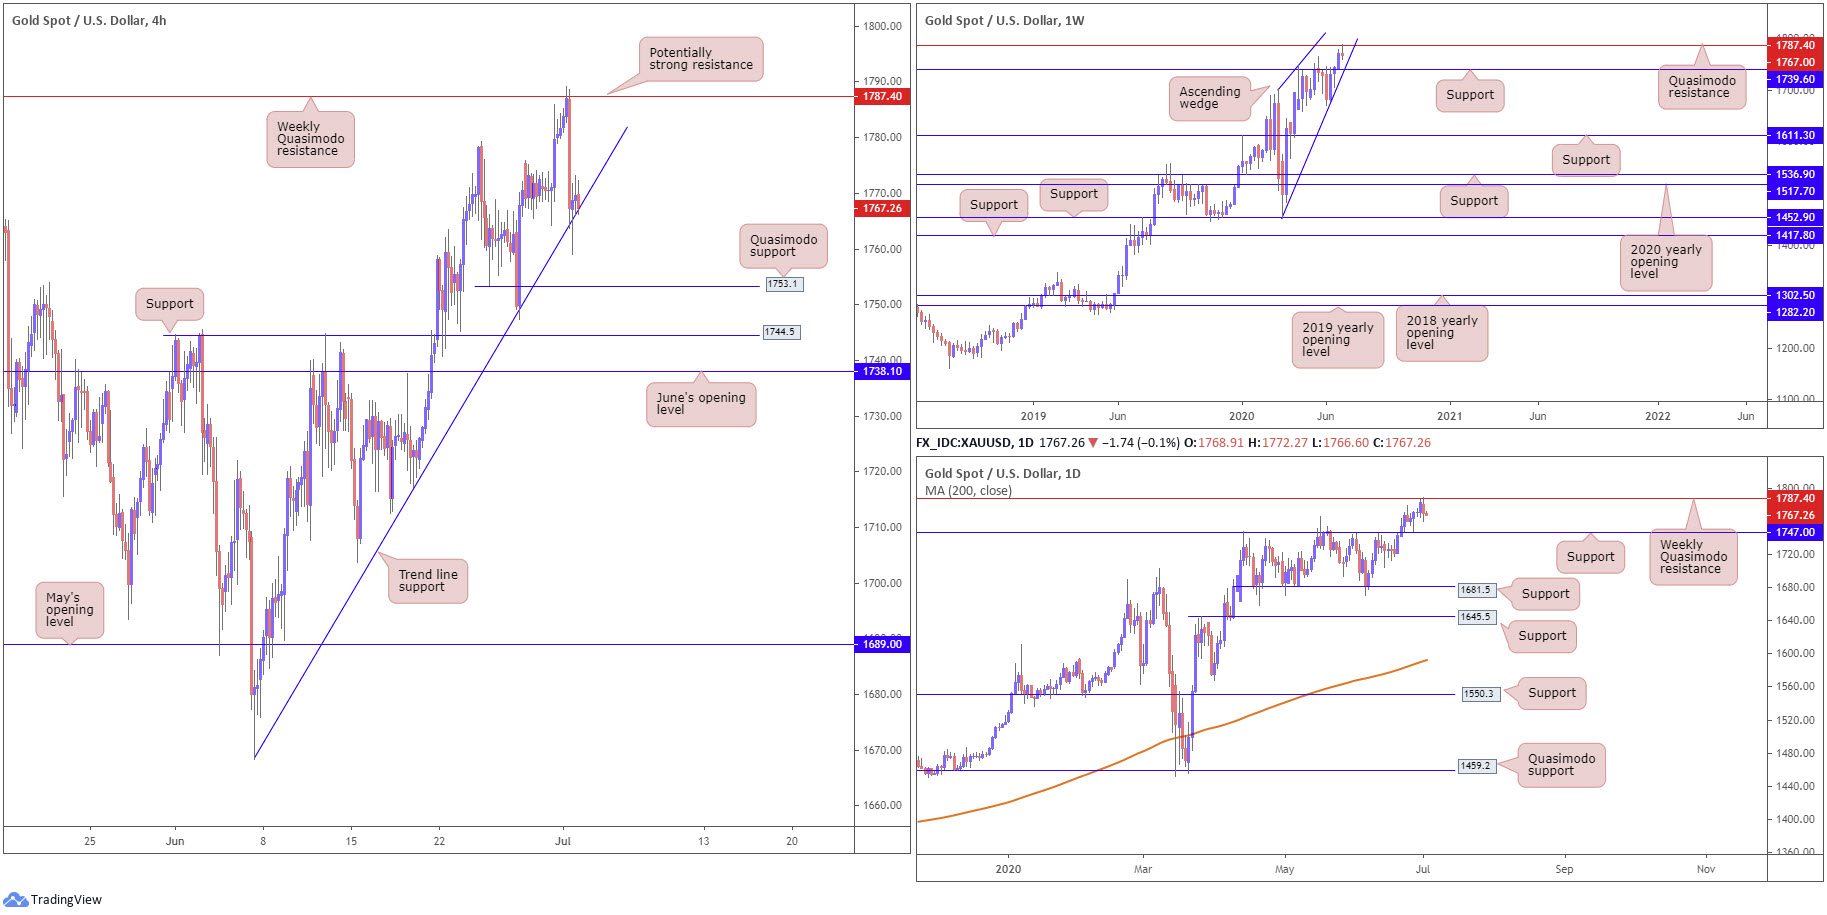
On all three timeframes, it is clear we’re trading within close proximity of a key resistance, a weekly Quasimodo formation at 1787.4. Also interesting on the weekly timeframe is a potential ascending wedge pattern between 1451.4/1703.6, perhaps serving as a reversal pattern.
Bearish scenarios off weekly Quasimodo resistance at 1787.4 are possible today, targeting H4 trend line support, etched from the low 1668.3. A break of here serves as a sign we may then head for H4 Quasimodo support at 1753.1, followed by daily support at 1747.0.
As evident from the charts this morning, price rebounded strongly from weekly Quasimodo resistance and made its way to H4 trend line support.
Areas of consideration:
Traders short the current weekly Quasimodo resistance level have likely reduced risk to breakeven at H4 trend line support and maybe even banked a portion of profits. The next take-profit targets, as highlighted above, rests at H4 Quasimodo support from 1753.1, followed by daily support at 1747.0.
Additionally, a break of the H4 trend line support unlocks the possibility of fresh breakout setups, targeting the aforementioned H4 supports underlined above.
The accuracy, completeness and timeliness of the information contained on this site cannot be guaranteed. IC Markets does not warranty, guarantee or make any representations, or assume any liability regarding financial results based on the use of the information in the site.
News, views, opinions, recommendations and other information obtained from sources outside of www.icmarkets.com.au, used in this site are believed to be reliable, but we cannot guarantee their accuracy or completeness. All such information is subject to change at any time without notice. IC Markets assumes no responsibility for the content of any linked site.
The fact that such links may exist does not indicate approval or endorsement of any material contained on any linked site. IC Markets is not liable for any harm caused by the transmission, through accessing the services or information on this site, of a computer virus, or other computer code or programming device that might be used to access, delete, damage, disable, disrupt or otherwise impede in any manner, the operation of the site or of any user’s software, hardware, data or property.