Tuesday 7th July: Technical Outlook and Review

Key risk events today:
RBA Cash Rate and Rate Statement.
(Previous analysis as well as outside sources – italics).
EUR/USD:
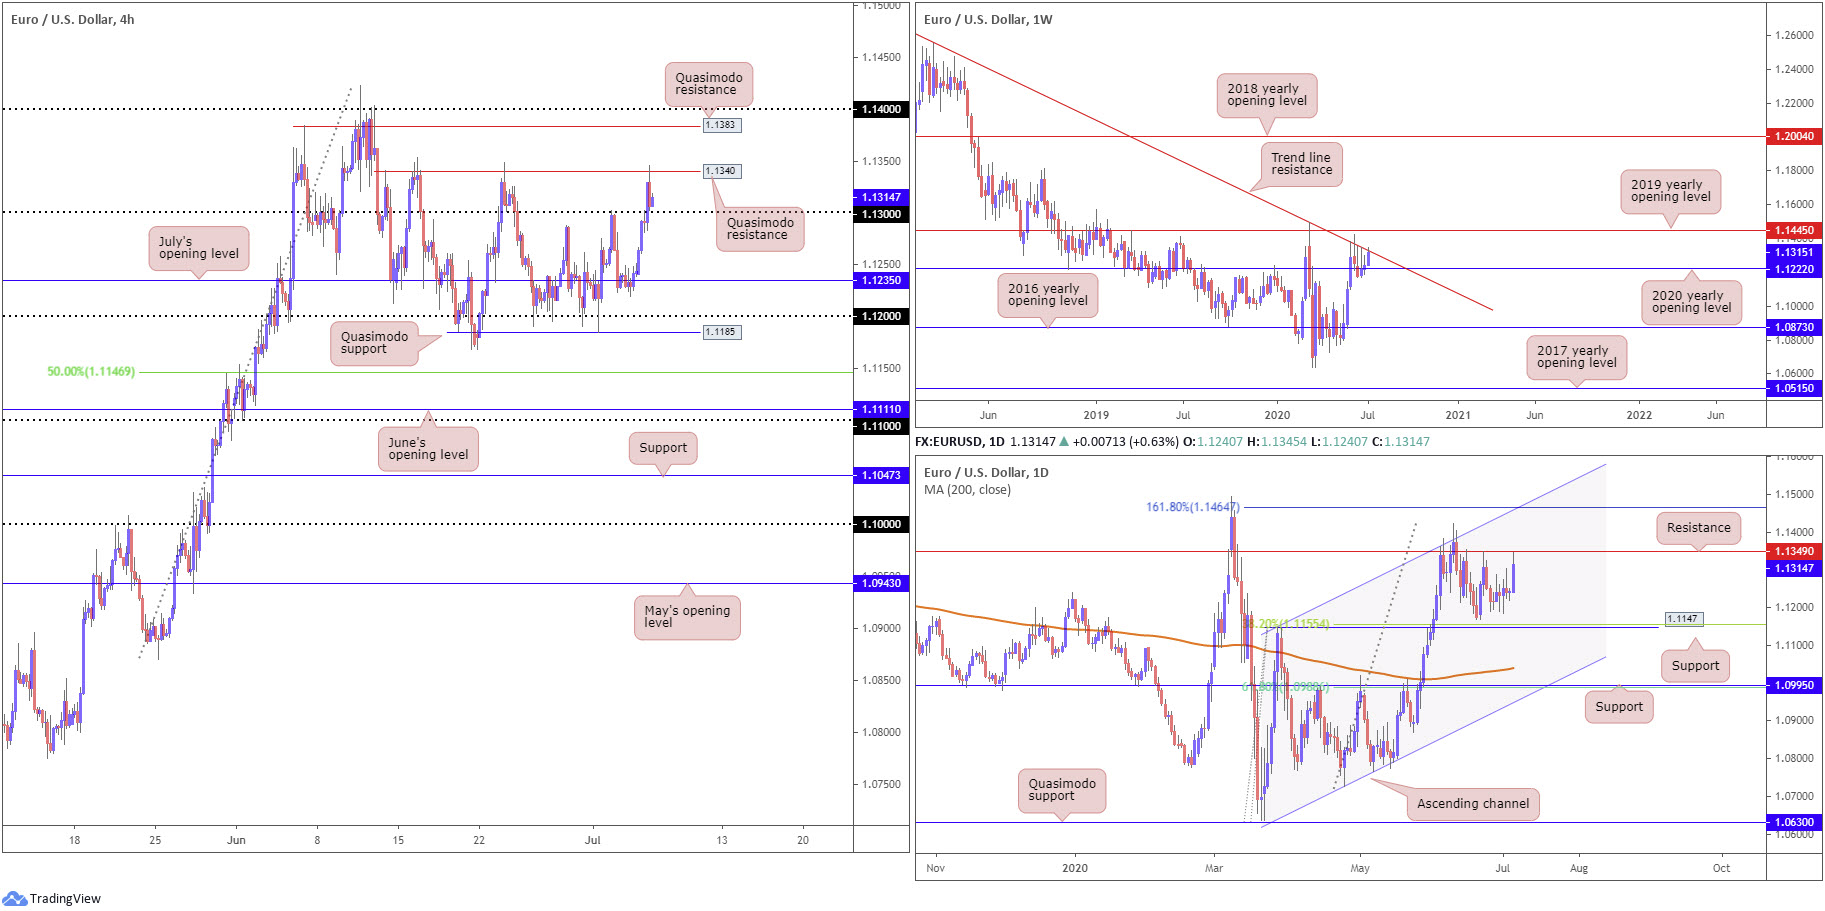
Europe’s shared currency kicked off the week on strong footing, reaching fresh pinnacles at 1.1345 against the buck.
1.13, as can be seen on the H4 timeframe, was taken and Quasimodo resistance at 1.1340 made an appearance as we moved into US hours. US ISM Non-Manufacturing PMI surprised at 57.1, easily thumping the 50.0 consensus reading, consequently weighing on EUR/USD from 1.1340. Defending the 1.13 handle today, though, may overthrow 1.1340 to clear space for an extension to another Quasimodo resistance at 1.1383, followed by the 1.14 handle. South of 1.13, traders’ crosshairs will likely be fixed back on July’s opening level at 1.1235.
Trade on the weekly timeframe is, thanks to recent upside, making progress above the 2020 yearly opening level at 1.1222, testing long-standing trend line resistance, taken from the high 1.2555. Further buying here shifts focus to the possibility of reaching the 2019 yearly opening level at 1.1445.
Since the beginning of June on the daily timeframe, channel resistance, extended from the high 1.1147, and resistance at 1.1349, has capped upside. Yesterday’s lift brought price action to within striking distance of the aforementioned resistance. Breaking this level points to a 161.8% Fibonacci extension point at 1.1464, while a decisive rejection, assuming we overrun the 1.1168 June 22 low, has support from the 1.1147 27 March high in view, a level that merges closely with a 38.2% Fibonacci retracement ratio at 1.1155.
Areas of consideration:
For those who read Monday’s technical briefing you may recall the following piece (italics):
Breaching 1.13 to the upside, on the other hand, exposes H4 Quasimodo resistance at 1.1340. This level, given the test on June 23 likely consuming much of the barrier’s liquidity, is possibly brittle. Consequently, should trade establish a presence north of 1.13 this week, long positions may be favourable, targeting H4 Quasimodo resistance at 1.1383 and 1.14.
As a result of recent movement on the H4 and uninspiring selling pressure under weekly trend line resistance, long positions around 1.13 appear favourable today, targeting daily resistance at 1.1349 as an initial point, followed by the H4 resistances highlighted above (bold).
GBP/USD:
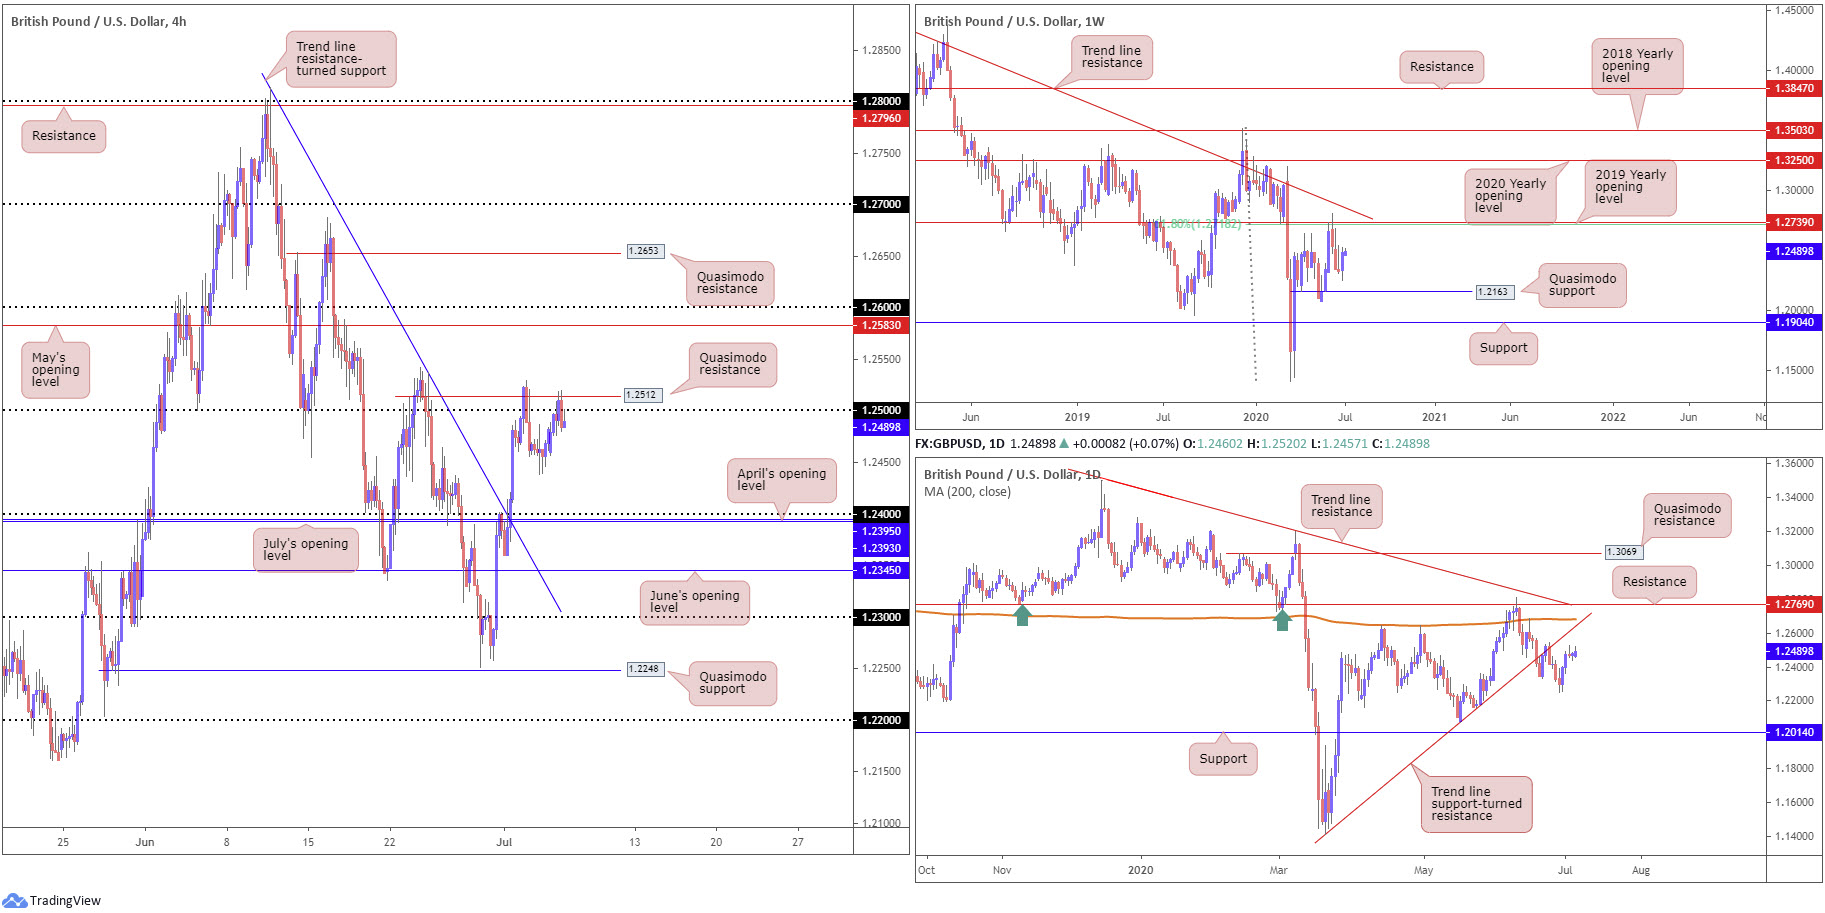
It was a reasonably mellow start to the week for GBP/USD, ranging between 1.2520/1.2457.
Price action on the H4 timeframe try to pass 1.25 to the upside, but similar to last week failed to sustain gains above Quasimodo resistance at 1.2512. The retreat from the latter, fuelled by a stronger-than-anticipated US ISM Non-Manufacturing PMI print, pulled H4 candles marginally below 1.25 into the European close. As highlighted in Monday’s technical briefing, chart studies reveal scope to explore lower levels, shining the spotlight on 1.24 and April and July’s opening levels around 1.2395ish. In the event things turn higher, however, and we firmly takeover 1.25, we could be looking at May’s opening level at 1.2583/1.26 as a probable target.
GBP/USD bulls went on the offensive last week and pencilled in healthy upside. With respect to structure on the weekly timeframe, support resides at 1.2163, a Quasimodo formation. Follow-through buying, nevertheless, may eventually see price shake hands with a 61.8% Fibonacci retracement ratio at 1.2718 and 2019 yearly opening level at 1.2739.
Price movement on the daily timeframe, meanwhile, trades somewhat indecisively around 1.2490. Resistance on this scale can be found at trend line support-turned resistance, taken from the low 1.1409. In terms of support, aside from the 1.2251 June 29 low, there appears room for an approach to 1.2014, sited just south of the 1.2075 May 18 low. Before reaching this far south, nonetheless, weekly Quasimodo support must be absorbed at 1.2163.
Areas of consideration:
Fracturing 1.25 to the upside would likely appeal to breakout buyers, in pursuit of May’s opening level at 1.2583 and 1.26. Both the weekly and daily timeframes also display scope to climb.
Selling the 1.25/H4 Quasimodo resistance at 1.2512 combination may also be of interest to some traders, given we also have room on the bigger picture to probe lower levels.
AUD/USD:
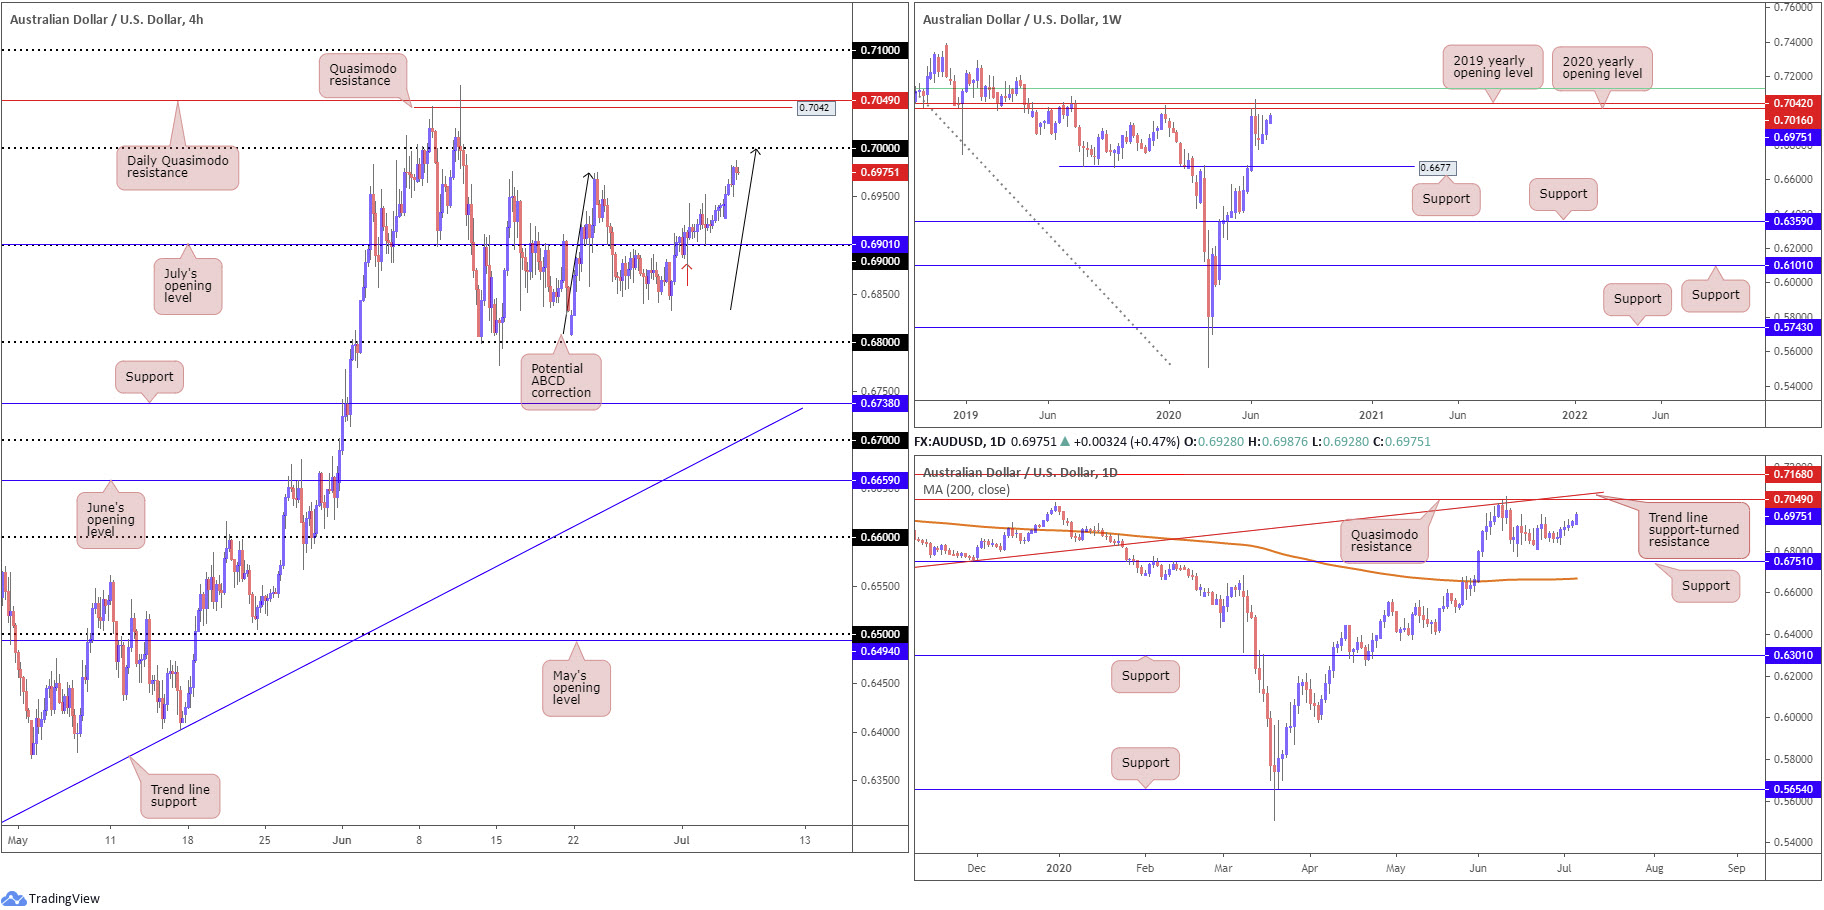
AUD/USD exhibited healthy upside Monday, lifting as far north as 0.6987. The combination of upbeat risk sentiment and a waning buck helped the pair register its sixth consecutive day in the green and overpower 0.6976 peaks on the H4 timeframe.
H4 traders now face the key figure 0.70 as resistance, accompanied by an ABCD correction (black arrows), while a break of here would expose Quasimodo resistance at 0.7042 and daily Quasimodo resistance at 0.7049.
Resistance, forged in the shape of a 2020 yearly opening level and a 2019 yearly opening level, at 0.7016 and 0.7042, respectively, continues to offer a central presence nearby on the weekly timeframe. It might also interest traders to note just above the said resistances we have a 61.8% Fibonacci retracement ratio at 0.7128 (green). In terms of support, crosshairs remain fixed on 0.6677.
From the daily timeframe, we appear poised to tackle Quasimodo resistance mentioned above at 0.7049, merging closely with trend line support-turned resistance, taken from the low 0.6670. Attention on this timeframe also remains at support coming in from 0.6751. Interestingly, lurking beneath here we also have the 200-day SMA (orange – 0.6669) located close by weekly support underlined above at 0.6677.
Areas of consideration:
Well done to any readers who managed to maintain a long position above 0.69/July’s opening level at 0.6901; this was a noted setup to watch in previous analysis.
Going forward, the key observation on the H4 timeframe is the 0.70 figure and its converging ABCD correction. Not only is the round number a key base, it also comes with weekly resistance at 0.7016, the 2020 yearly opening level. Traders, therefore, are likely expecting a response to form here, marking a potential reversal zone for sellers and a take-profit target for longs north of 0.69.
USD/JPY:
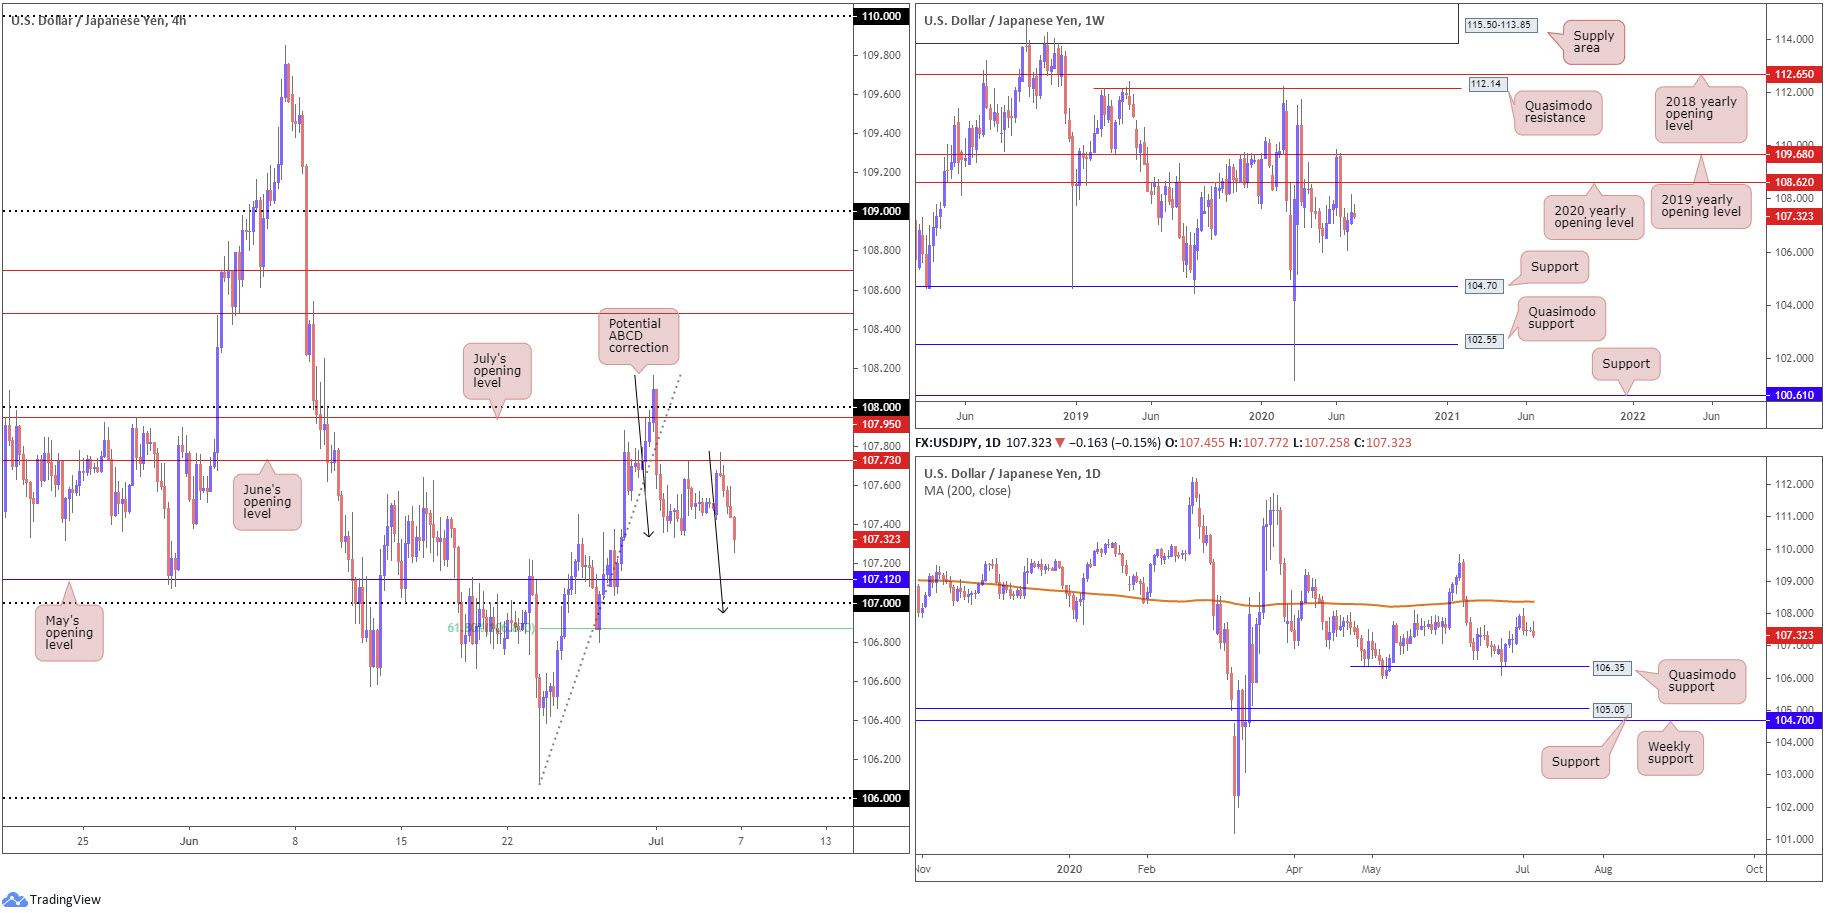
Despite US equity indexes advancing across the board Monday, the USD/JPY declined in line with the DXY, dipping from June’s opening level at 107.73 on the H4 timeframe. Eyes are now fixed on May’s opening level at 107.12, the 107 handle, a potential ABCD correction and a 61.8% Fibonacci retracement ratio at 106.87.
Resistance rests reasonably close by on the weekly timeframe in the shape of the 2020 yearly opening level at 108.62, followed by the 2019 yearly opening level at 109.68. Support remains fixed around the 105.98 6th May low, with a break here uncovering long-term support at 104.70.
Last week pencilled in a top a few pips shy of the 200-day SMA (orange – 108.37), shaped by way of a bearish outside day. The recent top (and candle formation) draws attention back to daily Quasimodo support at 106.35, the origin of the recent leg higher.
Areas of consideration:
For those who read Monday’s technical briefing you may recall the following piece (italics):
Sellers south of 107.73 on the H4, given the recent daily bearish outside day, may take aim at 107.12/107 this week, offering reasonable risk/reward.
As you can see, price movement is in the process of making a move to 107.12/107, as we write.
In addition to the above, intraday traders will also be watching the 107 vicinity as a possible reversal zone, even more so knowing we now have a potential ABCD correction terminating here and a nearby 61.8% Fibonacci retracement ratio at 106.87.
USD/CAD:
The US dollar concluded Monday pretty much unchanged against the Canadian dollar, as the latter failed to benefit from higher oil prices.
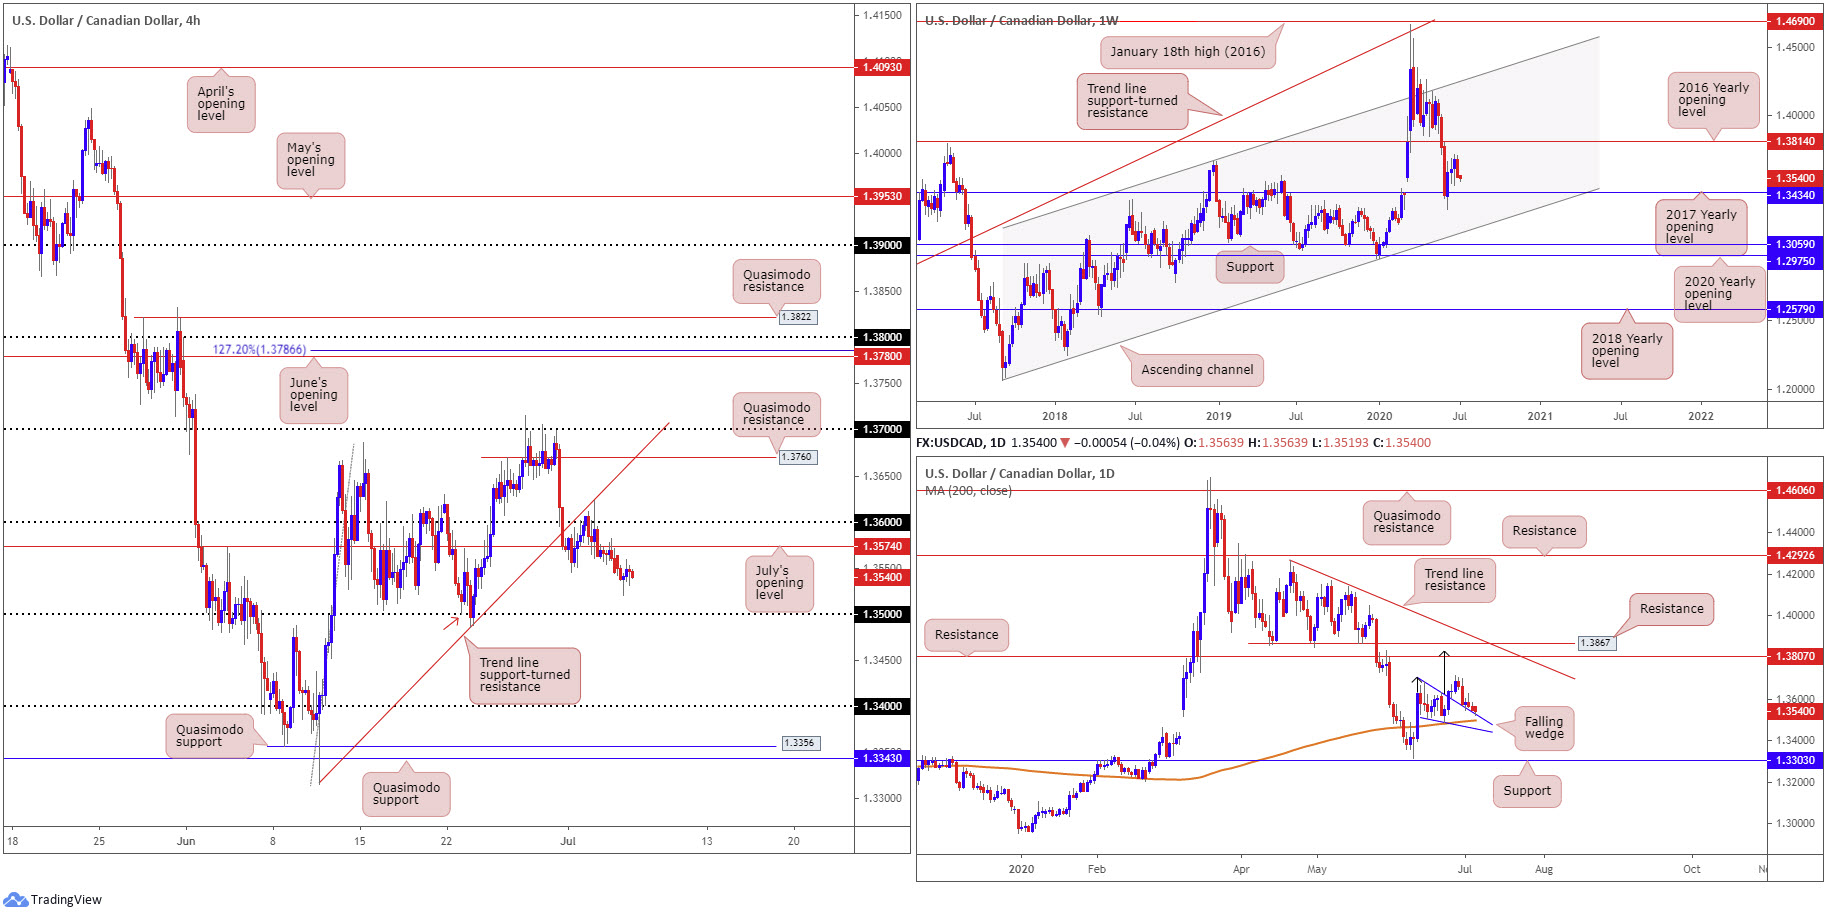
July’s opening level drawn from 1.3574 continues to serve as resistance on the H4 timeframe. An extension to the downside shifts attention to the 1.35 handle, which happens to also offer Quasimodo support (red arrow – left shoulder).
On the weekly timeframe, last week’s action positions the 2017 yearly opening level at 1.3434 in the firing range. Beyond 1.3434, channel support, taken from the low 1.2061, can be seen as the next potential floor. While a USD/CAD bid throws the 2016 yearly opening level at 1.3814 in the pot as feasible resistance, with follow-through buying likely to try and tackle a dense block of supply between 1.4190/1.3912.
Movement on the daily timeframe continues to retest the top edge of a breached falling wedge pattern as support (1.3686/1.3504) – so far sellers have outweighed buyers. Interestingly, the 200-day SMA (1.3496), seen closing in on the level, may lend a helping hand here, in terms of additional support. Take-profit targets out of a falling wedge pattern can be measured by taking the base value and adding this figure to the breakout point (black arrows), which as you can see in this case, converges closely with the next daily resistance at 1.3807, followed closely by another layer of resistance at 1.3867.
Areas of consideration:
Usually the higher timeframes (daily structure) take precedence over lower-timeframe levels (H4 structure).
Yet, the H4 closing below 1.3550 has perhaps put forward the possibility of a run to 1.35. As a result, intraday sellers may try their hand and sell short.
1.35 is an interesting support. Not only does the number represent a downside target for those short, it also signifies confluent support, joined closely with the 200-day SMA at 1.3495 and the top edge of the daily wedge formation.
USD/CHF:
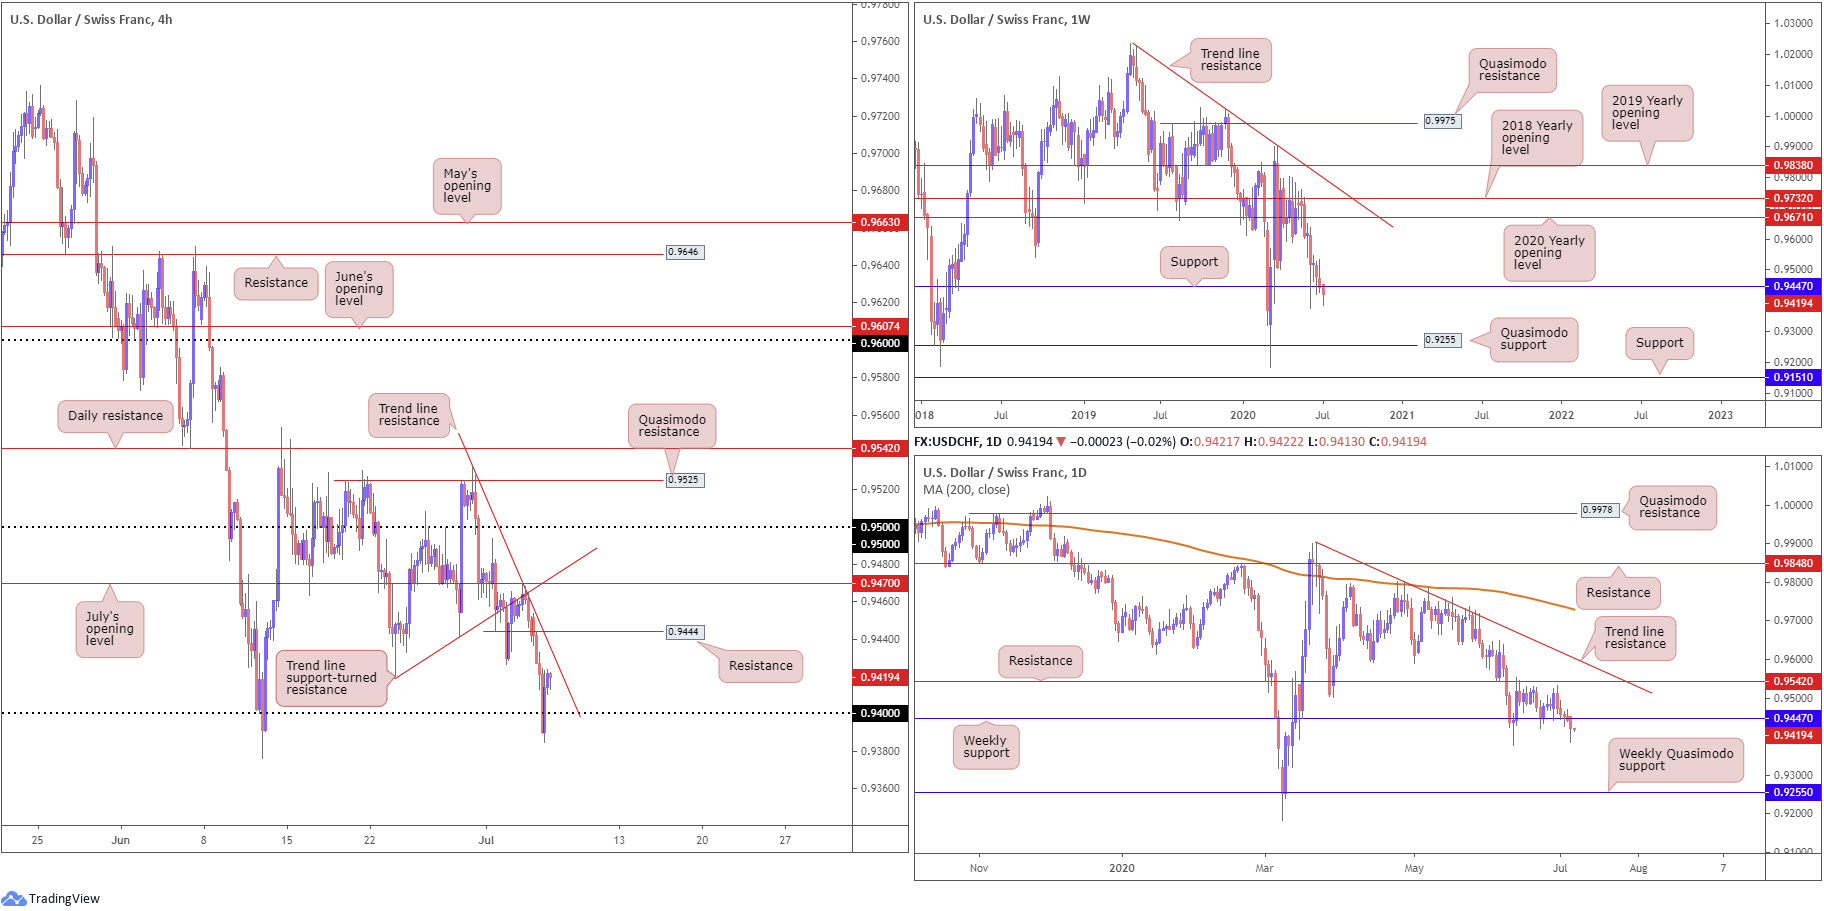
Weekly support at 0.9447 came under pressure on Monday, with price action delivering a blow to lows at 0.9384. Additional losses could have the unit eventually knock on the door of Quasimodo support at 0.9255. A recovery, on the other hand, has the 2020 yearly opening level at 0.9671 marked as the next resistance target, stationed close by the 2018 yearly opening level at 0.9732. The story on the daily timeframe reveals price action closed under the aforementioned weekly support in recent trading, also unlocking the possibility of an approach towards the weekly Quasimodo support mentioned above at 0.9255.
Interestingly, on the H4 timeframe traders witnessed a whipsaw through 0.94, similar to that seen on June 11. Trend line resistance, extended from the high 0.9533, is seen as the next upside objective; a break here could lure buyers into the fight, though nearby resistance at 0.9444 is likely to be problematic.
Areas of consideration:
Sellers appear to be strengthening their grip at the moment, with intraday traders likely honing in on H4 trendline resistance and H4 resistance at 0.9444 as possible reversal zones. Ultimately, traders will be watching for H4 to establish ground under 0.94, targeting Quasimodo support at 0.9324.
Dow Jones Industrial Average:
US equity indexes rose sharply across the board Monday, as upbeat sentiment out of China flowed into global markets. The Dow Jones Industrial Average rallied 459.67 points, or 1.78%; the S&P 500 advanced 49.71 points, or 1.59%, and the tech-heavy Nasdaq 100 concluded higher by 262.17 points, or 2.53%.
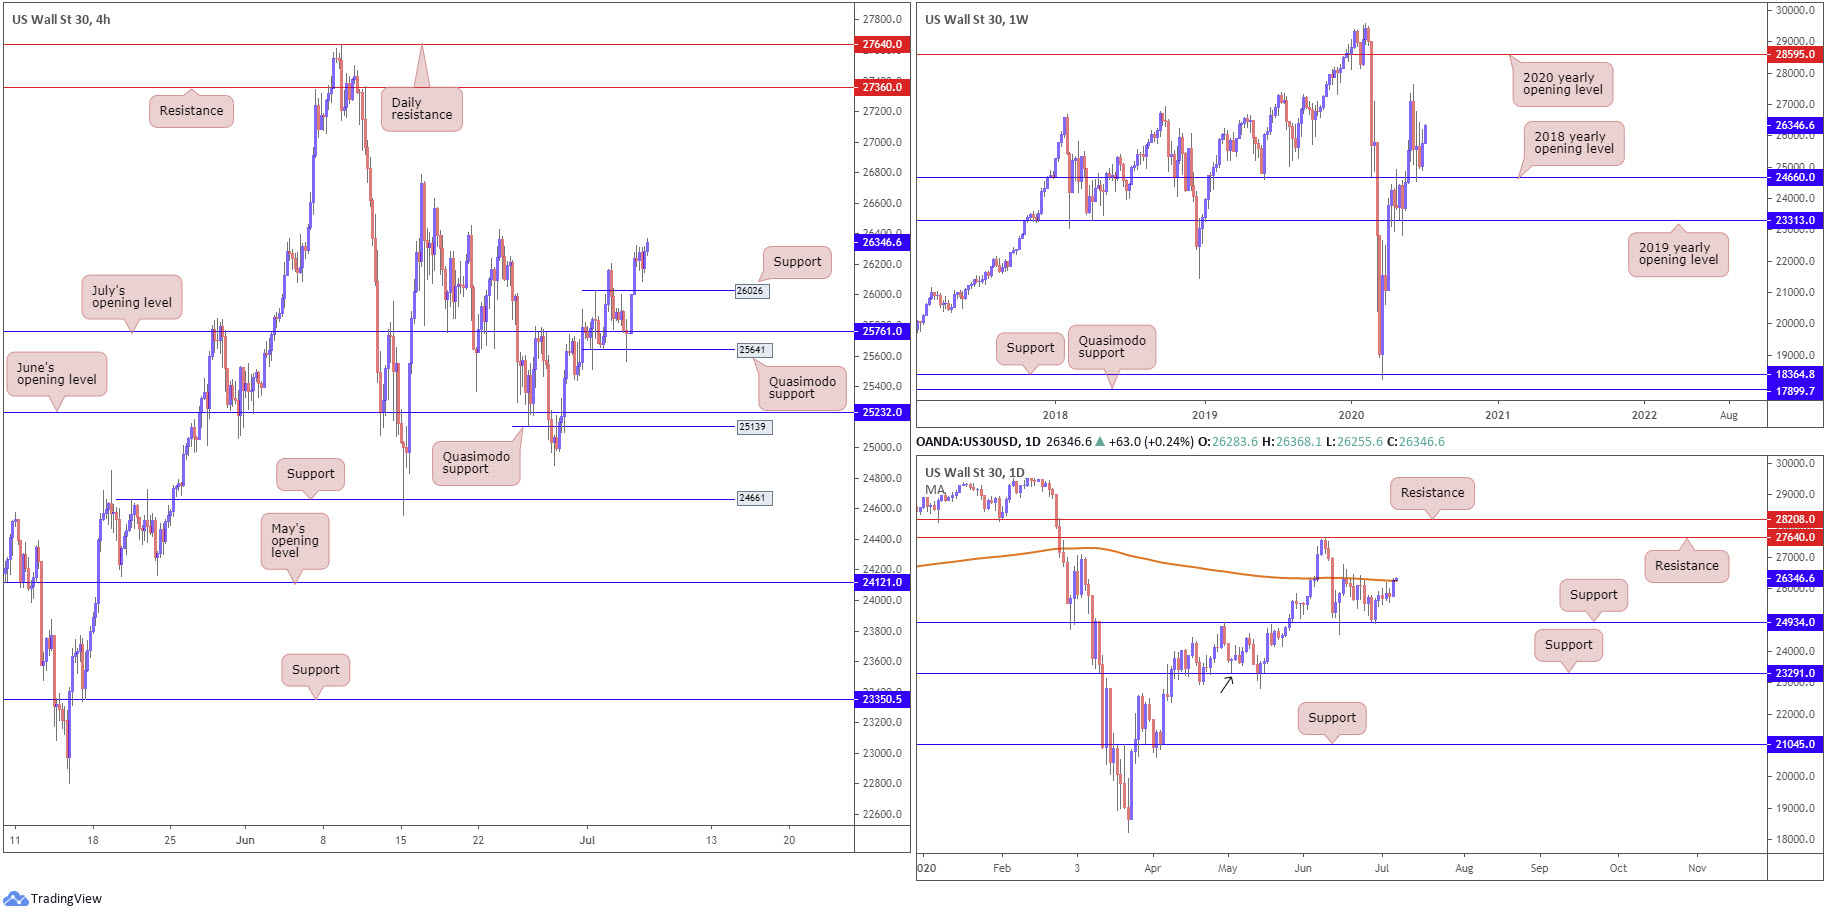
The 2018 yearly opening level at 24660 remains an important base of support on the weekly timeframe, as price action continues to make progress north of the level. In the event buyers manage to keep their head above water here, we might pull in the 27638 high, followed by the 2020 yearly opening level at 28595.
Since June 15, price action on the daily timeframe has been ranging between the 200-day SMA (orange – 26257) and support from 24934. As evident from the chart, yesterday’s rally has the unit shaking hands with the said SMA value. A break today not only confirms upside strength on the weekly timeframe, it shines the spotlight on daily resistance from 27640.
Across the page on the H4 timeframe, aside from possible resistance emerging from the 26435ish peaks, we could be heading for the 26787 June 16 high, followed by resistance plotted at 27360.
Areas of consideration:
The fact daily price is testing its 200-day SMA, this may spark a retreat today and have H4 head to support at 26026, pushing across a possible buying opportunity.
A daily close above the noted 200-day SMA, however, may also be interpreted as a buy signal, targeting daily resistance at 27640.
XAU/USD (GOLD):
The price of gold, in $ terms, elbowed to higher territory Monday, despite global risk assets also advancing.
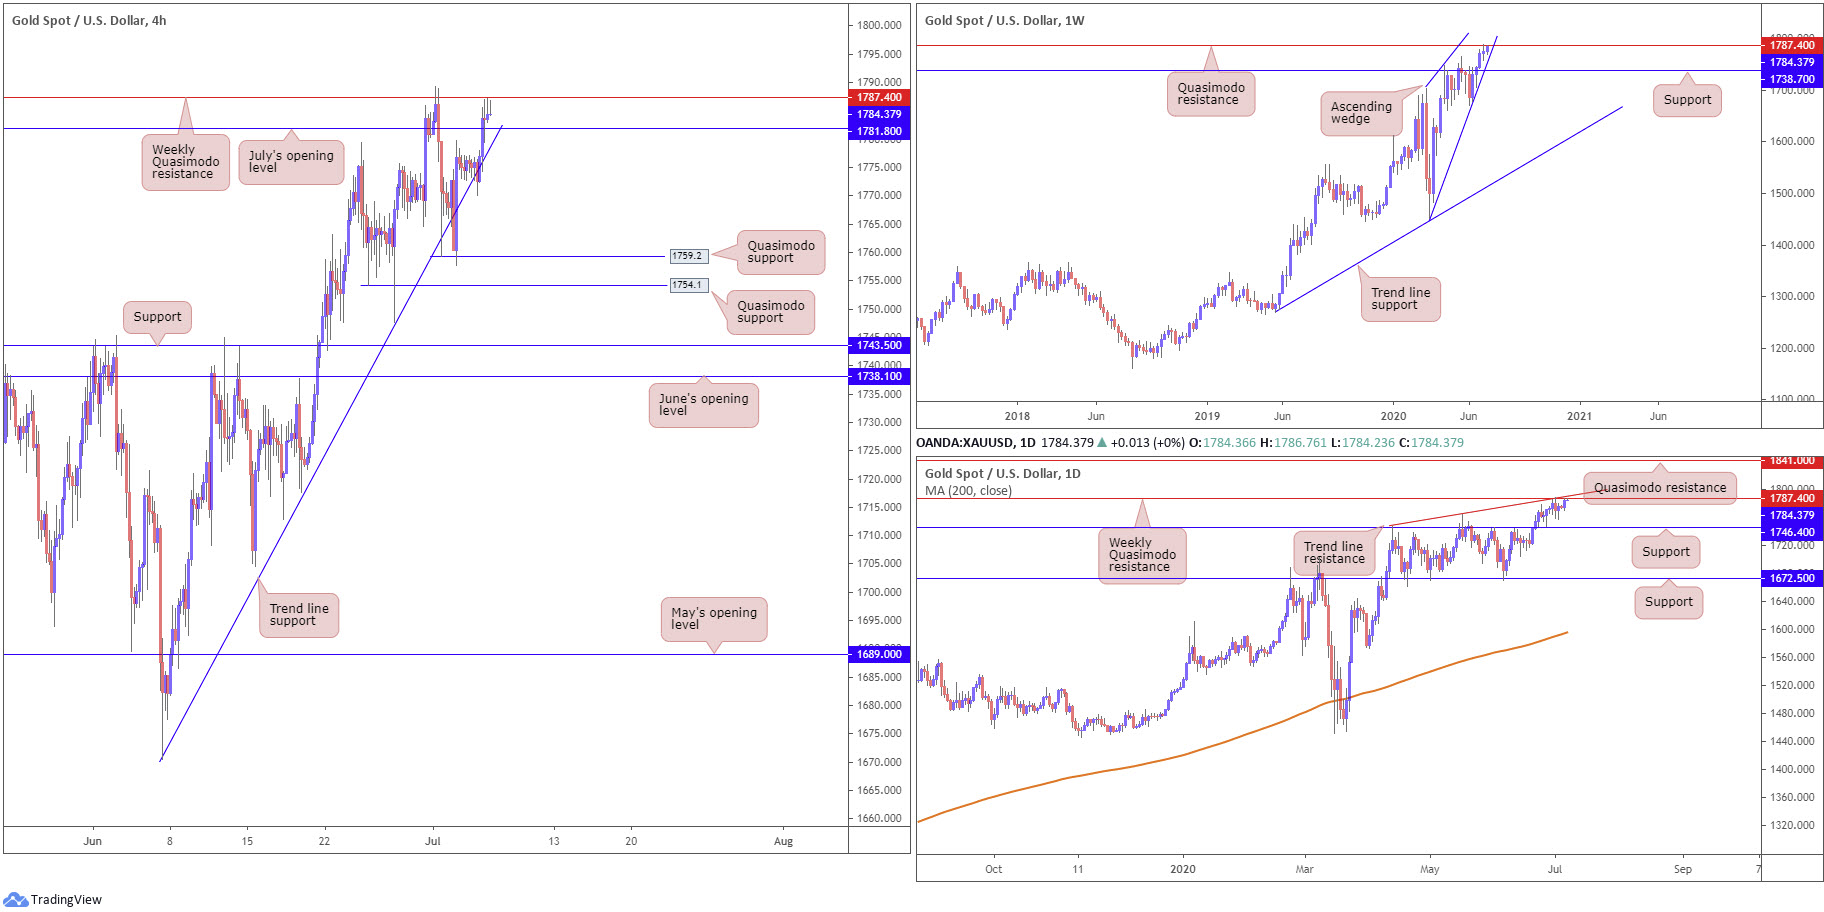
H4 trend line support, extended from the low 1679.2 has outperformed, surviving a number of downside attempts. The candles ran through July’s opening level at 1781.8 yesterday and touched gloves with weekly Quasimodo resistance at 1787.4.
Also of interest on the weekly timeframe is a potential ascending wedge pattern forming between 1451.4/1703.6. A move lower would also see buyers and sellers go toe-to-toe at support coming in from 1738.7. Breaking 1787.4, as the underlying trend suggests (trending higher since 2016), nonetheless, may lay the foundation for continuation buying to resistance stationed at 1882.7.
Weekly Quasimodo resistance at 1787.4 also remains central resistance on the daily timeframe for the time being. Daily action, nevertheless, throws across additional structure in the form of a trend line resistance, taken from the high 1747.7. Support on the daily scale can be found at 1746.4, whereas a breach of 1787.4 will throw a daily Quasimodo formation at 1841.0 in the pot as potential resistance.
Areas of consideration:
Traders short the current weekly Quasimodo resistance level, as underlined in Thursday’s writing, likely reduced risk to breakeven at H4 trend line support and maybe even banked a portion of profits. Those traders have now likely been squeezed out of the market, thanks to yesterday’s move.
A break of the current H4 trend line support and July’s opening level at 1781.8 clears the way for a possible approach to H4 Quasimodo support at 1759.2.
Conquering weekly Quasimodo resistance at 1787.4, nevertheless, could pin open the door for bullish themes this week. A H4 close above 1787.4 that’s preferably followed up with a retest might be sufficient to bait buyers into the fight. The reason for the retest, rather than entering long on the breakout candle’s close, is simply to help avoid getting caught on a fakeout.
The accuracy, completeness and timeliness of the information contained on this site cannot be guaranteed. IC Markets does not warranty, guarantee or make any representations, or assume any liability regarding financial results based on the use of the information in the site.
News, views, opinions, recommendations and other information obtained from sources outside of www.icmarkets.com.au, used in this site are believed to be reliable, but we cannot guarantee their accuracy or completeness. All such information is subject to change at any time without notice. IC Markets assumes no responsibility for the content of any linked site.
The fact that such links may exist does not indicate approval or endorsement of any material contained on any linked site. IC Markets is not liable for any harm caused by the transmission, through accessing the services or information on this site, of a computer virus, or other computer code or programming device that might be used to access, delete, damage, disable, disrupt or otherwise impede in any manner, the operation of the site or of any user’s software, hardware, data or property.