Friday 18th September: Technical Outlook and Review

Key risk events today:
UK Retail Sales m/m; Canada Retail Sales m/m; US CB Leading Index m/m; US Prelim UoM Consumer Sentiment.
(Previous analysis as well as outside sources – italics).
EUR/USD:
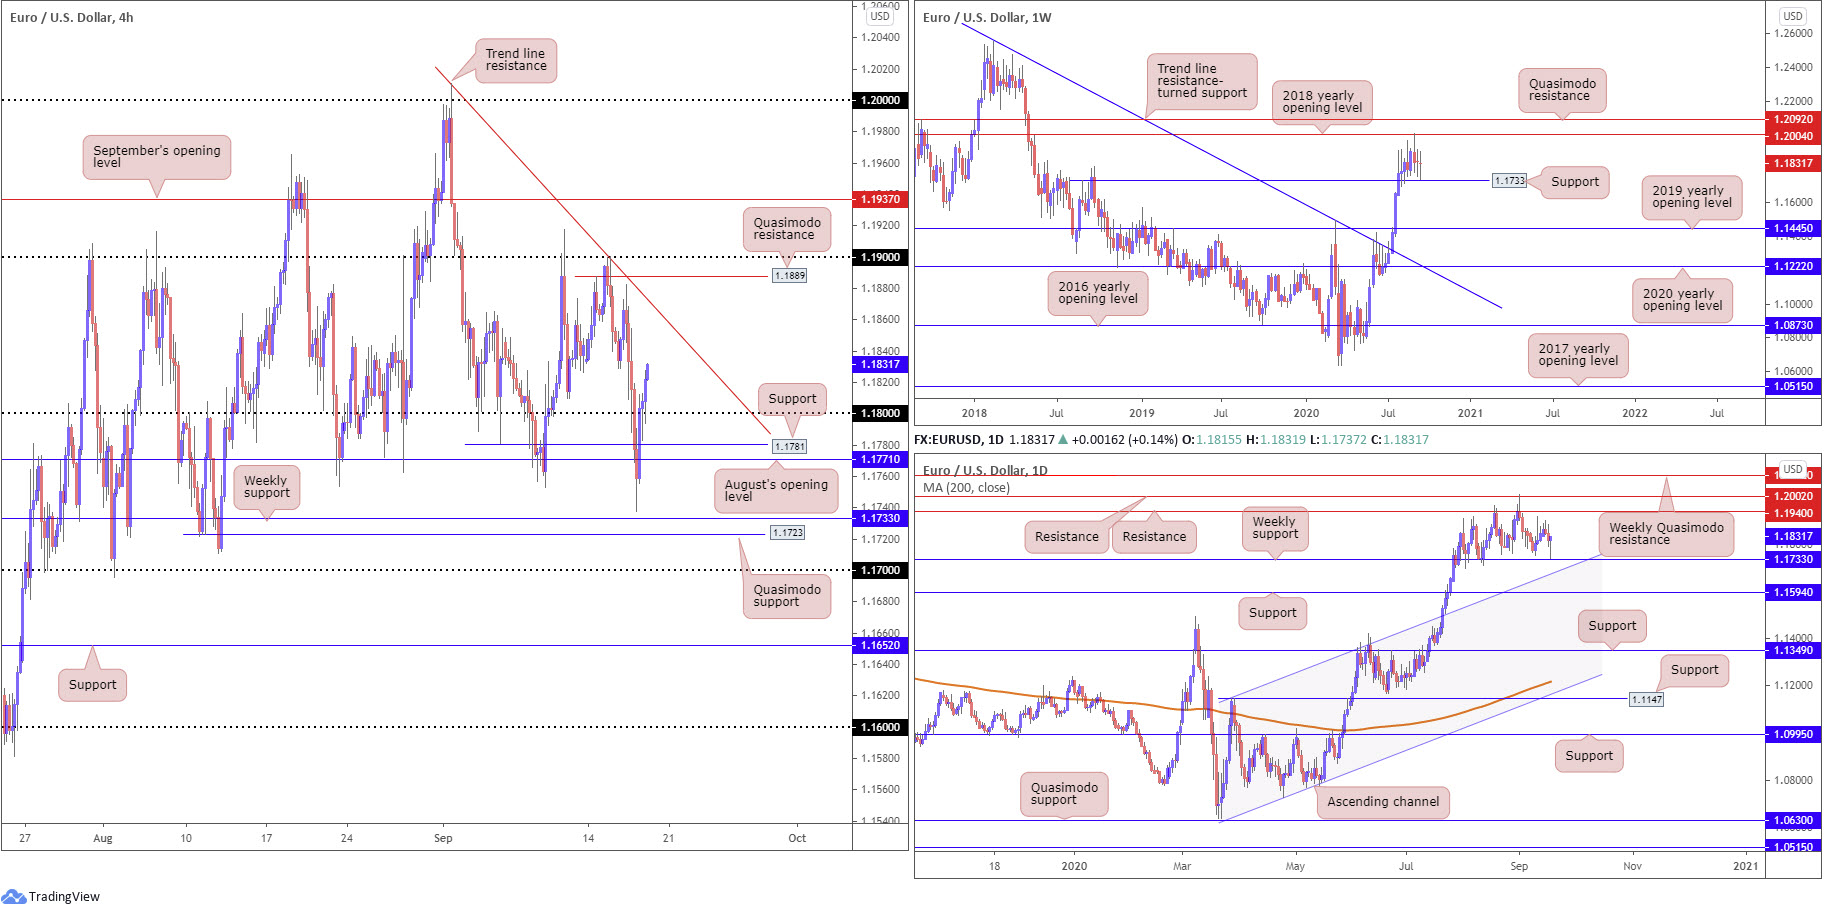
Europe’s single currency slipped through several key H4 technical supports Thursday, missing weekly support at 1.1733 by a hair before recoiling back to unchanged levels.
H4, as of current price, trades north of 1.18, with technical eyes perhaps directed towards trend line resistance, extended from the high 1.2010. Absorbing selling pressure here moves Quasimodo resistance at 1.1889 into sight, as well as the psychological band 1.19.
From the weekly timeframe, support mentioned above at 1.1733, a previous Quasimodo resistance, came within striking distance of making an appearance yesterday. Resistance on the weekly scale can be found at 1.2004, the 2018 yearly opening value sited just south of Quasimodo resistance priced in at 1.2092. Also clear on the weekly scale is the month of July witnessed vigorous upside, overthrowing trend line resistance, taken from the high 1.2555, and the 2019 yearly opening value at 1.1445.
Since transitioning into the month of August on the daily timeframe, the current weekly support has proved useful, as has daily resistance coming in at 1.1940 and 1.2002. Note yesterday’s action produced a hammer candlestick pattern a few pips ahead of the weekly support level. Passing 1.2002 on the daily timeframe shifts focus to the weekly Quasimodo resistance mentioned above at 1.2092, whereas dipping sub 1.1733 on the daily scale could see price make its way to channel resistance-turned support, extended from the high 1.1147.
Areas of consideration:
H4 Quasimodo resistance at 1.1889 may appeal to sellers. Not only does the level form a few pips south of the 1.19 handle, we’re also coming off fresh lows on the H4 scale (1.1737), proposing strength to the downside. Furthermore, stops taken from above the trend line resistance and minor swing high at 1.1882 could provide liquidity to sell (buy stops).
A retest at 1.18 today, knowing we’ve just produced a hammer candle pattern, could also be of interest, particularly if shaped in the form of a H4 bullish candlestick configuration.
GBP/USD:
For those who read Thursday’s technical briefing you may recall the piece highlighted the following (italics):
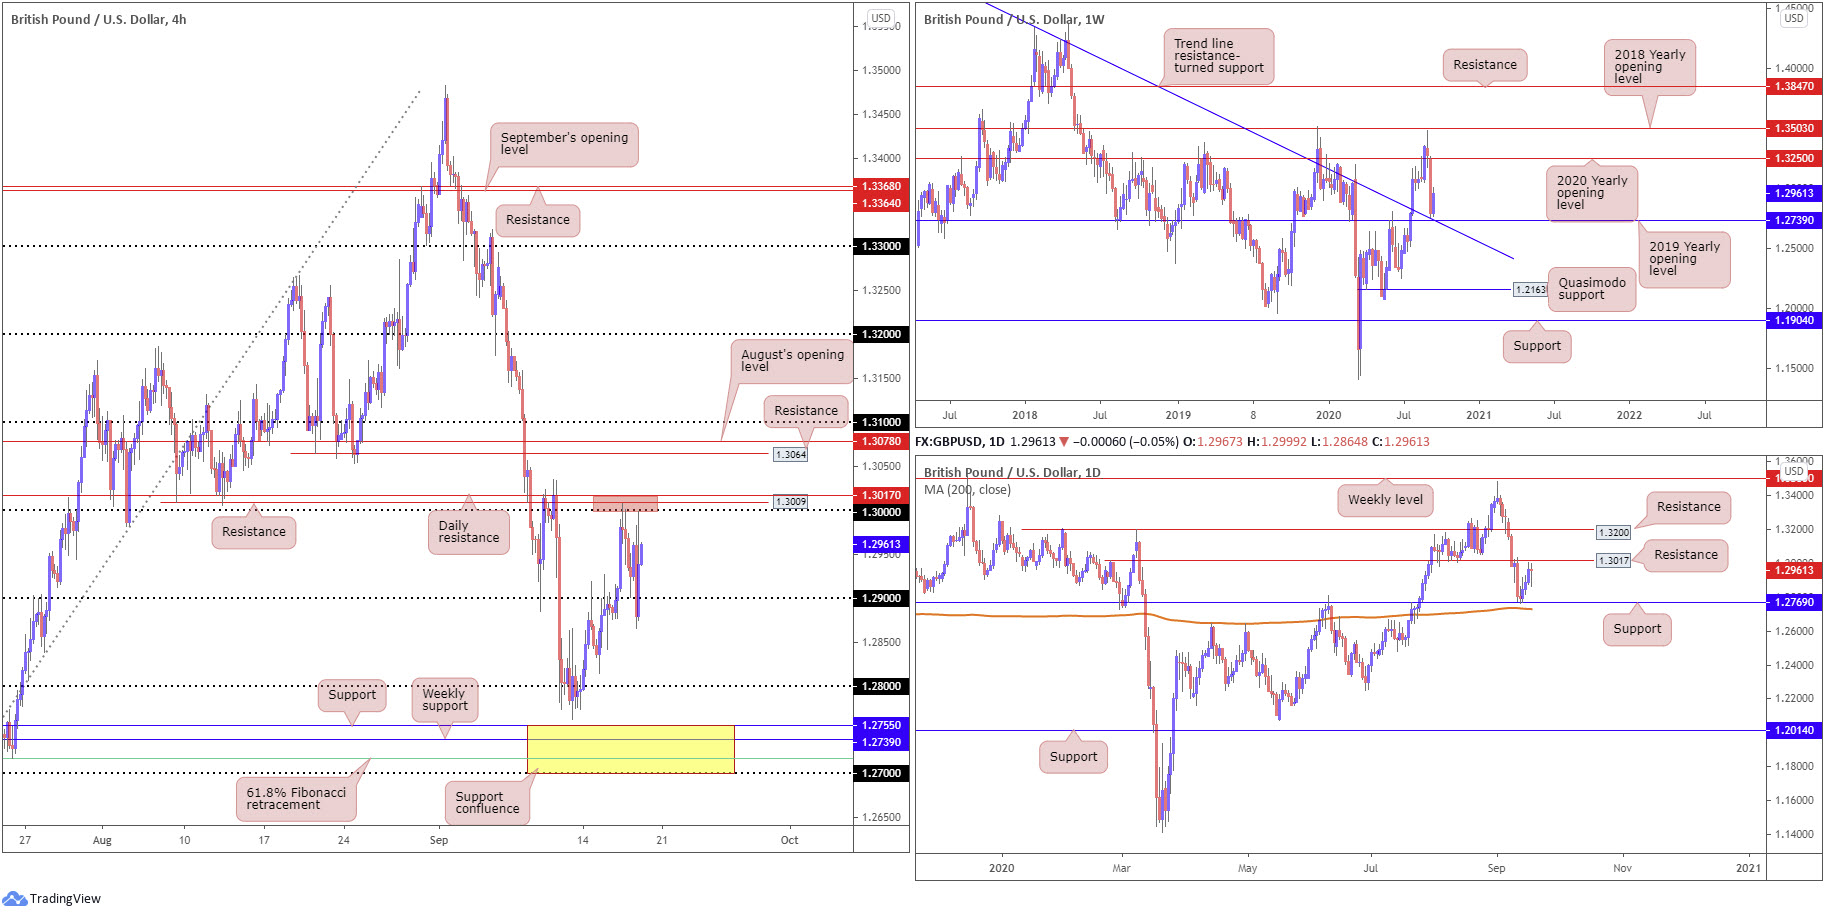
1.30 not only represents a widely watched level in this market, it comes with additional H4 resistance at 1.3009 and daily resistance seen at 1.3017.
Bearish themes could develop off 1.3017/1.30 (H4 red) today, targeting support at 1.2944 (since removed) as an initial take-profit zone. Having noted weekly price displaying promise ahead of support at 1.2739, sellers out of 1.3017/1.30 will likely reduce risk to breakeven at 1.2944 and bank partial profits. The next downside target rests around the 1.29 point (H4).
As evident from the H4 timeframe, 1.3017/1.30 held firm and had price shake hands with 1.29.
Weekly price is making a stand just north of support in the form of the 2019 yearly opening level at 1.2739 and aligning trend line resistance-turned support, extended from the high 1.5930. Technical studies project room to advance as far north as the 2020 yearly opening level at 1.3250.
From the daily timeframe, resistance mentioned above at 1.3017 is yet to be challenged. Support at 1.2769 is seen to the downside, accompanied by the 200-day SMA (orange – 1.2730). Reaching for higher territory, nevertheless, shines the spotlight on resistance around 1.3200.
Areas of consideration:
1.3017/1.30 (H4 red) could remain active Friday on account of its appealing confluence. Rupturing the zone, however, signals H4 buyers may attempt to approach resistance at 1.3064 (a prior Quasimodo support), closely shadowed by August’s opening level at 1.3078 and the 1.31 handle. This, of course, is in line with weekly structure.
AUD/USD:
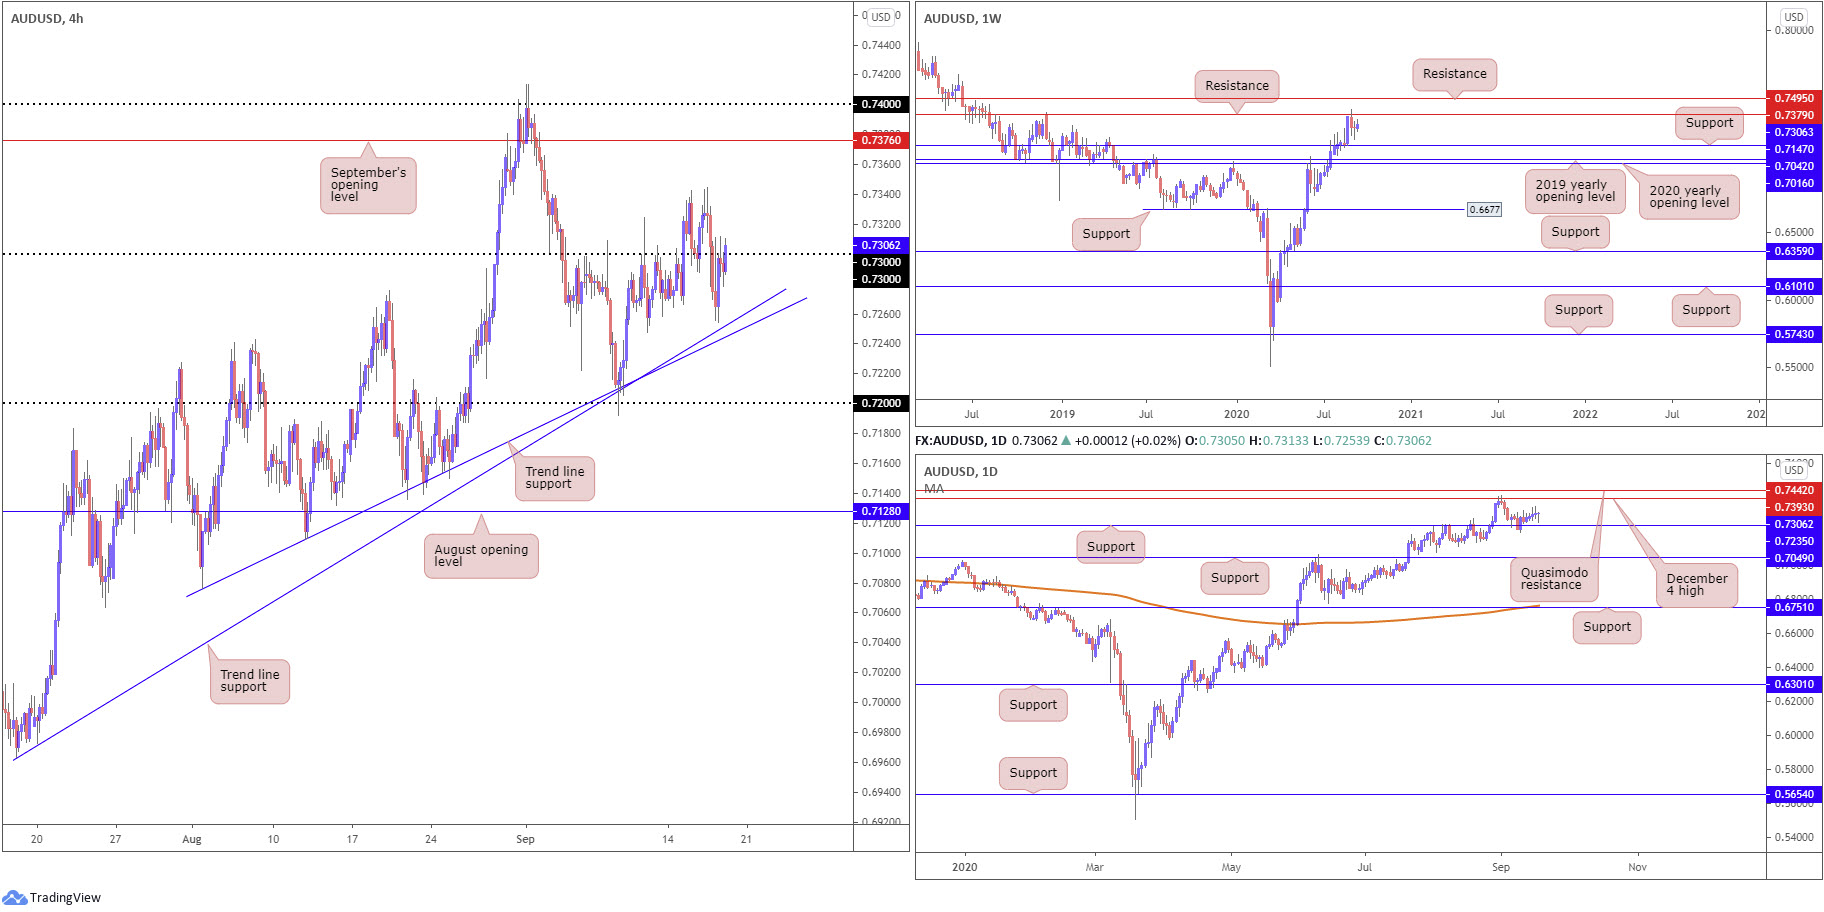
Thursday had AUD/USD finish significantly off session lows to close the day unchanged.
As of current price, H4 is attempting to reclaim 0.73 to the upside after coming within a few pips of testing two trend line supports, taken from the lows 0.6963/0.7076. Aside from peaks around 0.7342, September’s opening level at 0.7376 can be seen as the next obvious resistance, followed by weekly resistance at 0.7379 along with daily resistance (Dec 4 high) from 0.7393, and then 0.74 (H4).
The weekly timeframe’s picture (unchanged):
Sellers south of resistance at 0.7379 failed to sustain downside momentum past 0.7191 in recent trading, leaving nearby support from 0.7147 unchallenged. Having seen this market trend higher since bottoming at 0.5506 in late March, the odds of price surging through current resistance and heading for another layer of resistance at 0.7495 are high. Exploring territory under current support, however, shines focus on the 2020 and 2019 yearly opening levels at 0.7016 and 0.7042, respectively.
The daily timeframe (unchanged):
Price has so far gleaned moderate support from 0.7235. Resistance at 0.7393 (December 4 high) commands attention in the event further bidding develops, a level that capped upside heading into September ahead of Quasimodo resistance at 0.7442. Overthrowing 0.7235 shifts attention to as far south as support at 0.7049.
Areas of consideration:
A decisive H4 close above 0.73 could reignite buying interest, targeting resistances underlined in bold.
Should buyers fail to overthrow 0.73, the two H4 aforementioned trend line supports could offer a floor, given the reasonably close relationship they have with daily support at 0.7235.
USD/JPY:
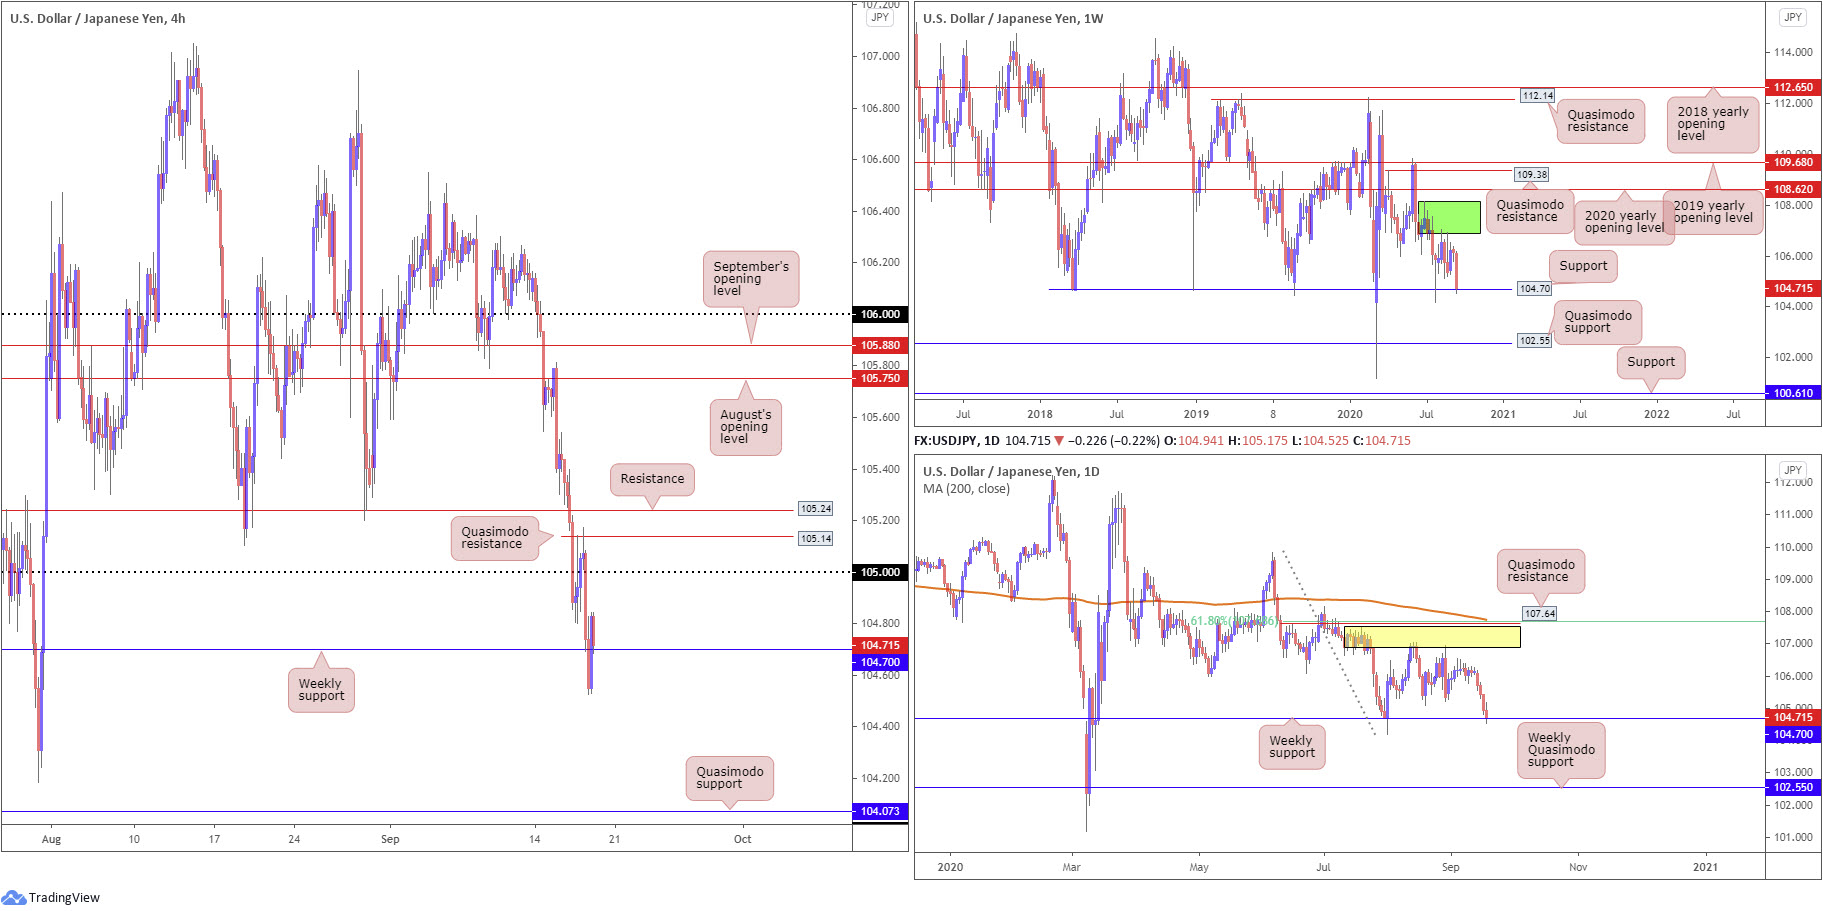
Risk aversion, coupled with the US dollar index prodding back under 93.00, weighed on USD/JPY Thursday. Processing a fourth consecutive daily decline, price action shook hands with weekly support coming in at 104.70.
Breaching the latter potentially clears higher timeframe flow to as far south as a weekly Quasimodo support level at 102.55. On the H4, however, we can see beyond the 104.18 July 31 low Quasimodo support lies at 104.07, sited just north of the 104 handle.
Areas of consideration:
The current weekly support boasts a noteworthy history.
From the weekly timeframe, you’ll note the level has capped downside since April 2018. For that reason, although sellers have exhibited a dominant existence this week, buyers could retaliate from the weekly base and approach 105 on the H4 as an initial resistance.
Yet, any sustained move under 104.70 is likely to activate another wave of selling, taking aim at the 104ish neighbourhood and, according to the higher timeframes, potentially 102.55 support on the weekly chart.
USD/CAD:
For those who read Thursday’s technical briefing you may recall the following (italics):
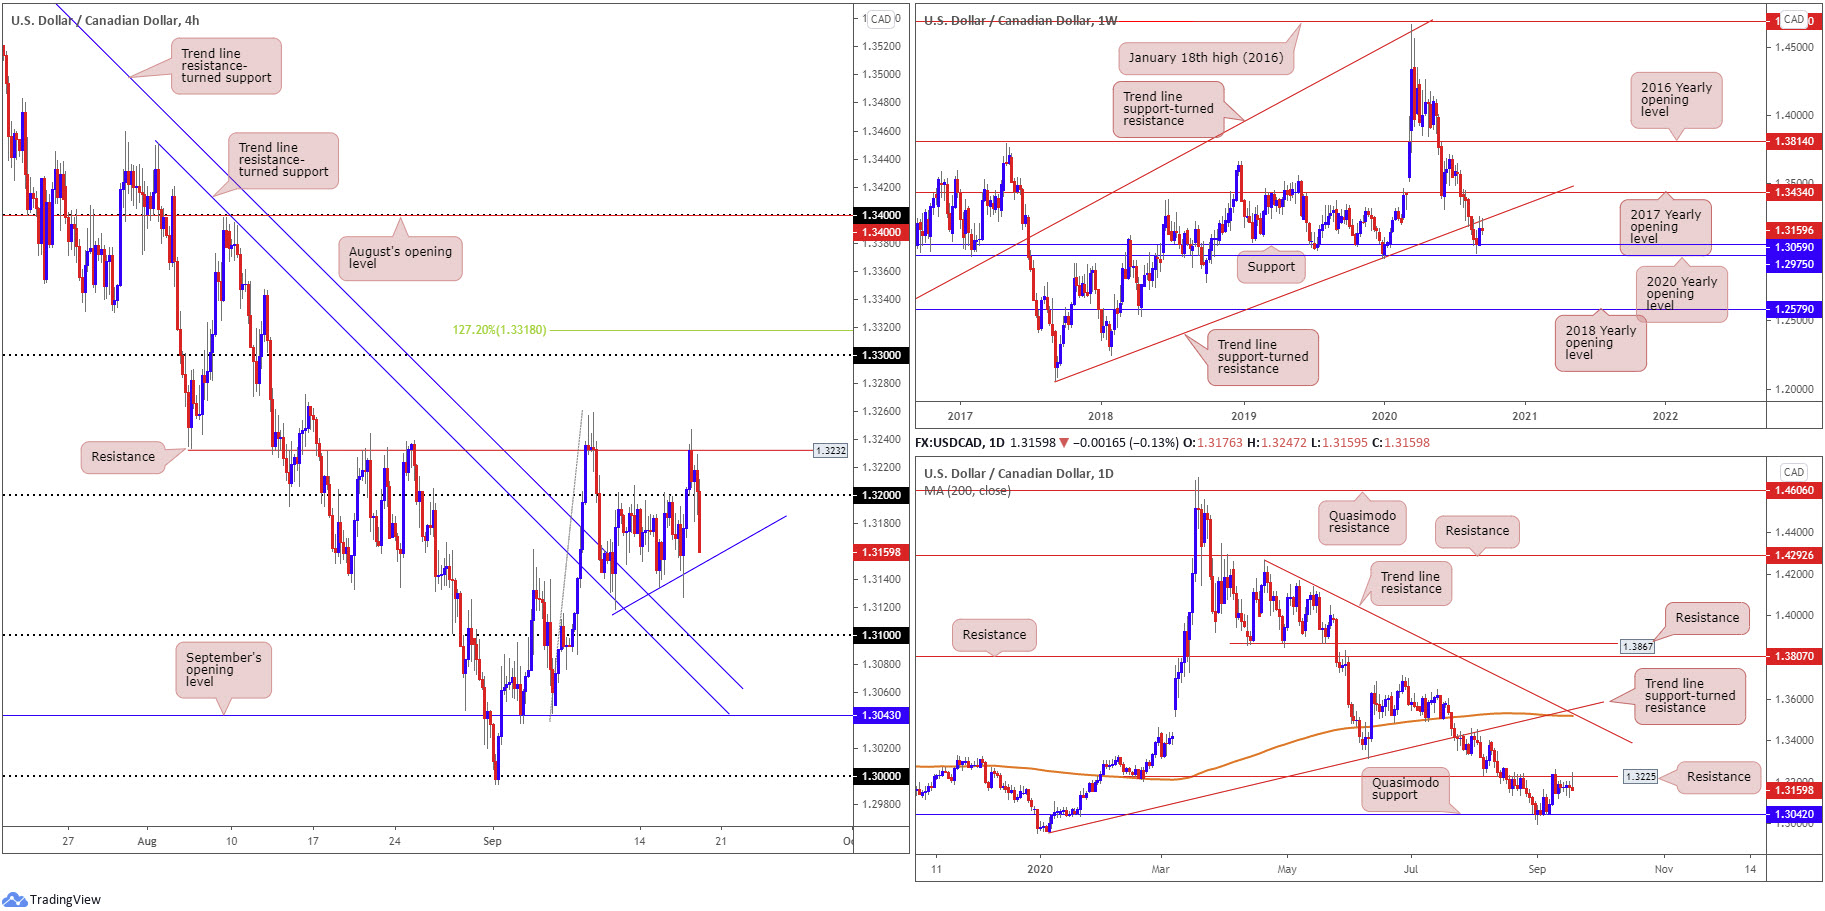
Seeking bullish scenarios above 1.32 on the H4 could prove frustrating, hindered by daily resistance from 1.3225 and H4 resistance at 1.3232. A sell-off from 1.3232/1.32, therefore, could EVENTUALLY take hold, bolstered by weekly price recently engaging trend line resistance (taken from the low 1.2061) and the market trending lower since mid-March. H4 sellers may be waiting for a close to form beyond local trend line support, drawn from the low 1.3119.
Breakout buyers, as you can see, did indeed find difficulty above 1.32 yesterday, with 1.3232/1.32 establishing a formidable ceiling. With H4 candles currently exploring terrain south of 1.32, local trend line support (1.3119) is next on tap, with a break perhaps exacerbating downside, targeting 1.31.
Areas of consideration:
Weekly price coming off trend line resistance and daily retesting resistance at 1.3225 is likely to force H4 under local trend line support (1.3119) today. This movement may have current sellers pyramid their positions and is also likely to attract fresh shorts to at least 1.31.
USD/CHF:
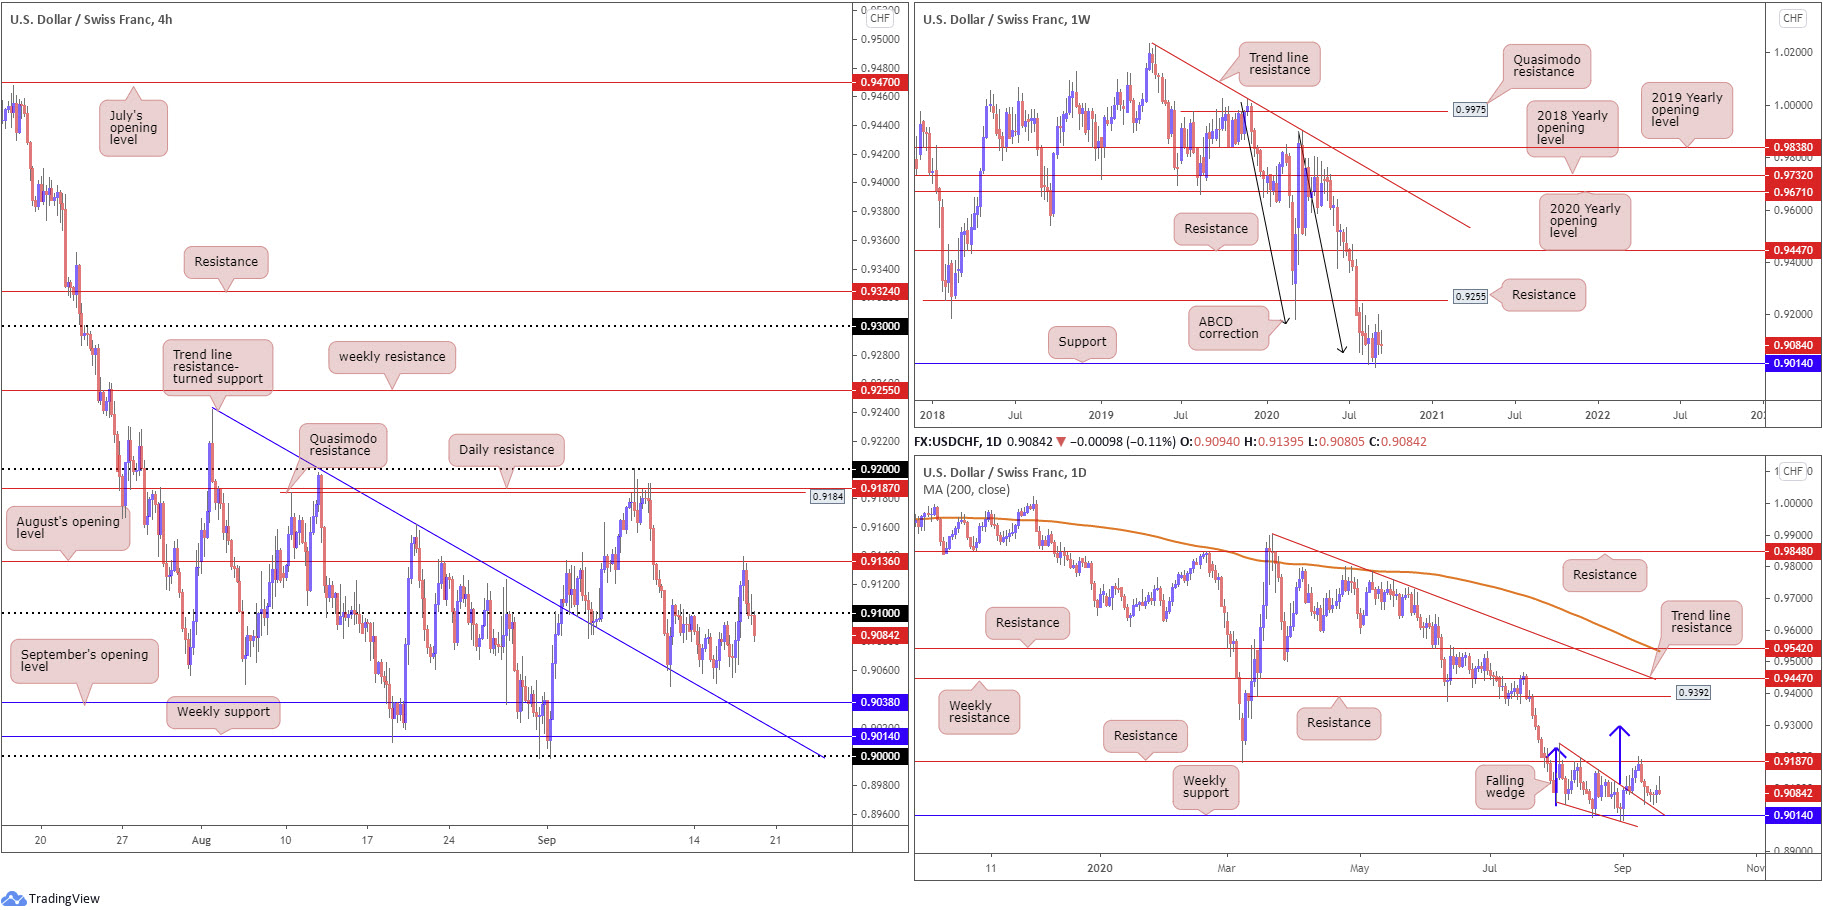
Technical movement on the weekly timeframe shows buyers and sellers continue to battle for position north of support at 0.9014, potentially gleaning additional impetus from ABCD support at 0.9051 (black arrows). Resistance at 0.9255, a previous Quasimodo support level, calls for attention should we transition north.
The month of August on the daily timeframe chalked up a falling wedge pattern from the high 0.9241 and a low of 0.9056. The beginning of September saw the upper border of the falling wedge give way, consequently unlocking a bullish reversal signal. Resistance at 0.9187 swiftly put a lid on gains, however, directing moves to just north of the falling wedge. We have since spent the majority of the week printing indecisive daily candles. Lifting from current price targets the aforementioned resistance; dips, nonetheless, brings in weekly support at 0.9014.
Early hours Thursday saw H4 tackle August’s opening value at 0.9136. Accepted by sellers, price went on to burrow through 0.91 in recent trading, threatening a test of lows around 0.9055. This is followed by September’s opening value at 0.9038 and then H4 trend line resistance-turned support (extended from the high 0.9241) as well as weekly support mentioned above at 0.9014.
Areas of consideration:
H4 dipping a toe below 0.91 signals intraday weakness and implies September’s opening value at 0.9038 could make an appearance today. Should a 0.91 retest form, this may tempt conservative sellers to enter the fight.
Longer term, the trend remains lower, though it would be unwise to overlook weekly support at 0.9051 and associated ABCD support.
Dow Jones Industrial Average:
Major US equity benchmarks tumbled Thursday, weighed by a soft labour market. The Dow Jones Industrial Average dipped 130.40 points, or 0.47%; the S&P 500 dropped 28.48 points, or 0.84% and the Nasdaq traded lower by 140.19 points, or 1.27%.
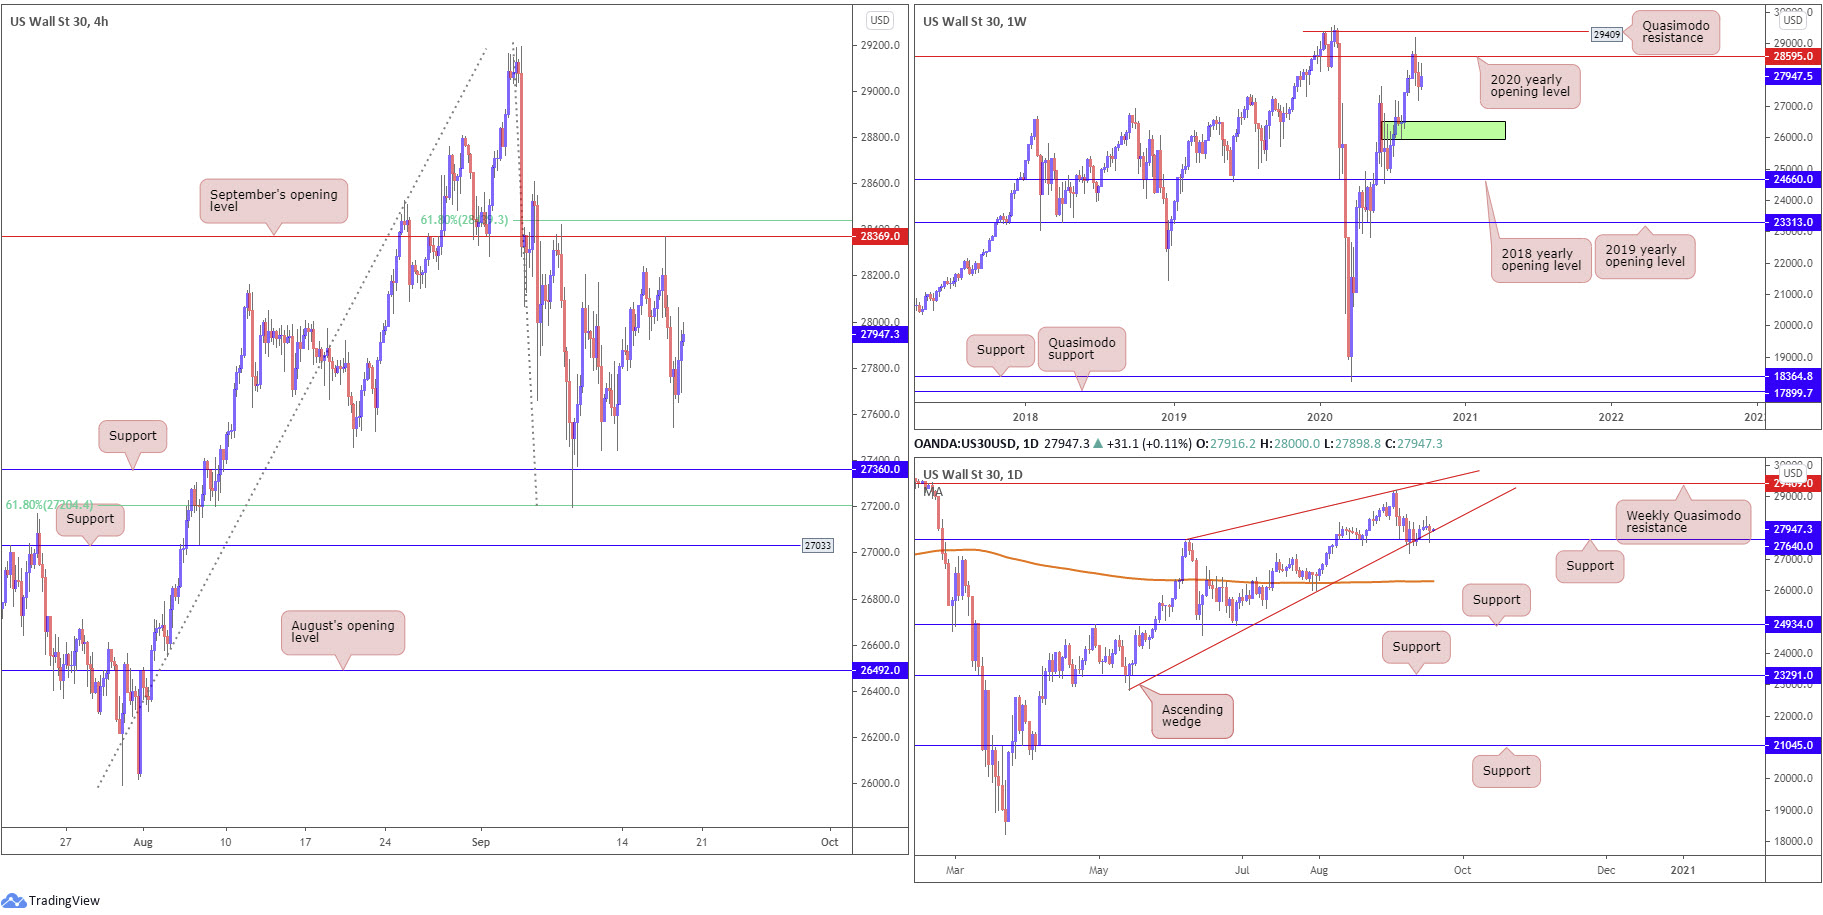
Technically, weekly shows price holding south of the 2020 yearly opening value at 28595 (sited just under Quasimodo resistance at 29409). Additional bearish sentiment advertises demand (green) at 25916-26523, an area active buyers may try and defend.
From the daily timeframe, the lower limit of an ascending wedge, taken from the low 22803, along with support from 27640, continues to bolster the unit. Technicians will also acknowledge the hammer candlestick pattern formed yesterday. Rupturing the aforementioned supports could lead to price crossing paths with the 200-day SMA (orange – 26298), while a recovery positions the 2020 yearly opening level at 28595 (weekly timeframe) in range.
Across the page on the H4 timeframe, the unit has September’s opening value at 28369 sited as resistance, joined by a 61.8% Fibonacci retracement ratio at 28436. To the downside, support can be seen at 27360, also sharing space with a 61.8% Fibonacci retracement ratio at 27204.
Areas of consideration:
- September’s opening value at 28369 on the H4 as a resistance zone.
- Support at 27360 on the H4 scale.
- Daily support at 27640 and lower limit of rising wedge. Note we also saw a daily bullish candlestick pattern form from this area yesterday, enough to perhaps entice technical buying today.
XAU/USD (GOLD):
The higher timeframe technical picture remains unchanged – here’s a reminder of where we left things in Thursday’s technical briefing (italics):
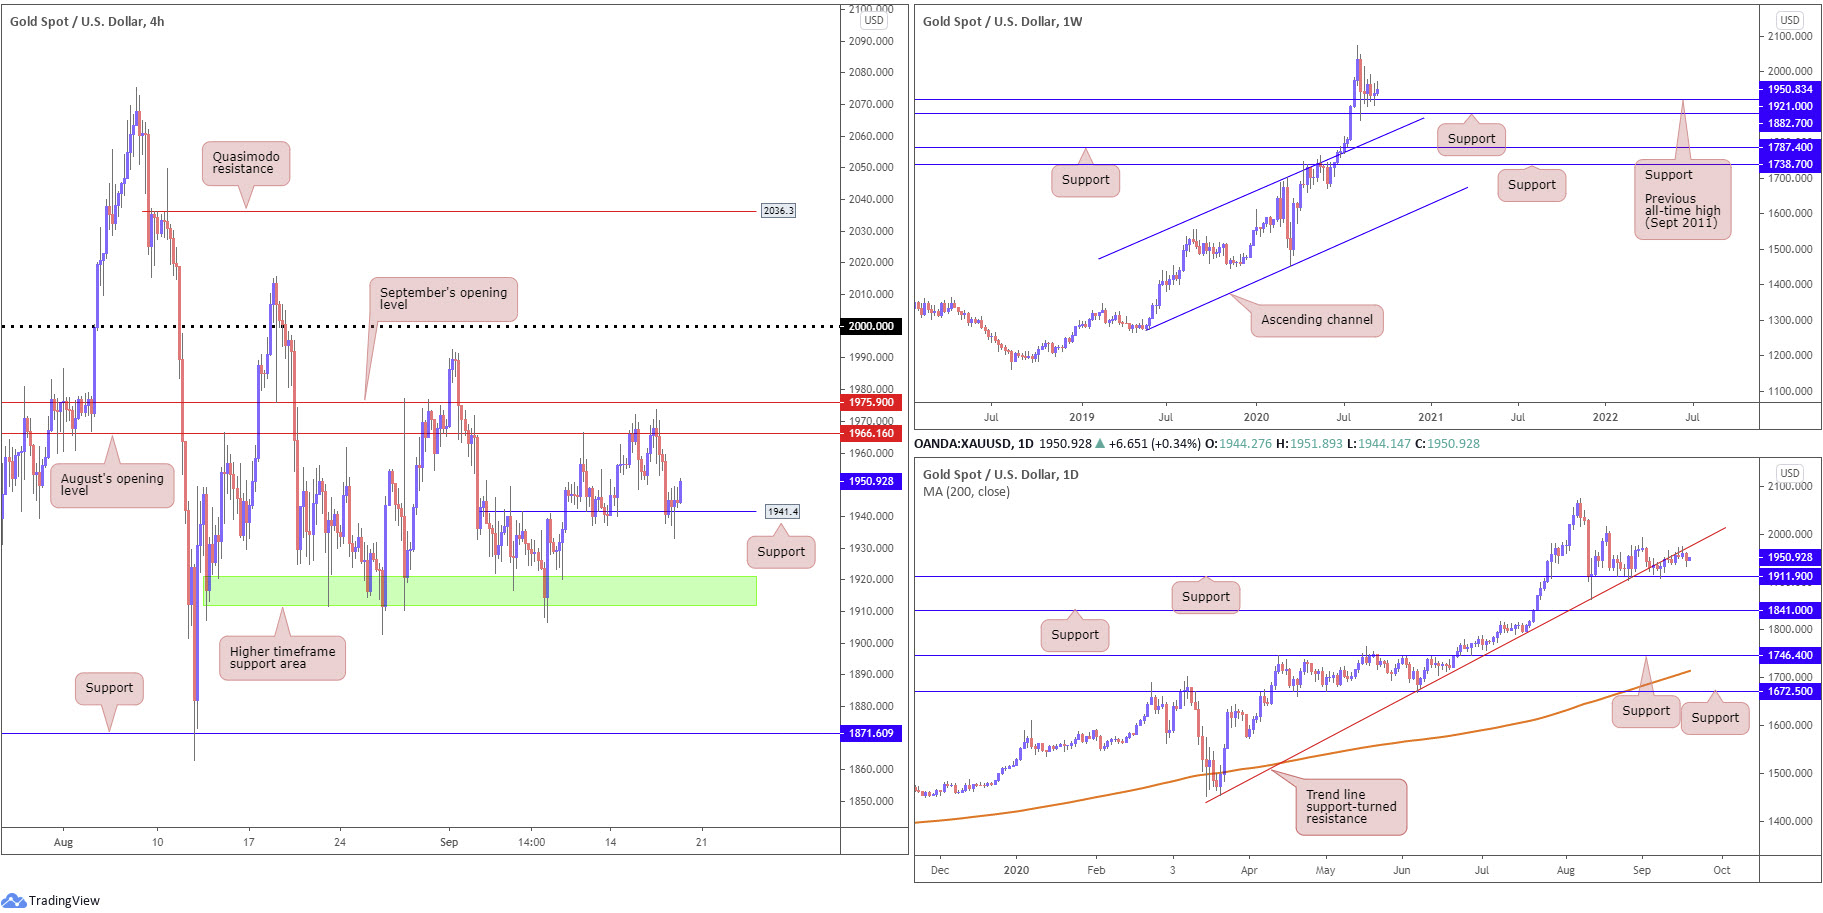
Weekly price remains buoyed by $1,921 support (located ahead of support at $1,882), the previous major all-time high (September 2011). With the current trend trekking north since 2016, the support combination between $1,882 and $1,921 may be enough to encourage additional buying, with most targeting all-time peaks at $2,075 as the initial point. Failure to hold gains could see channel resistance-turned support, etched from the high $1,703, enter view.
From the daily timeframe, candle activity continues to hold onto gains north of support at $1,911, though is seen grinding along the underside of a trend line support-turned resistance, taken from the low $1,455. Further buying targets the $1,992 September 1 high followed by the $2,015 August 18 high. A dip sub $1,911 will draw weekly support mentioned above at $1,882 into the frame.
A closer reading of price action on the H4 timeframe had Thursday cross swords with support at $1,941, following a dip from September’s opening value at $1,966, a line drawn just ahead of August’s opening value at $1,975.
Traders who read Thursday’s technical briefing may recall the following (italics):
A $1,941 support retest could emerge on the H4 timeframe, a level that may appeal to dip buyers. A recovery from the noted support is backed by the weekly timeframe, yet might be hindered by daily structure (trend line resistance). A H4 bullish candlestick signal formed from the said H4 support may persuade buying, targeting $1,966/$1,975 as a primary point on the H4. Above here, traders will likely reach for $2,000.
Areas of consideration:
The reaction from $1,941 support on the H4 chalked up a mild outside reversal candle, which seems to have been welcomed by buyers. As underlined above, the initial upside target from current price falls in around $1,966/$1,975.
Should we fail to secure support, traders’ crosshairs are likely to drop back to the higher timeframe support zone at $1,911.90-$1,921.00 (green H4), an area which has plugged downside since August and recently (September 8) offered a solid buy signal.
The accuracy, completeness and timeliness of the information contained on this site cannot be guaranteed. IC Markets does not warranty, guarantee or make any representations, or assume any liability regarding financial results based on the use of the information in the site.
News, views, opinions, recommendations and other information obtained from sources outside of www.icmarkets.com.au, used in this site are believed to be reliable, but we cannot guarantee their accuracy or completeness. All such information is subject to change at any time without notice. IC Markets assumes no responsibility for the content of any linked site.
The fact that such links may exist does not indicate approval or endorsement of any material contained on any linked site. IC Markets is not liable for any harm caused by the transmission, through accessing the services or information on this site, of a computer virus, or other computer code or programming device that might be used to access, delete, damage, disable, disrupt or otherwise impede in any manner, the operation of the site or of any user’s software, hardware, data or property.