Tezos Price Prediction: XTZ facing potential bearish breakout towards $1.77
![]()
- XTZ is trading inside an ascending parallel channel close to a breakout point.
- A bearish breakout has the potential to drive the price of XTZ down to $1.77.
XTZ is currently trading at $2.08 right at the bottom of an ascending parallel channel formed on the daily chart. The digital asset is down 53% since its 2020-high at $4.47, established on August 12.
The breakout of this critical support level will be devastating for XTZ
On the daily chart, the price of XTZ is bounded inside an ascending parallel channel. The current price at $2.08 is right above the lower trendline of the pattern at $2.07. Additionally, the MACD is on the verge of turning bearish for the first time since September 19.
XTZ/USD daily chart
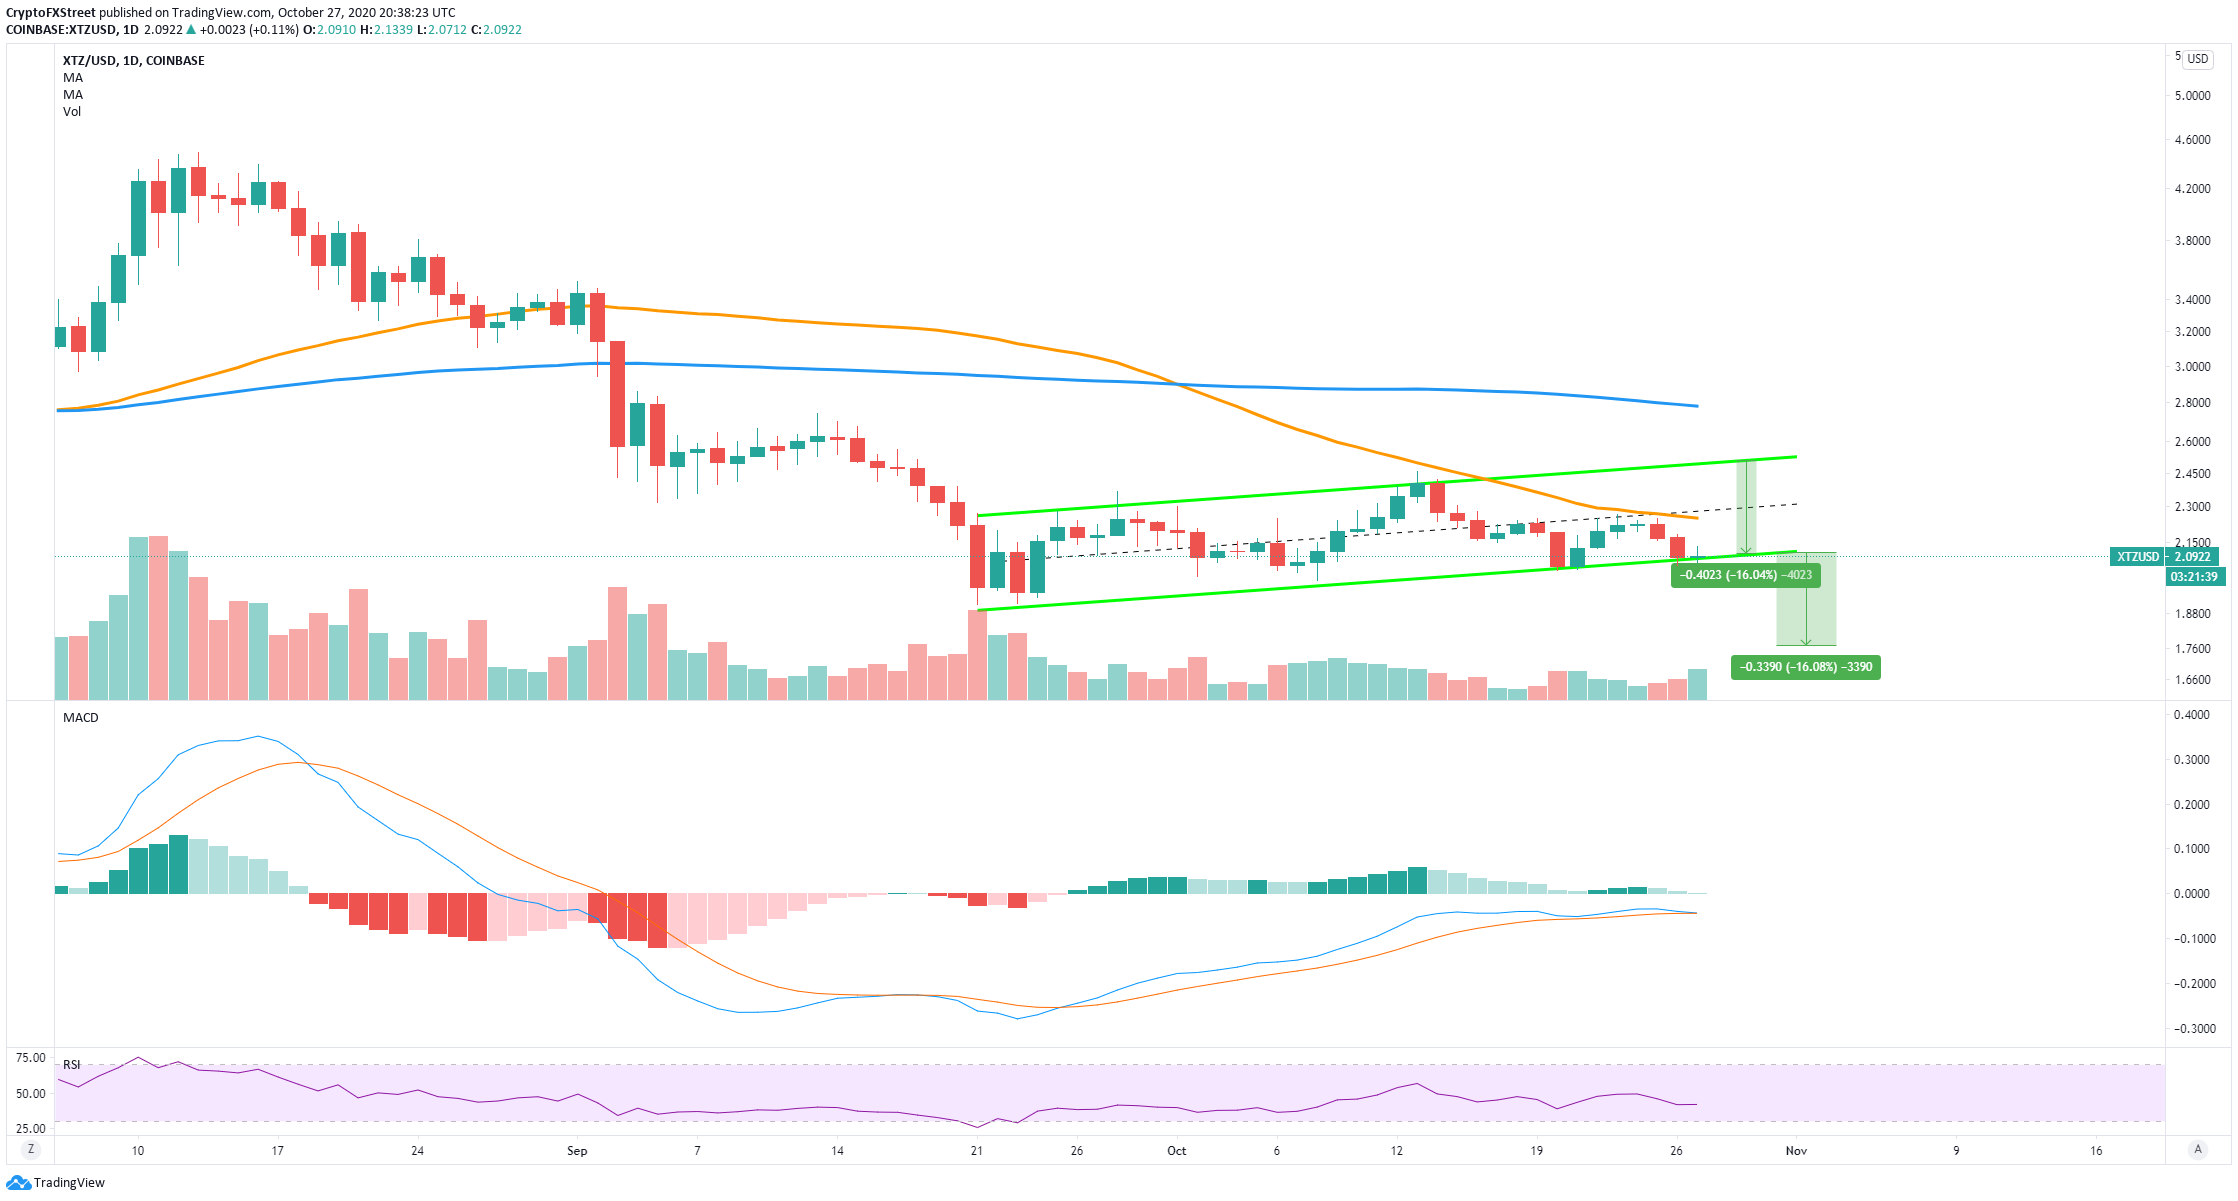
A breakout below the critical support level at $2.07 can drive the price of Tezos down by 16%, which is the length from the bottom trendline to the top one. This would represent a price target of around $1.77.
Bulls trying to recover control over short timeframes
On the 4-hour chart, XTZ lost the 50-SMA and the 100-SMA, but bulls are defending the critical support level at $2.07. The MACD is also slowly turning bullish after a rebound thanks to an oversold RSI.
XTZ/USD 4-hour chart
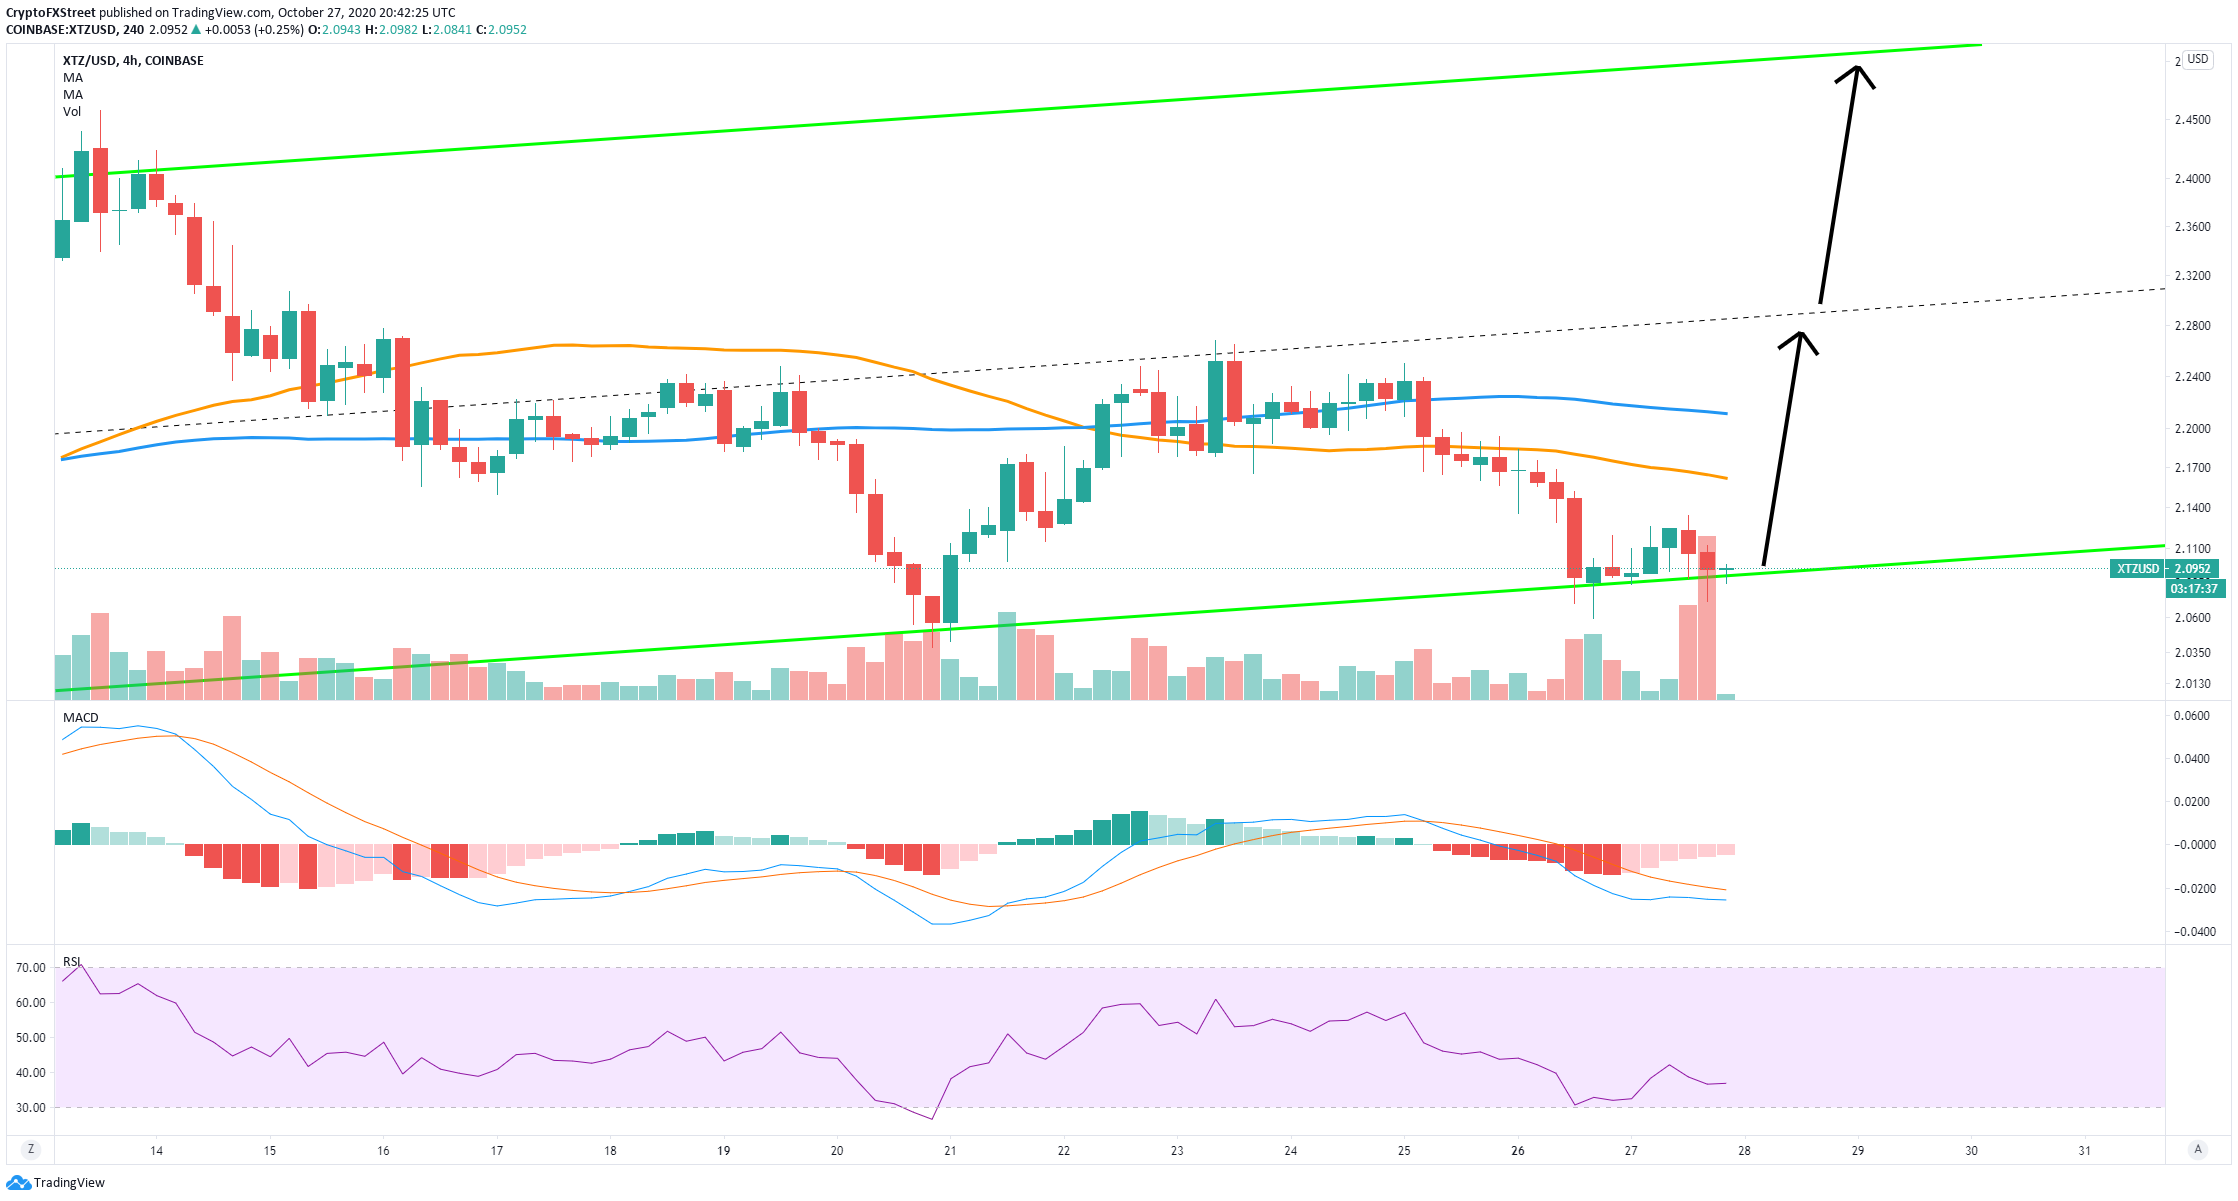
A successful bounce can drive the price of XTZ up to the middle trendline of the ascending parallel channel at $2.3, turning the 50-SMA and 100-SMAs into support levels. A longer-term price target would be $2.5, the upper boundary of the ascending channel.