Wednesday 28th October: Technical Outlook and Review

Key risk events today:
Australia CPI q/q; BoC Monetary Policy Report, Rate Statement, Overnight Rate and Press Conference.
(Previous analysis as well as outside sources – italics).
EUR/USD:
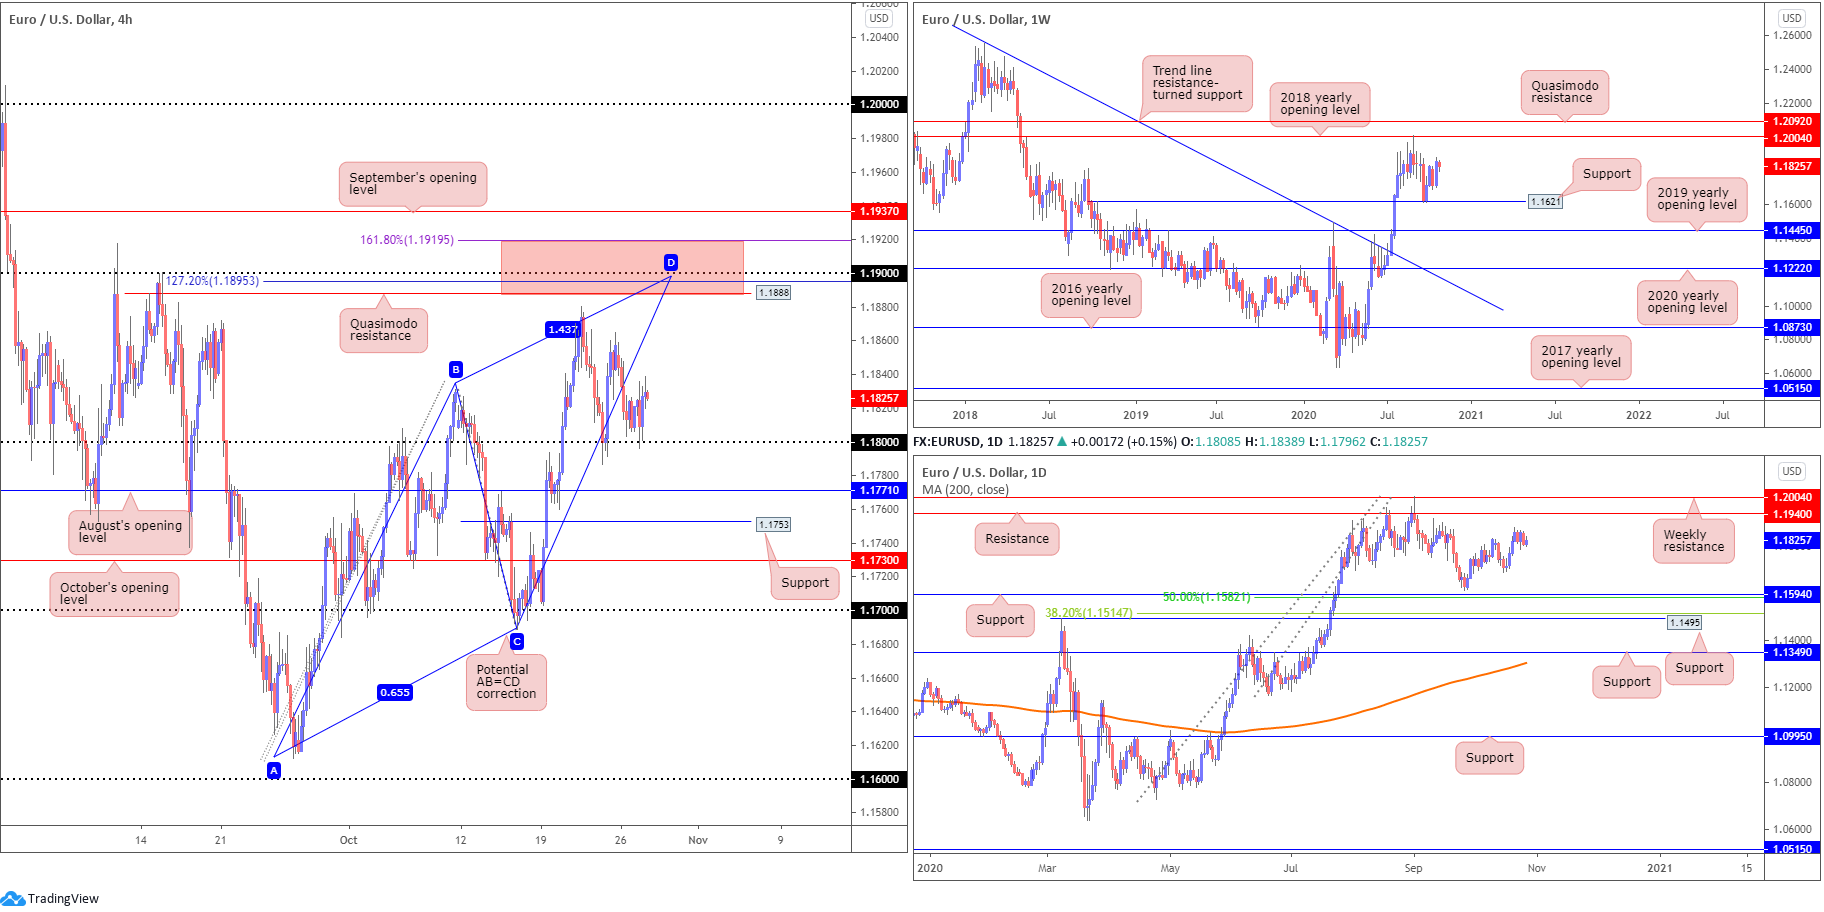
Europe’s shared currency, as you can see, regained some composure following a mild dip under the 1.18 handle against a broadly softer US dollar on Tuesday, with little motivation derived from stronger-than-expected US durable goods orders.
Breaching 1.18, as aired in previous research, shines the spotlight on August’s opening value at 1.1771. To the upside, aside from last Wednesday’s session peak at 1.1880, H4 Quasimodo resistance at 1.1888 is considered the next target. What’s interesting here is the level is sited close by a 127.2% Fibonacci projection point at 1.1895, the 1.19 handle, along with an AB=CD correction point at 1.1905 and a 1.618 BC projection plotted at 1.1919 (red zone).
From the weekly timeframe, we remain holding north of minor support at 1.1621, with the possibility of a run to the 2018 yearly opening value at 1.2004. Also important to consider is we recently unseated trend line resistance (mid-July), taken from the high 1.2555.
The technical position on the daily timeframe, despite the indecisive phase seen since last Wednesday, also exhibits scope to explore higher terrain, with little seen preventing bulls from taking a run at resistance coming in from 1.1940. It is also worth acknowledging this base is sited just under weekly resistance mentioned above at 1.2004.
Areas of consideration:
- Follow-through buying off 1.18 is a possibility, particularly after H4 candles formed a bullish inside pattern (essentially the same formation as a western inside bar – not a Harami which focuses only on the bodies).
- August’s opening value at 1.1771 on the H4 alongside nearby support at 1.1753 could welcome buying.
- The H4 zone marked red between 1.1919/1.1888 is made up of a number of technical elements, highlighting strong resistance to be aware of.
- While the H4 area underlined above offers appeal, September’s opening value also on the H4 timeframe at 1.1937, given its connection with daily resistance at 1.1940, opens up the possibility of a fakeout forming through 1.1919 before sellers make an appearance.
GBP/USD:
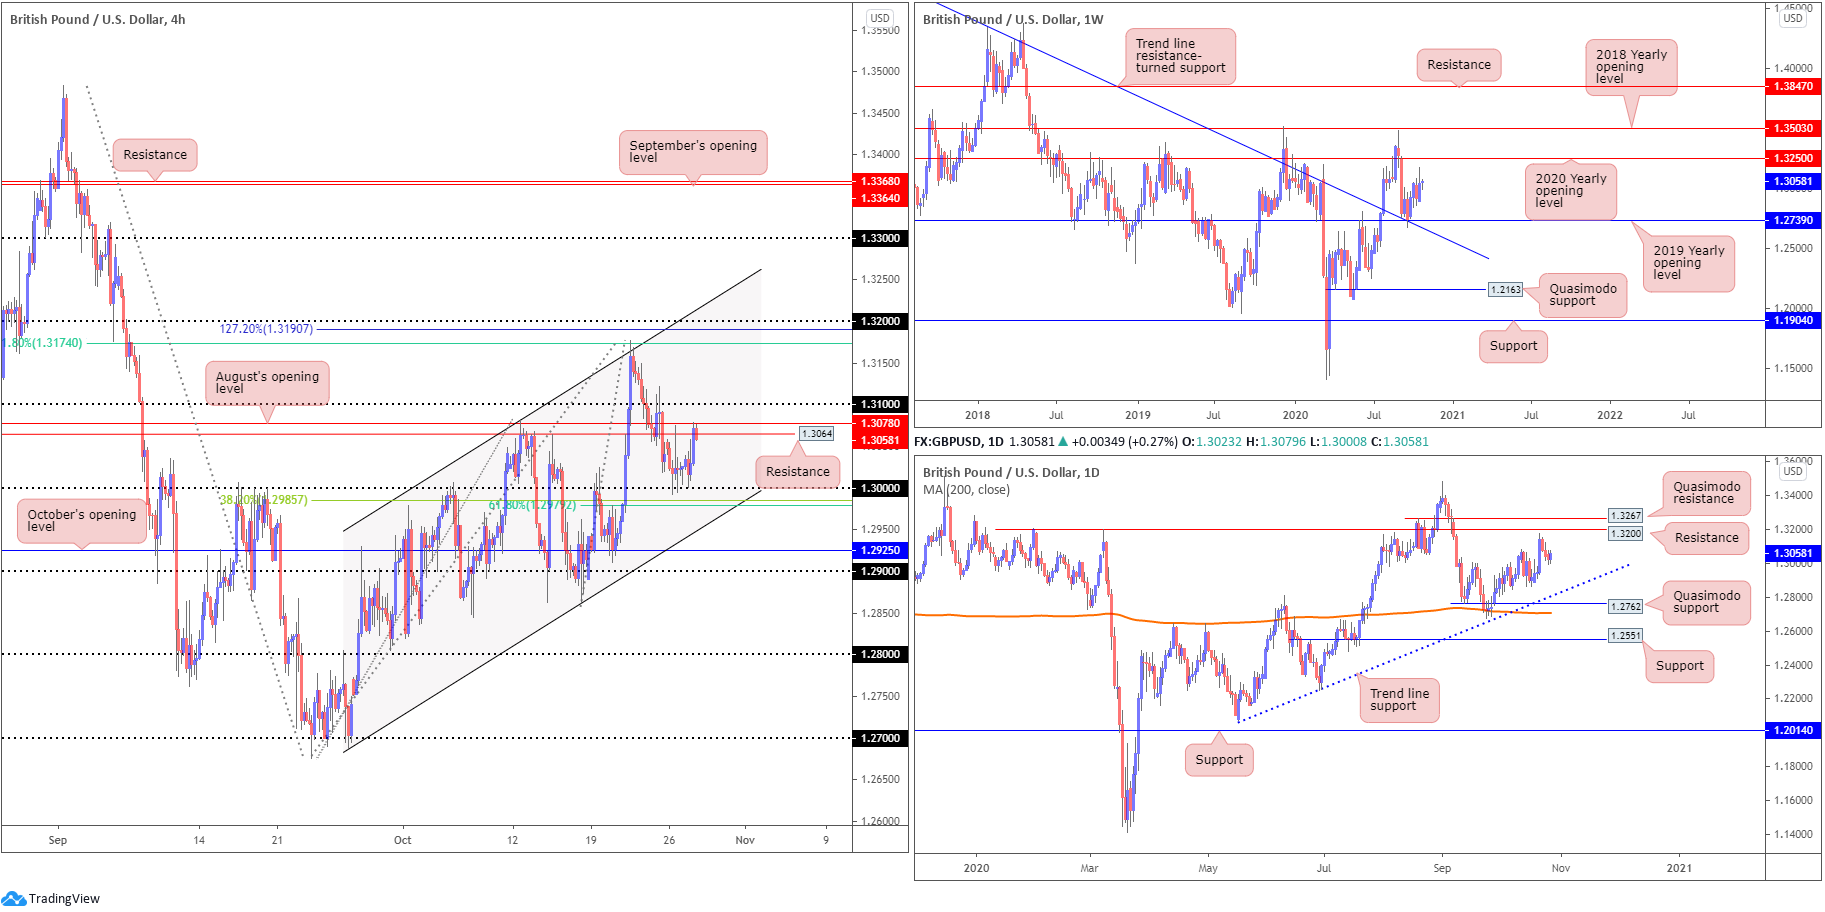
1.30 recently proved itself as support (fixed just above 38.2% and 61.8% Fibonacci retracements around 1.2980ish and a channel support, taken from the low 1.2687), with price pulling away from the H4 base on Tuesday to retest resistances at 1.3078 (August’s opening value) and 1.3064 (sited just south of the 1.31 handle). Should buyers remain optimistic enough to overthrow 1.31 today, this may invite follow-through buying towards the 1.32 region, accompanied by a 61.8% Fibonacci retracement at 1.3174, a 127.2% Fibonacci projection at 1.3190 and channel resistance, extended from the high 1.3082.
Higher timeframes remain mostly unchanged.
From the weekly chart, we can see that following a bout of dip-buying off support at 1.2739 (a 2019 yearly opening value blending with trend line resistance-turned support, extended from the high 1.5930), weekly candles now target the 2020 yearly opening value at 1.3250. Should 1.2739 fail, nonetheless, the 1.2251 low (June 29) is in sight, shadowed by Quasimodo support from 1.2163. It is also worth pointing out the aforementioned trend line was engulfed in late July this year, announcing an uptrend could be on the cards.
Price action on the daily timeframe hit the brakes a touch ahead of resistance from 1.3200 last week, a level pinned just south of Quasimodo resistance at 1.3267, and modestly chalked up a three-day correction. Tuesday, nevertheless, snapped the bearish phase, side-lining hopes of a bearish extension to trend line support, extended from the low 1.2075.
Areas of consideration:
- The 1.30 handle and nearby Fibonacci levels (38.2% and 61.8% plotted beneath 1.30 around 1.2980ish) remain support to be aware of, should sellers make an appearance from 1.31/1.3064 on the H4 today.
- H4 channel support is also likely to garner interest should we reach this far south, though whether the ascending level will be enough to stop price from reaching for October’s opening value at 1.2925 (or the 1.29 handle) is difficult to judge.
- A H4 close above 1.31 today echoes a possible breakout buying theme, with conservative players likely to join if a 1.31 retest forms.
AUD/USD:
It was another muted session Tuesday, unable to find grip above Monday’s high 0.7146, therefore much of what we write here will be a repeat of Monday’s outlook.
From the weekly timeframe:
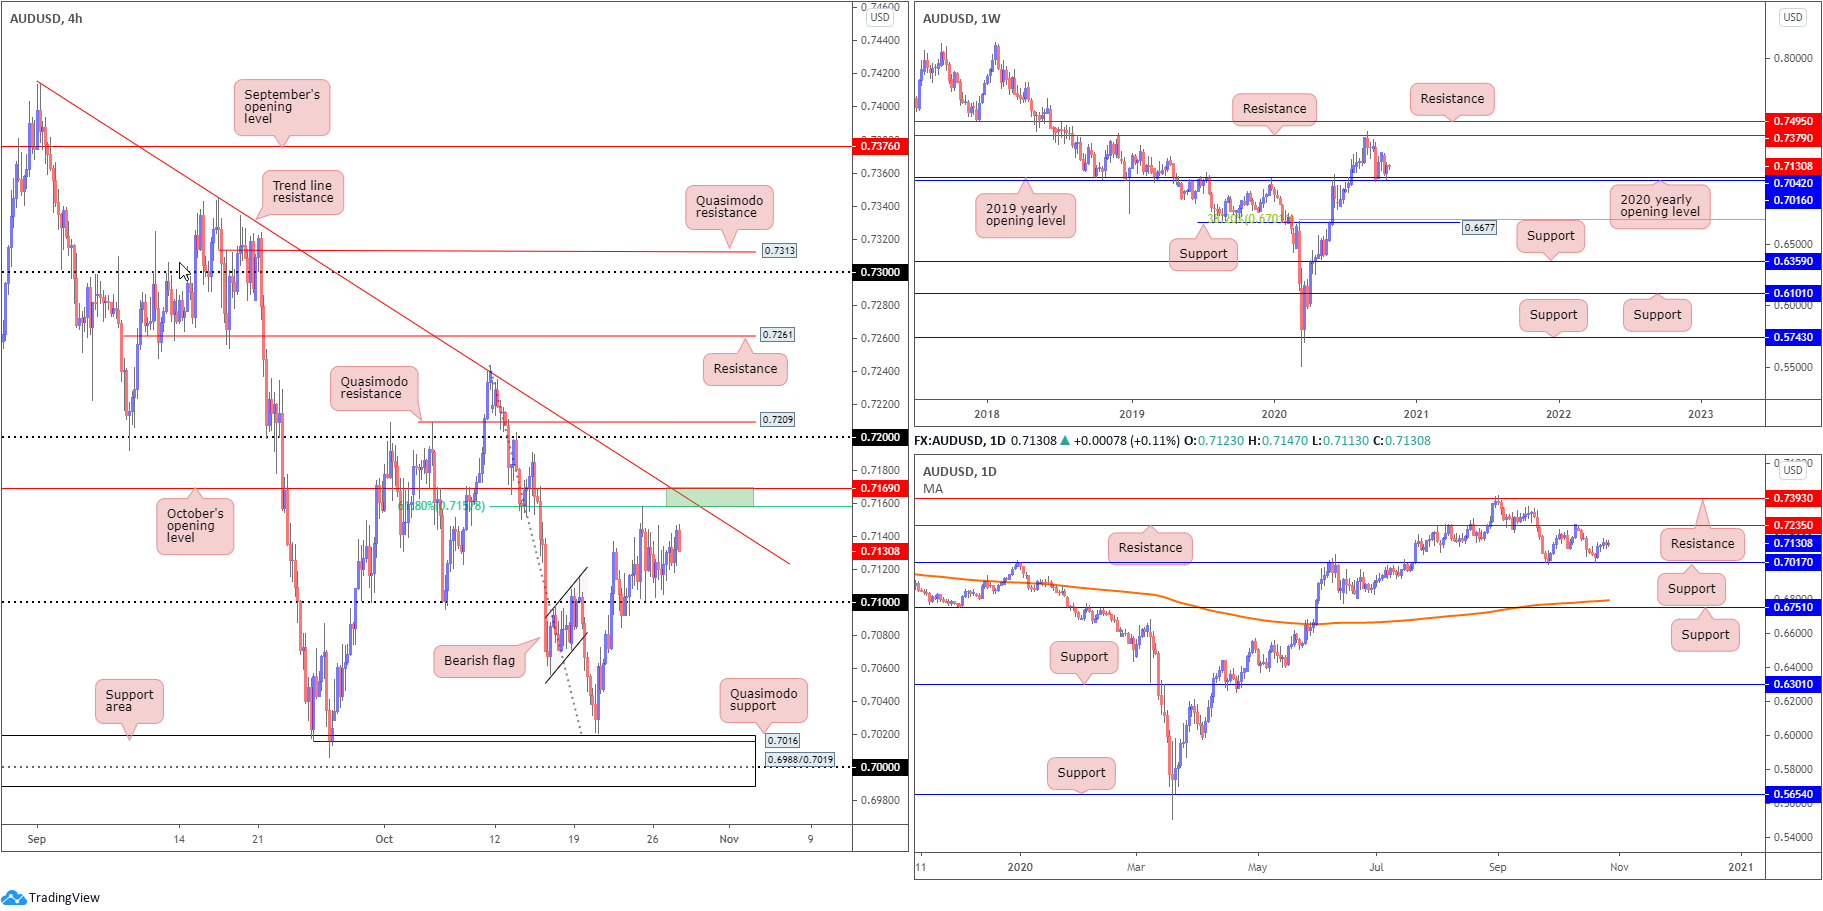
The 2020 (0.7016) and 2019 (0.7042) yearly opening values continue to be recognised as support on the weekly timeframe. Resistance at 0.7379 lines up as the next upside hurdle should an advance materialise. It should also be pointed out that the trend in this market remains to the upside.
Failure to maintain position off 0.7016/0.7042 shifts motivation towards support plotted at 0.6677, and a corresponding 38.2% Fibonacci retracement ratio at 0.6701.
Daily timeframe:
Following last Tuesday’s hammer candle forming ahead of support priced in at 0.7017, AUD/USD rallied strongly Wednesday with Friday embracing peaks at 0.7158. This potentially sets the technical stage for another bout of buying, eyeing resistance plotted at 0.7235.
H4 timeframe:
H4 is seen hovering north of the 0.71 handle. To the upside, a 61.8% Fibonacci retracement resistance is seen at 0.7157, plotted just south of October’s opening value at 0.7169 and a trend line resistance, formed from the high 0.7413.
Clearance of 0.7169 throws the 0.72 handle into the mix as possible resistance, closely shadowed by a Quasimodo resistance level at 0.7209.
Areas of consideration:
- Owing to the overall trend in this market, producing sizeable gains since early 2020, and the weekly and daily timeframes revealing thin resistance until reaching 0.7235 (daily), 0.71 on the H4 remains a support to watch, in addition to a possible breakout scenario above October’s opening value at 0.7169.
- While north is likely to be the favoured direction, traders could still witness an intraday response from H4 trend line resistance (0.7413), due to 61.8% Fibonacci and 0.7169 resistance convergence (green).
USD/JPY:
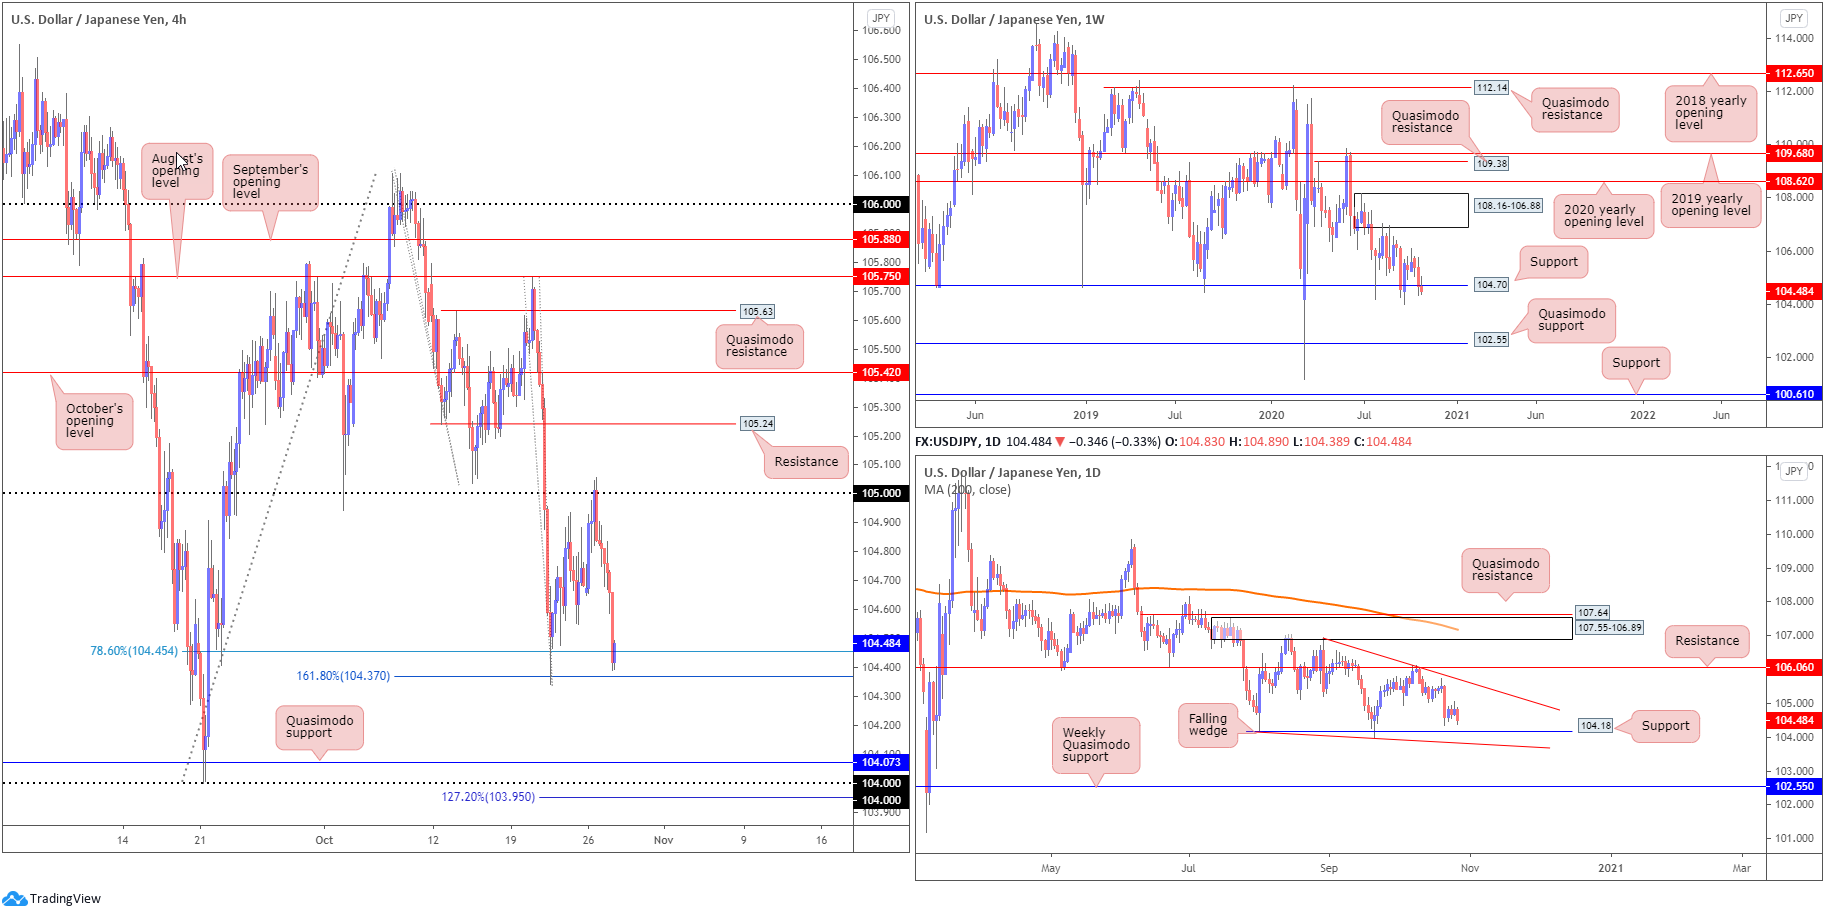
Weighed by broad USD softness and US Treasury yields connecting with weekly lows, USD/JPY extended Monday’s 105 test on Tuesday, and consequently saw price cross swords with a familiar H4 Fibonacci support zone (161.8% Fibonacci projection point at 104.37 and 78.6% Fibonacci retracement ratio at 104.45). Sustained weakness from current levels places H4 Quasimodo support at 104.07 on the hit list, closely shadowed by the 104 handle and a 127.2% Fibonacci projection point at 103.95.
The technical position on the higher timeframes shows weekly price navigating deeper water under current support at 104.70. However, breakout sellers are urged to tread with caution here, having noted July and September both managing to recover from below the aforesaid support base. Additionally, we also see daily support arranged around the 104.18 level, sited just above the lower edge of a daily falling wedge pattern (106.94/104.18).
Areas of consideration:
- A reaction from the H4 Fibonacci support zone at 104.37/104.45 could be seen, yet higher timeframe flow suggests buying might flatline here.
- Bearish scenarios under 104.37, therefore, could be an option today, targeting daily support at 104.18, followed by H4 Quasimodo support at 104.07 and then the 104 handle.
USD/CAD:
The US dollar finished lower against the Canadian dollar on Monday, largely on the back of rising oil prices and lacklustre USD demand.
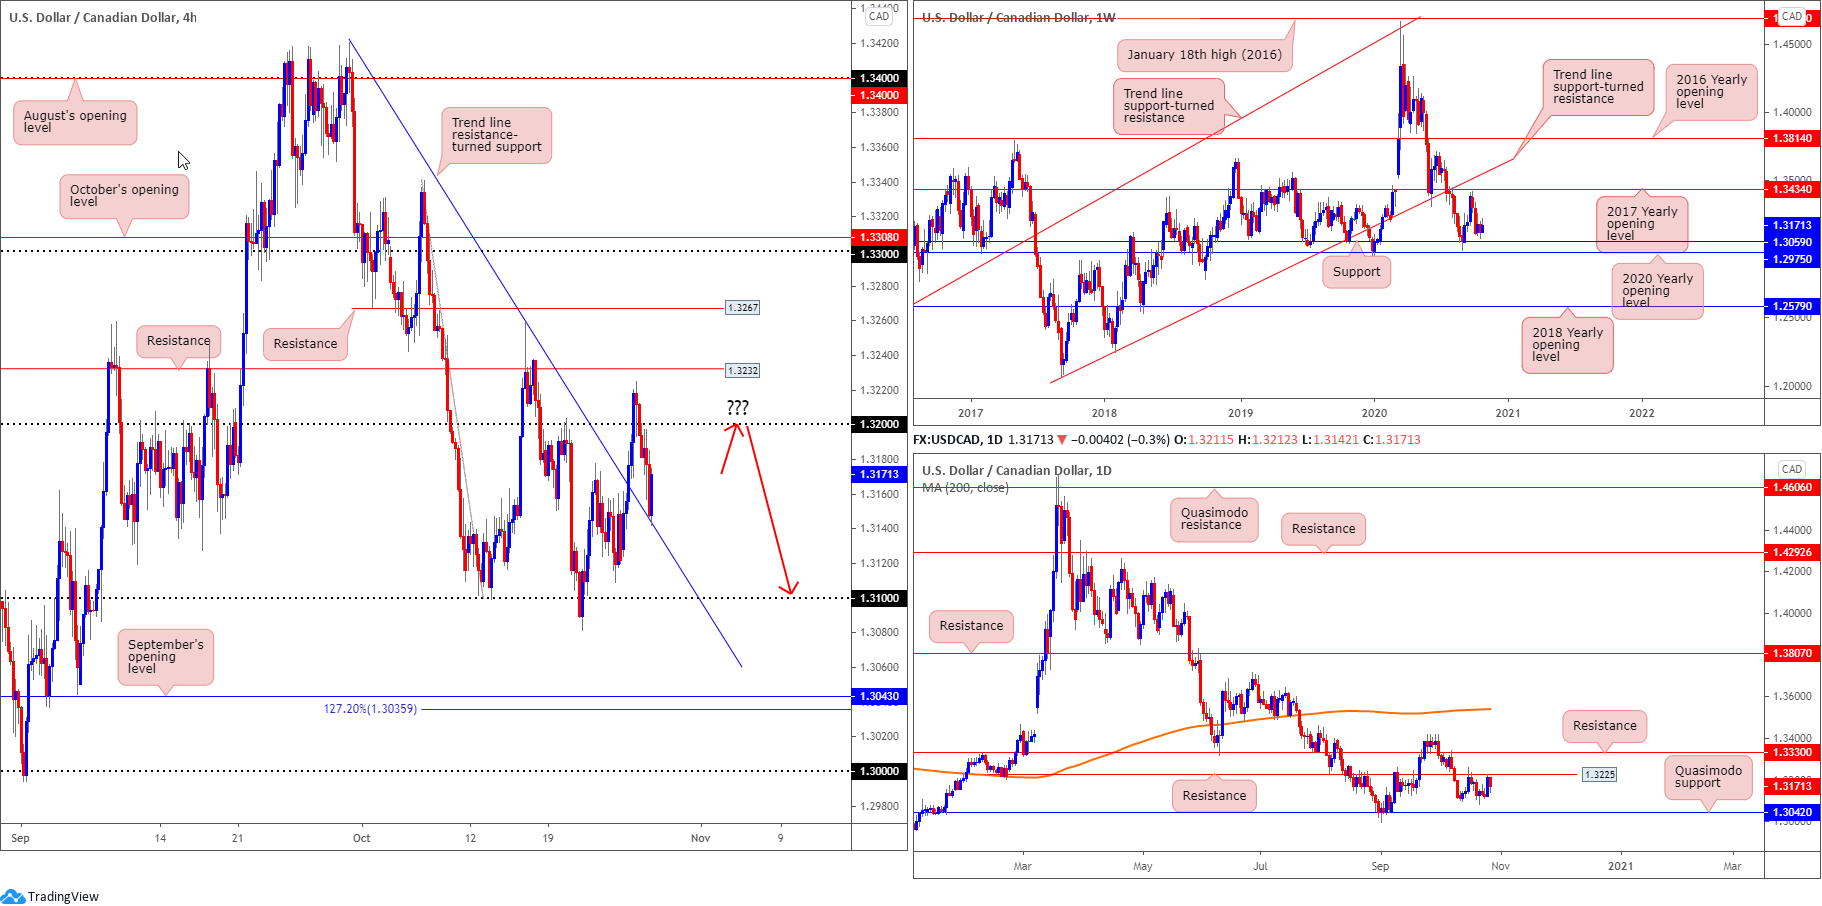
Technically, the H4 candles found thin air north of the 1.32 handle, missing resistance at 1.3232 by a hair before pulling back through 1.32 and testing trend line resistance-turned support, extended from the high 1.3420.
What was interesting, however, is daily price actually recoiled from resistance at 1.3225, plotted just under the H4 resistance mentioned above at 1.3232. Continued selling from here could have price action target daily Quasimodo support at 1.3042.
From the weekly timeframe, despite shedding more than 2% south of the 2017 yearly opening value at 1.3434, longer-term activity recently established a floor ahead of support at 1.3059 (arranged above the 2020 yearly opening value at 1.2975).
Areas of consideration:
- The reaction off the H4 trend line support, from the high 1.3420, may fail to attract fresh bids, threatened by daily resistance at 1.3225 and the fact weekly price exhibits scope to push for 1.3059.
- With the above taken on board (higher timeframes), a retest at 1.32 could be enough to spark an intraday sell-off today, with 1.31 in line as a reasonable downside target.
USD/CHF:
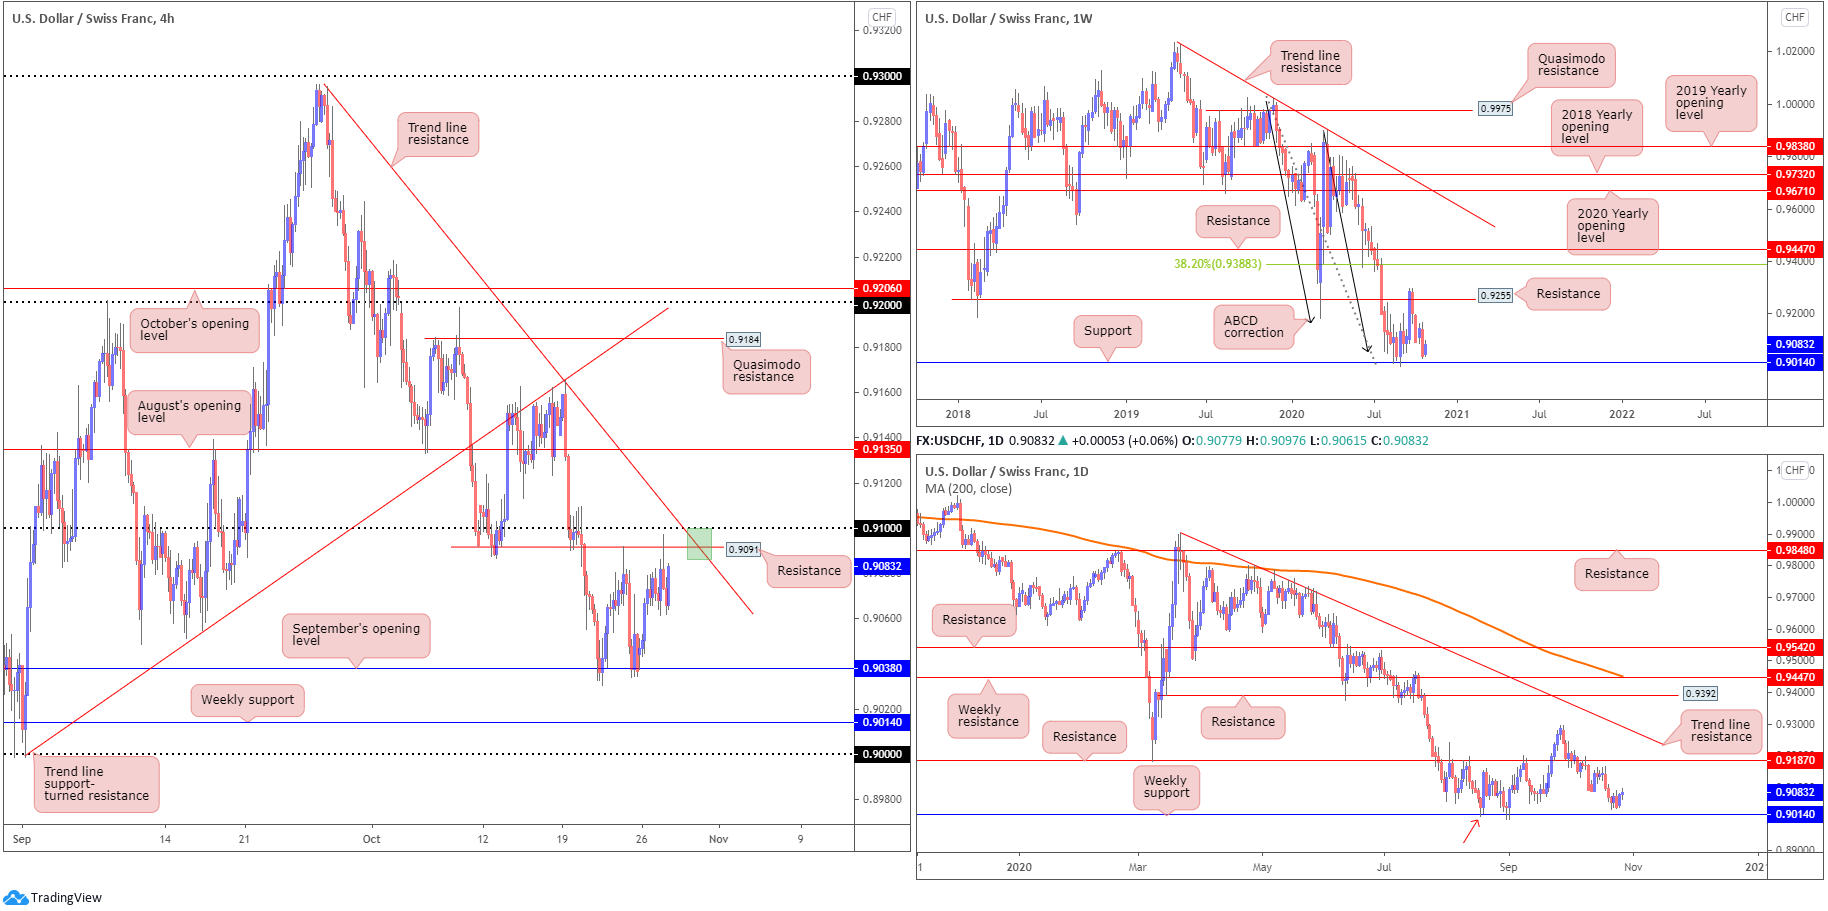
Kicking off from the weekly timeframe, traders will acknowledge the unit recently found demand ahead of support at 0.9014. For those who read previous analysis on this pair, you will also note current support is bolstered by ABCD support at 0.9051 (black arrows). Quasimodo support at 0.8692 is in view as the next downside objective should sellers bring down 0.9014.
In similar fashion to the current ranging phase on EUR/USD, the daily timeframe reveals buyers and sellers are battling for position just north of the weekly support level mentioned above at 0.9014 on the USD/CHF. What’s interesting is weekly support on the daily chart represents a Quasimodo support (red arrow – left shoulder).
Across the page on the H4 timeframe, we can see September’s opening value from 0.9038 representing a solid floor since last week, encouraging moves to resistance at 0.9091 (sited south of 0.91 and merging closely with trend line resistance, extended from the high 0.9295).
Areas of consideration:
- A clear scenario to be conscious of on the H4 scale this morning is a retest at the 0.9091 H4 resistance, particularly around the area marked in green combining H4 trend line resistance (0.9295) and the 0.91 handle.
- Rupturing 0.91, however, unlocks a possible bullish theme to August’s opening value at 0.9135.
- Bullish scenarios are also possible out of 0.90/0.9014 (widely watched round number/weekly support), in the event we dip this far south this week. Conservative buyers, however, could seek additional confirmation (think bullish candlesticks or even lower timeframe setups off support) before pulling the trigger.
Dow Jones Industrial Average:
US equities ended Tuesday mixed as investors digested surging COVID-19 cases. The Dow Jones Industrial Average dropped 222.19 points, or 0.80%, the S&P 500 declined 10.29 points, or 0.30% while the Nasdaq traded higher by 72.41 points, or 0.64%.
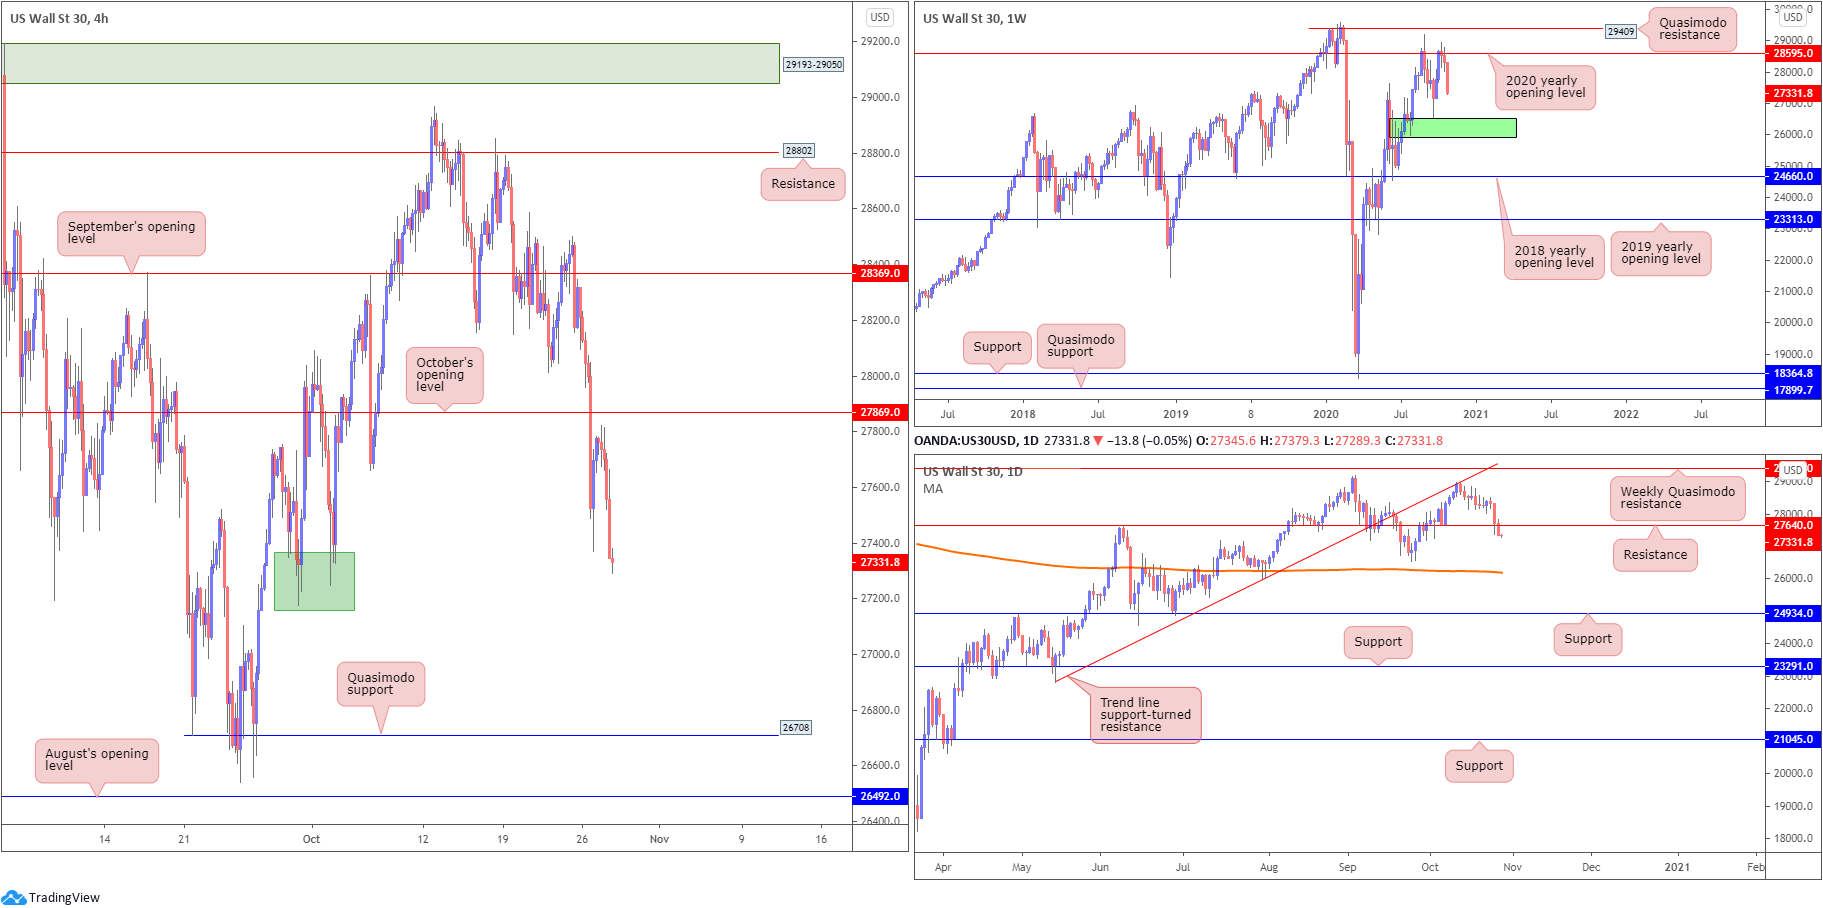
The Dow, so far this week, trades lower by nearly 3.5%, as weekly price assumes a bearish theme south of the 2020 yearly opening value at 28595 and places demand (green) at 25916/26523 back in the firing line. From the daily timeframe, we can see this week’s bearish narrative pulled the unit through support at 27640 yesterday (now a potential resistance), and shifted focus to the 200-day SMA (orange – 26193).
A closer reading of price action on the H4 timeframe shows us that we recently entered an area of support around 27300, with a break exposing Quasimodo support at 26708.
Areas of consideration:
- Sellers are likely to remain in full swing, given the room seen to move lower on the weekly and daily timeframes right now. A retest of October’s opening value at 27869 would likely appeal to sellers, as would a retest at daily resistance from 27640 below here.
XAU/USD (GOLD:
Gold has offered us little in terms of movement so far this week.
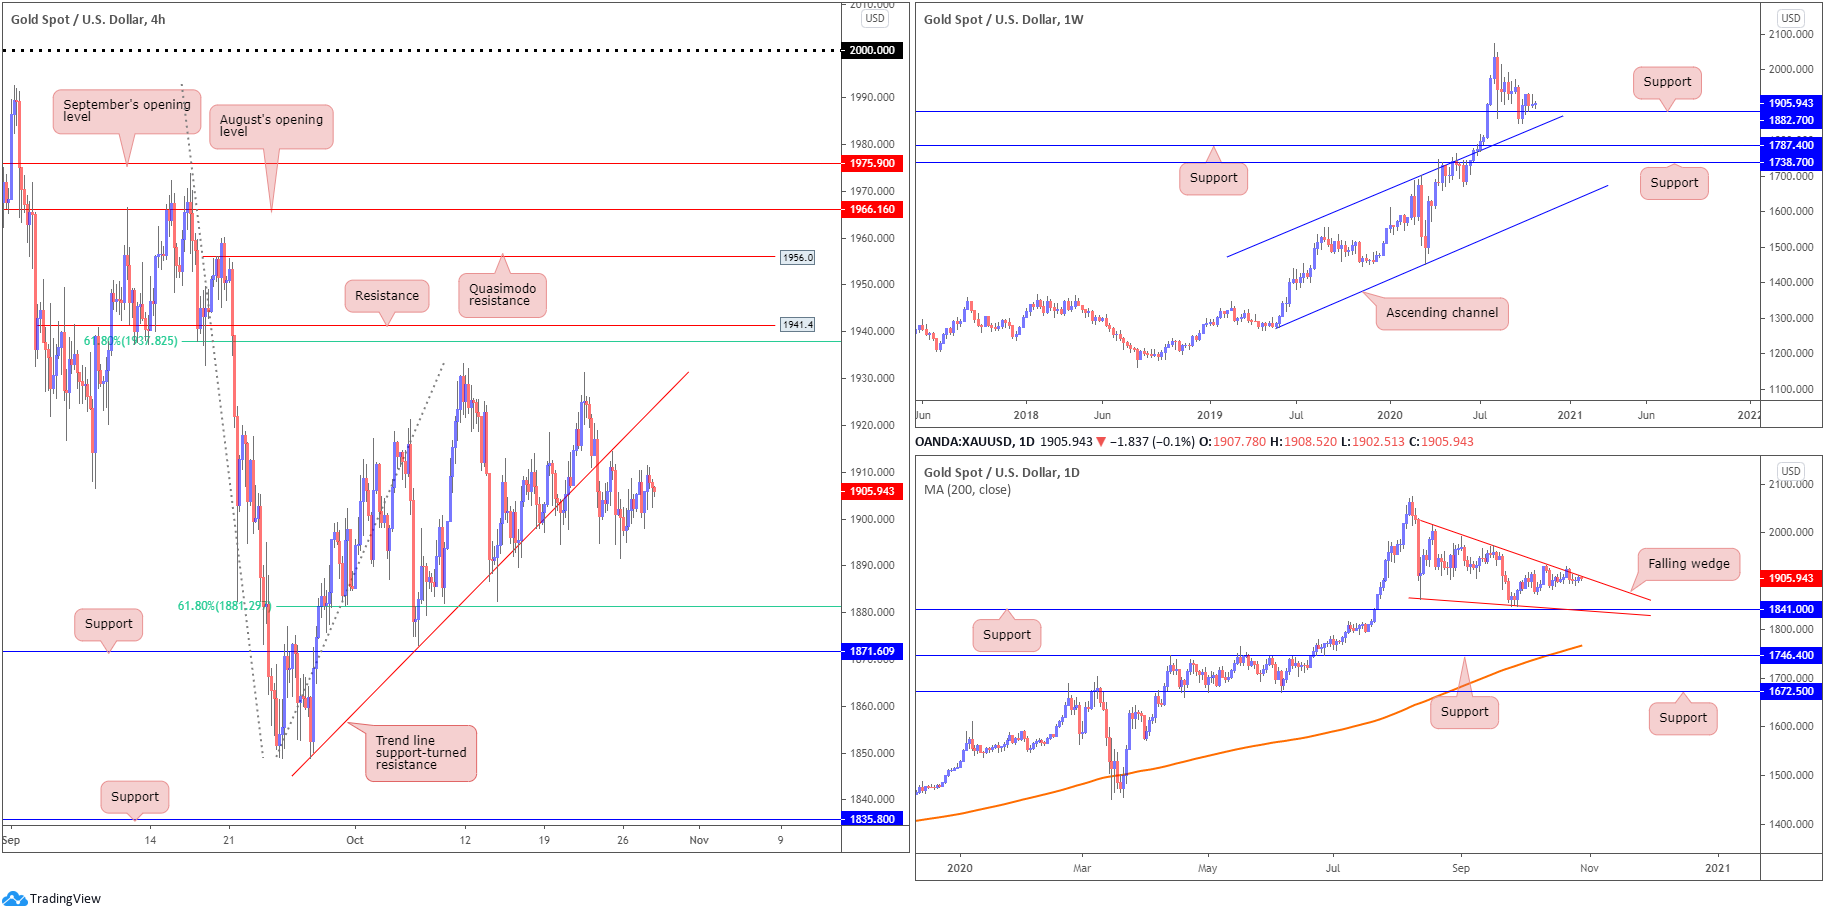
From the weekly timeframe, candle action continues to circle above support at $1,882, fixed a touch above channel resistance-turned support, taken from the high $1,703. While the immediate trend (higher since 2016) favours a bullish scenario here, the lack of buying interest seen from mid-August suggests a dip to the aforementioned channel support. Traders are also urged to pencil in supports at $1,787 and $1,738 in the event buyers fail to make an appearance.
The daily timeframe, however, appears to be creating a falling wedge between $2,015 and $1,862 (the lower boundary also lines up closely with support at $1,841), which may be interpreted as a continuation signal in the event of a breakout north.
The technical landscape on the H4 chart shows price recently overthrew trend line support, taken from the low $1,848. As you can see, we retested the underside of this angle on Friday, presumably to gather fresh sellers, and have since entered a relatively tight consolidation. This may eventually have sellers work through local support around $1,895 and head towards the 61.8% Fibonacci retracement ratio at $1,881, followed by support at $1,871.
Areas of consideration:
- The break of H4 trend line support helps confirm additional downside from the upper border of the daily timeframe’s falling wedge. Consequently, H4 sellers off trend line support-turned resistance could target the $1,881/$1,871 region.
- Expecting much more of a move beyond $1,881/$1,871 is tricky since you’re then also dealing with weekly support at $1,882.
The accuracy, completeness and timeliness of the information contained on this site cannot be guaranteed. IC Markets does not warranty, guarantee or make any representations, or assume any liability regarding financial results based on the use of the information in the site.
News, views, opinions, recommendations and other information obtained from sources outside of www.icmarkets.com.au, used in this site are believed to be reliable, but we cannot guarantee their accuracy or completeness. All such information is subject to change at any time without notice. IC Markets assumes no responsibility for the content of any linked site.
The fact that such links may exist does not indicate approval or endorsement of any material contained on any linked site. IC Markets is not liable for any harm caused by the transmission, through accessing the services or information on this site, of a computer virus, or other computer code or programming device that might be used to access, delete, damage, disable, disrupt or otherwise impede in any manner, the operation of the site or of any user’s software, hardware, data or property