Silver Price Analysis: XAG/USD sidelined in Asia, D1 shows bearish channel breakdown
![]()
- Silver’s daily chart shows a rising channel breakdown.
- A break above the Oct. 12 high is needed to confirm a bullish reversal.
Silver is currently trading unchanged on the day near $24.34 per ounce.
The path of least resistance for the metal is to the downside, according to the daily chart.
Prices fell by 1.43% on Monday, confirming a downside break of an ascending channel connecting Sept. 24 and Oct. 15 lows and Sept. 29 and Oct. 12 highs.
The breakdown is still valid and indicates the sell-off from the Sept. 1 highs near $28.90 has resumed. The immediate support is seen at $23.38 (100-day simple moving average).
Alternatively, a close above the Oct. 12 high of $25.565 would invalidate lower highs setup on the daily chart and confirm a bearish-to-bullish trend change.
Daily chart
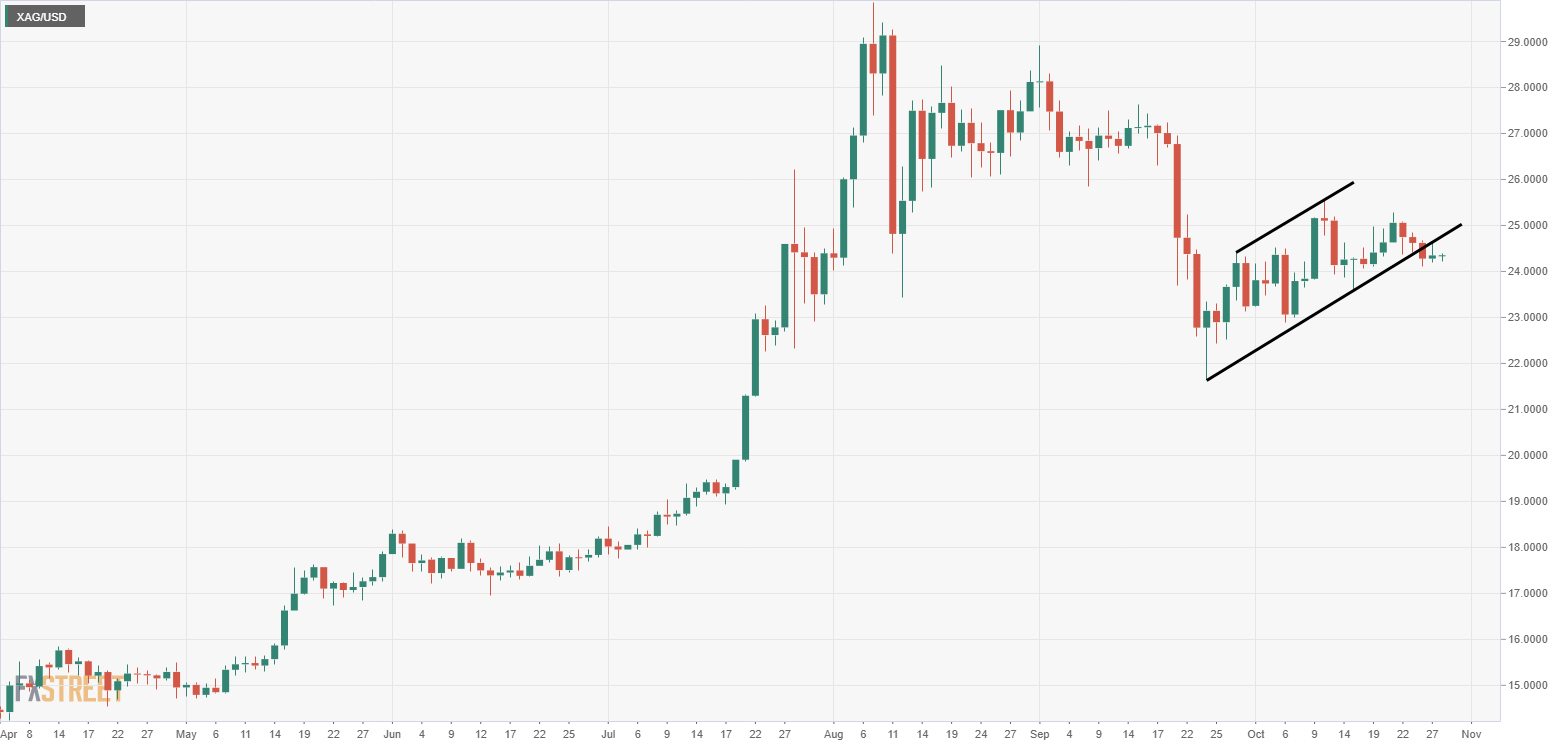
Trend: Bearish