US Durable Goods Orders October Preview: Unemployment what unemployment?
![]()
- Durable Goods Orders will moderate following Retail Sales.
- Business spending should maintain its seven-month pace.
- Consumer spending has been stronger from March than last year.
- Consumption and the US economy continues to grow despite pandemic drag.
Spending on large ticket consumer items moderated in October but the the strong recovery from the pandemic collapse should continue into the holiday season, keeping the economy out of recession despite the second wave of COVID-19 across much of the country.
Durable Goods orders are expected to slip to 1% last month after rising 1.9% in September. Orders ex-transportation are forecast to increase 0.4% following the prior 0.9%. The business spending analog of Nondefense Capital Goods Orders ex-aircraft is projected to rise 0.6% after Septembers 1% increase.
Durable Goods are the Census Bureau’s classification for long-lasting and more expensive consumer purchases. They range from frying pans, electric toothbrushes and shoes to cars, computers and commercial airliners. These expenditures generally follow the overall Retail Sales trends. They are treated as a separate category by the statisticians to differentiate long-term consumer planning from items of day to day use and consumption.
Consumer spending: Retail Sales
Since the end of the nearly universal lockdowns in May the US consumer has behaved as if the economy was still at 3.5% unemployment instead of falling slowly from 14.7% to its current 6.9%..
Retail sales in the eight months of the pandemic, March through October, averaged 0.89%. In the eight months from June 2019 to January 2020 the monthly average was just 0.30%. For all of 2019 the monthly increase was 0.49%.
Retail Sales
In the pandemic the unemployment rate has averaged 9.61%. In the eight months from June 2019 to January the average jobless rate was 3.60%.
As these numbers might seem unexpected, I’ll restate. In the two-thirds of a year since the pandemic burst on the American economic scene, including the shutdown in March and April, Retail Sales gained 0.89% each month while the U-3 unemployment rate averaged 9.61%.
In the eight months immediately prior to COVID-19 Retail Sales averaged 0.30% with 3.60% unemployment.
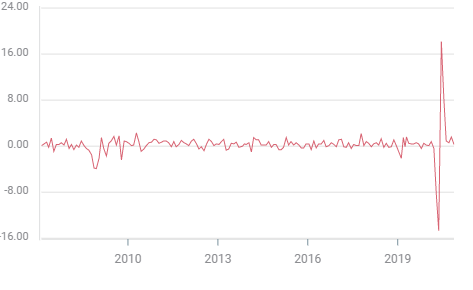
Consumer Spending: Durable Goods
Durable Goods show a more restrained pattern as might be expected for goods that are desired but not mandatory. For the seven months of the pandemic, March through September, the average increase was 0.242%. For the seven months from July 2019 to January 2020 the average was 0.286%. For all of 2019 the average was -0.25%.
Durable Goods
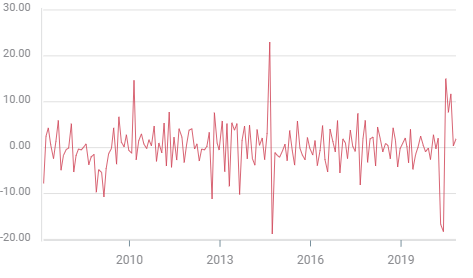
Let us look at the ex-Transport figures also called Core Durable Goods, which excludes high value items like aircraft and other commercial transport equipment.
From March to September this year the monthly gain was 0.33%. In the seven months from July 2019 through January the per month average was negative 0.10%. For all of 2019 the average was -0.07%.
Conclusion: It depends who is out of work
The American consumer seems unfazed by the unemployment brought about by the pandemic. Since the unemployment is patent we can speculate on the cause.
It seems likely that the unemployment created by the lockdowns in March and April, and continuing with the tepid recovery in the restaurant, hospitality and travel industries, has not affected a large portion of overall consumer spending. The immediate return of consumption once the closures ended points to the vast majority of workers retaining or restarting employment.
The second bout of economic restrictions is far less draconian that the first, most retail and businesses remain open. The impact on the economy will likely be unimportant.