Only one resistance barrier ahead of Ethereum price may prevent it from surging to $1,000
![]()
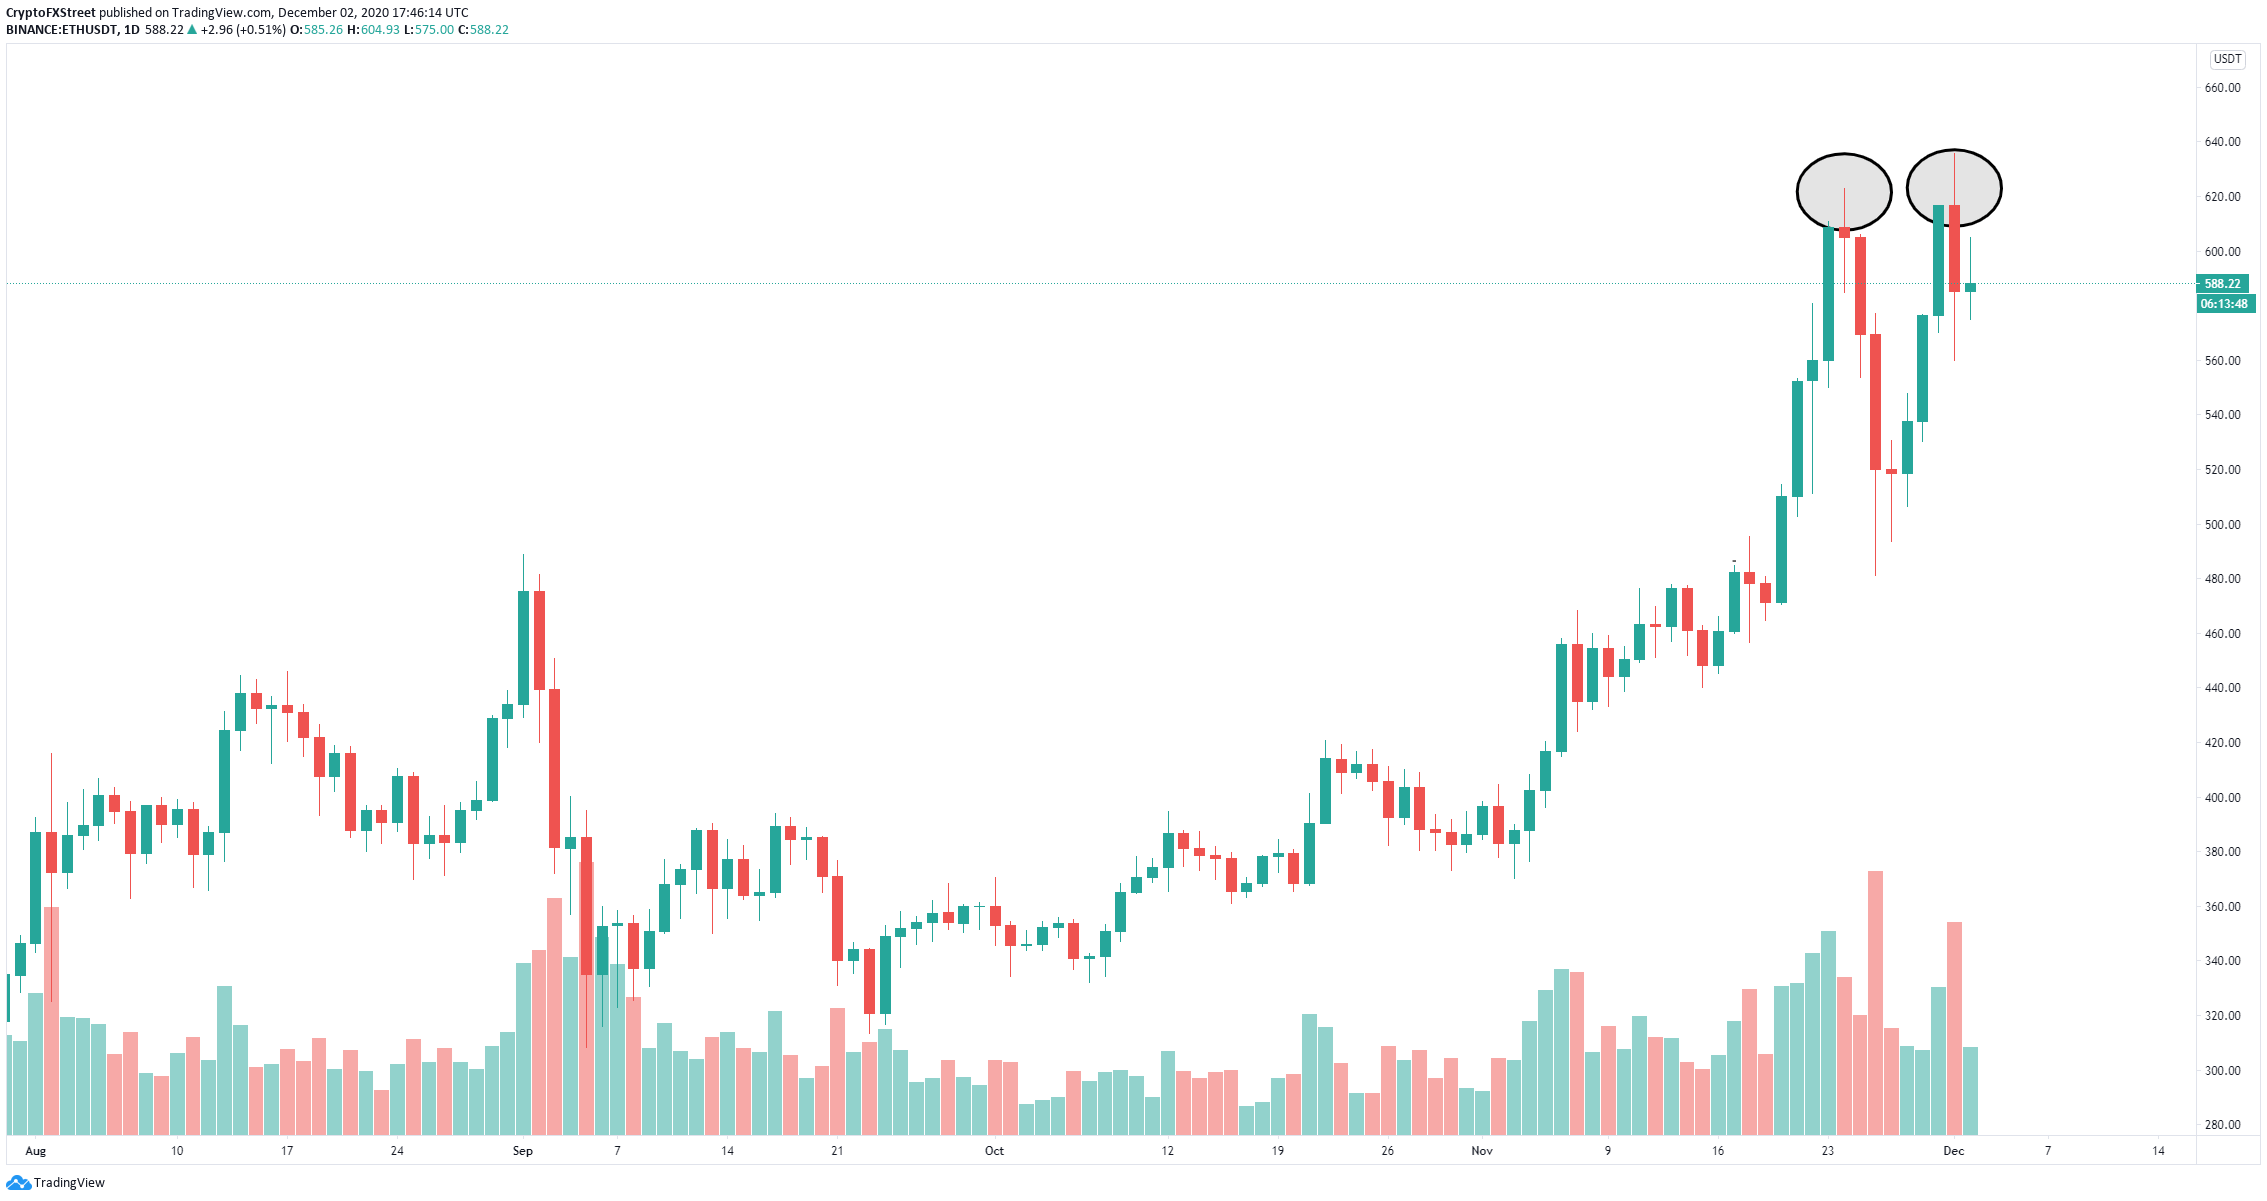
- Ethereum price established a new 2020-high at $635 but got quickly rejected.
- There seems to be a robust resistance area around $610 preventing the digital asset from climbing higher.
Ethereum has experienced a significant rally in the past several weeks thanks to the upcoming Eth2 update. On top of that, Visa has just recently announced the support of USDC payments, which will work on the Ethereum network. Unfortunately, the smart-contracts giant continues facing a vital resistance level at $610.
Can Ethereum price finally crack the last resistance barrier before $1,000?
It seems that whales have been steadily buying ETH coins since mid-November going from 967 to 1,008 currently. This significant increase in large investors shows they are highly interested in Ethereum despite its price increasing.

ETH Holders Distribution chart
On the daily chart, Ethereum price briefly rose above the former 2020-high at $623 hitting $635.7 but got quickly rejected dropping to $560. The area around $610 is the strongest resistance point. A breakout above this level can quickly drive Ethereum price to new highs, potentially at $1,000.
ETH/USD daily chart
The In/Out of the Money Around Price chart (IOMAP) seems to show a similar picture as it indicates there is a strong resistance area between $592 and $609 where 2.16 million ETH were purchased by 847,320 addresses.
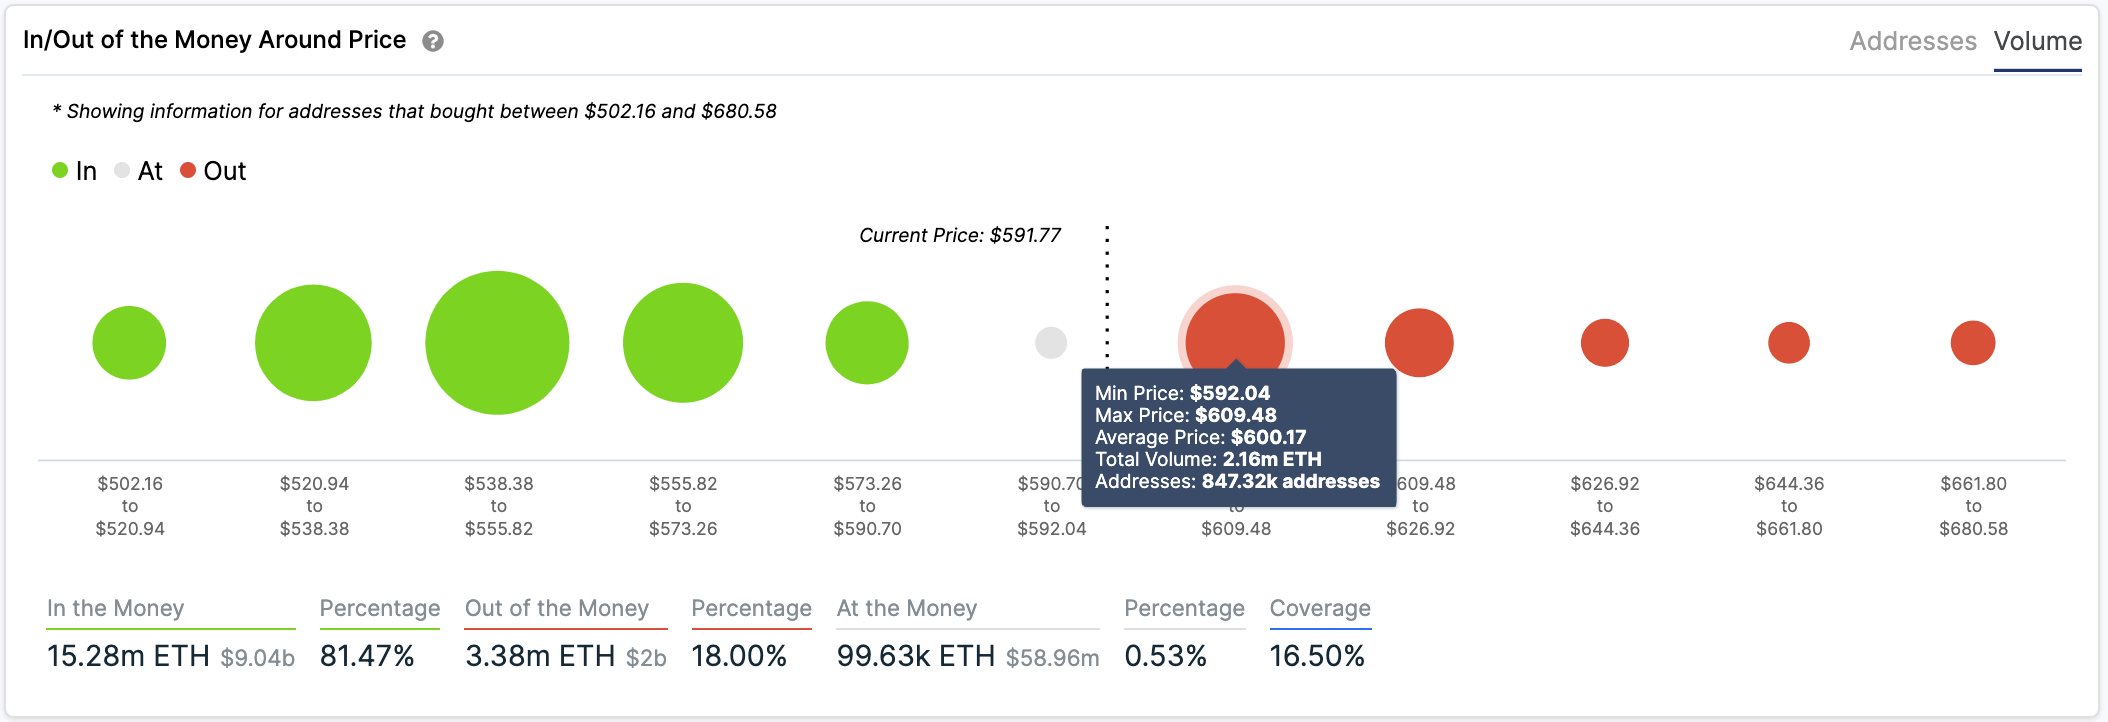
ETH IOMAP chart
Above this area, there is practically no more opposition in comparison to the support below, which adds credence to the $1,000 potential price target for Ethereum. However, ETH is facing other bearish indicators.
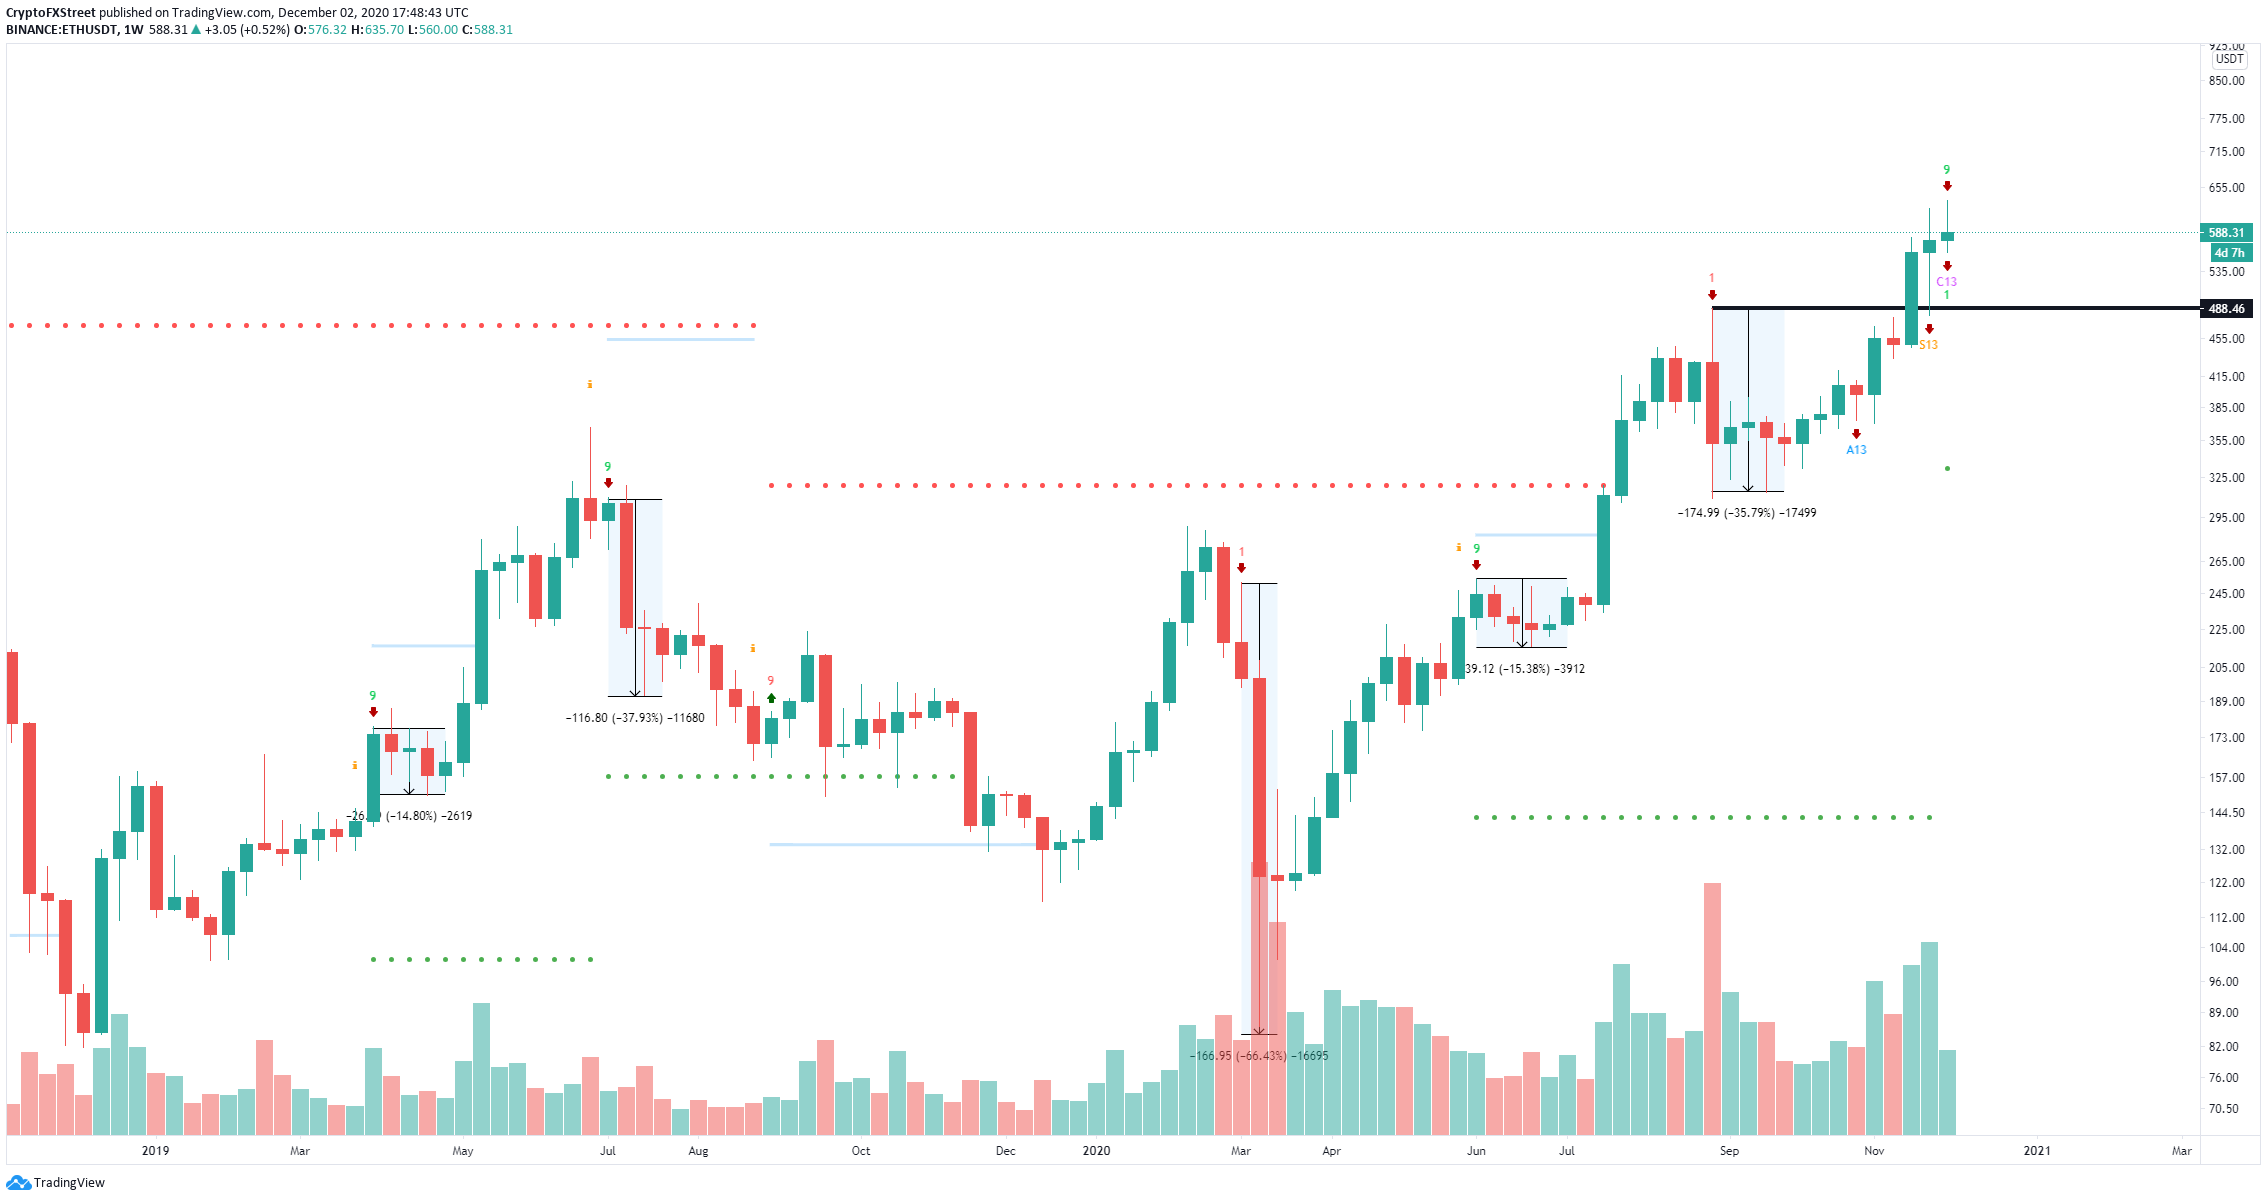
ETH/USD weekly chart
On the weekly chart, the TD Sequential indicator has presented a sell signal which has proven to be exceptionally reliable in the past. Validation of this call would drive Ethereum price to the support level at $488.