Thursday 3rd December: Technical Outlook and Review

Key risk events today:
OPEC-JMMC Meetings; US Unemployment Claims; US ISM Services PMI.
(Previous analysis as well as outside sources – italics).
EUR/USD:
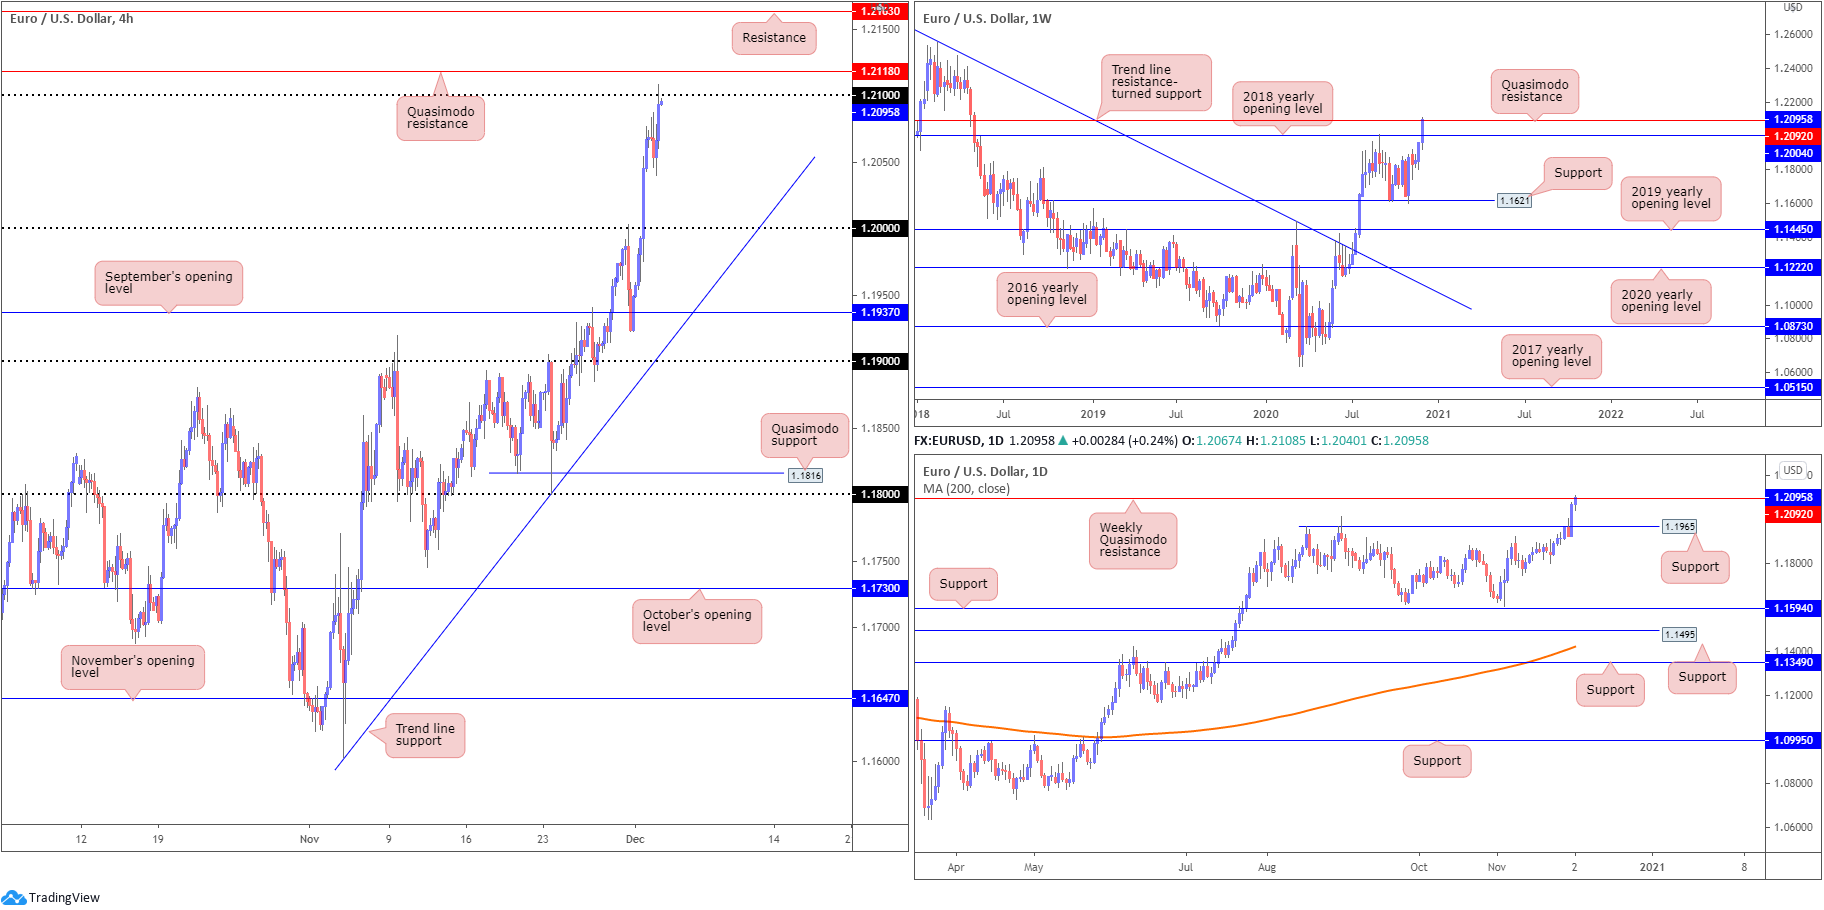
The US dollar index, or DXY, claimed fresh YTD troughs ahead of the 91.00 handle on Wednesday amidst weaker-than-expected ADP non-farm employment. Similarly, EUR/USD worked its way to YTD peaks a touch north of the 1.21 handle (sited ahead of H4 Quasimodo resistance at 1.2118), following Tuesday’s 1.2% rally.
Elsewhere, the weekly timeframe shows price overthrew the 2018 yearly opening value at 1.2004, with Quasimodo resistance at 1.2092 entering the fold on Wednesday. A similar picture is visible on the daily scale, following the removal of Quasimodo resistance at 1.1965 (now possible support).
Areas of consideration:
- The uptrend, seen clearly from the daily timeframe since March 2020, was recently confirmed.
- H1 resistance at 21/1.2118 is now likely a watched zone by countertrend traders and also those long this market as a take-profit zone. The area also benefits from weekly resistance in the form of a Quasimodo level.
- A H4 close above 1.21 (and perhaps 1.2118) would likely be interpreted as a breakout buying signal, targeting at least the 1.2163ish region, H4 resistance.
GBP/USD:
Cable rotated to the downside Wednesday, weighed on the back of Brexit concerns as UK and EU divergence over the main issues remain.
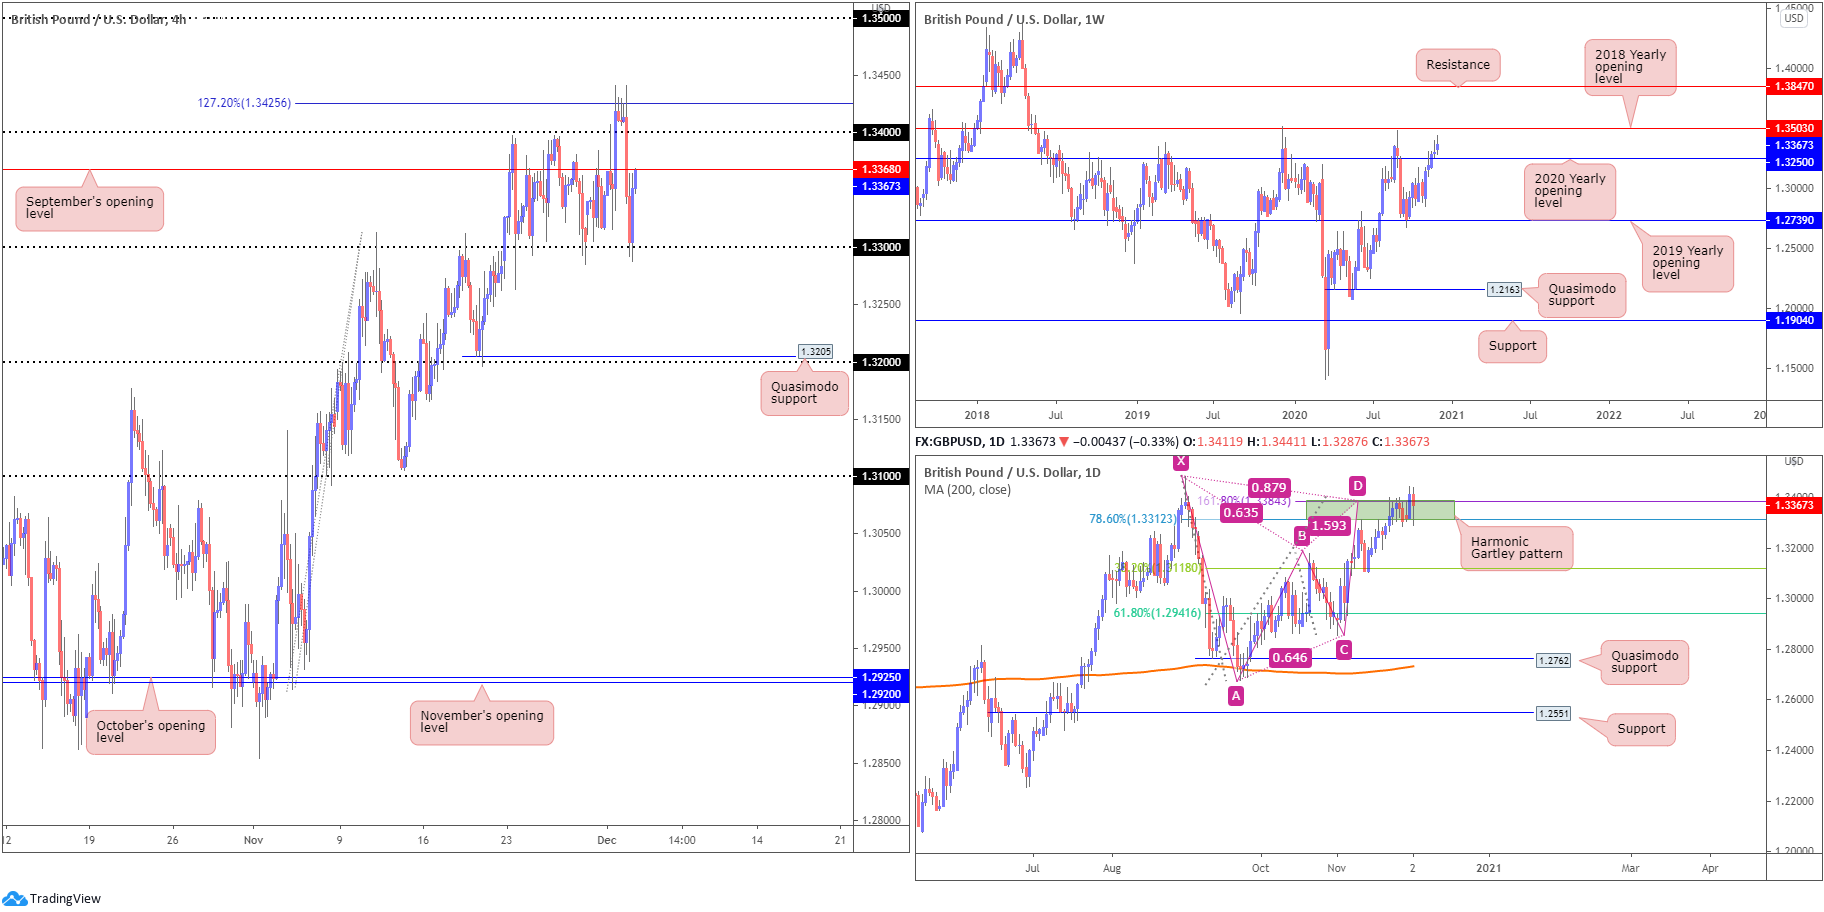
The 127.2% Fibonacci projection point at 1.3425, based on the H4 scale, contained buying yesterday, guiding GBP/USD back under 1.34 and September’s opening value at 1.3368 to test 1.33. The latter has proven effective support/resistance since mid-November, with yesterday rebounding strongly from the round number. September’s opening value at 1.3368 is now in view as possible resistance.
A violation of 1.3425 throws the 1.3483 September peak into the mix.
Interestingly, 1.3483 also represents the X point of a daily bearish harmonic Gartley pattern. Note the pattern’s PRZ at 1.3384/1.3312 recently had its upper edge breached. While price already tested the 38.2% Fibonacci retracement ratio at 1.3118 (arranged from legs A-D [common [initial] take-profit target) out of the PRZ, the Gartley remains active until the X point is consumed.
Higher up on the curve, weekly price continues voyaging north of the 2020 yearly opening value at 1.3250, with further buying to draw in the 2018 yearly opening value at 1.3503 (conveniently sited around the 1.3483 September peak).
Areas of consideration:
- Despite Wednesday’s downbeat tone, buyers still have the advantage following the rebound off 1.33.
- Outdoing September’s opening value at 1.3368 may inspire buyers to take on the 1.34 handle. This could, ultimately, set the stage for a continuation move towards 1.35 and, by extension, the weekly resistance level at 1.3503 (2018 yearly opening value).
AUD/USD:
Stronger against its US counterpart, the Australian dollar outperformed during Wednesday’s US session as the US dollar index threatens to test 91.00 to the downside.
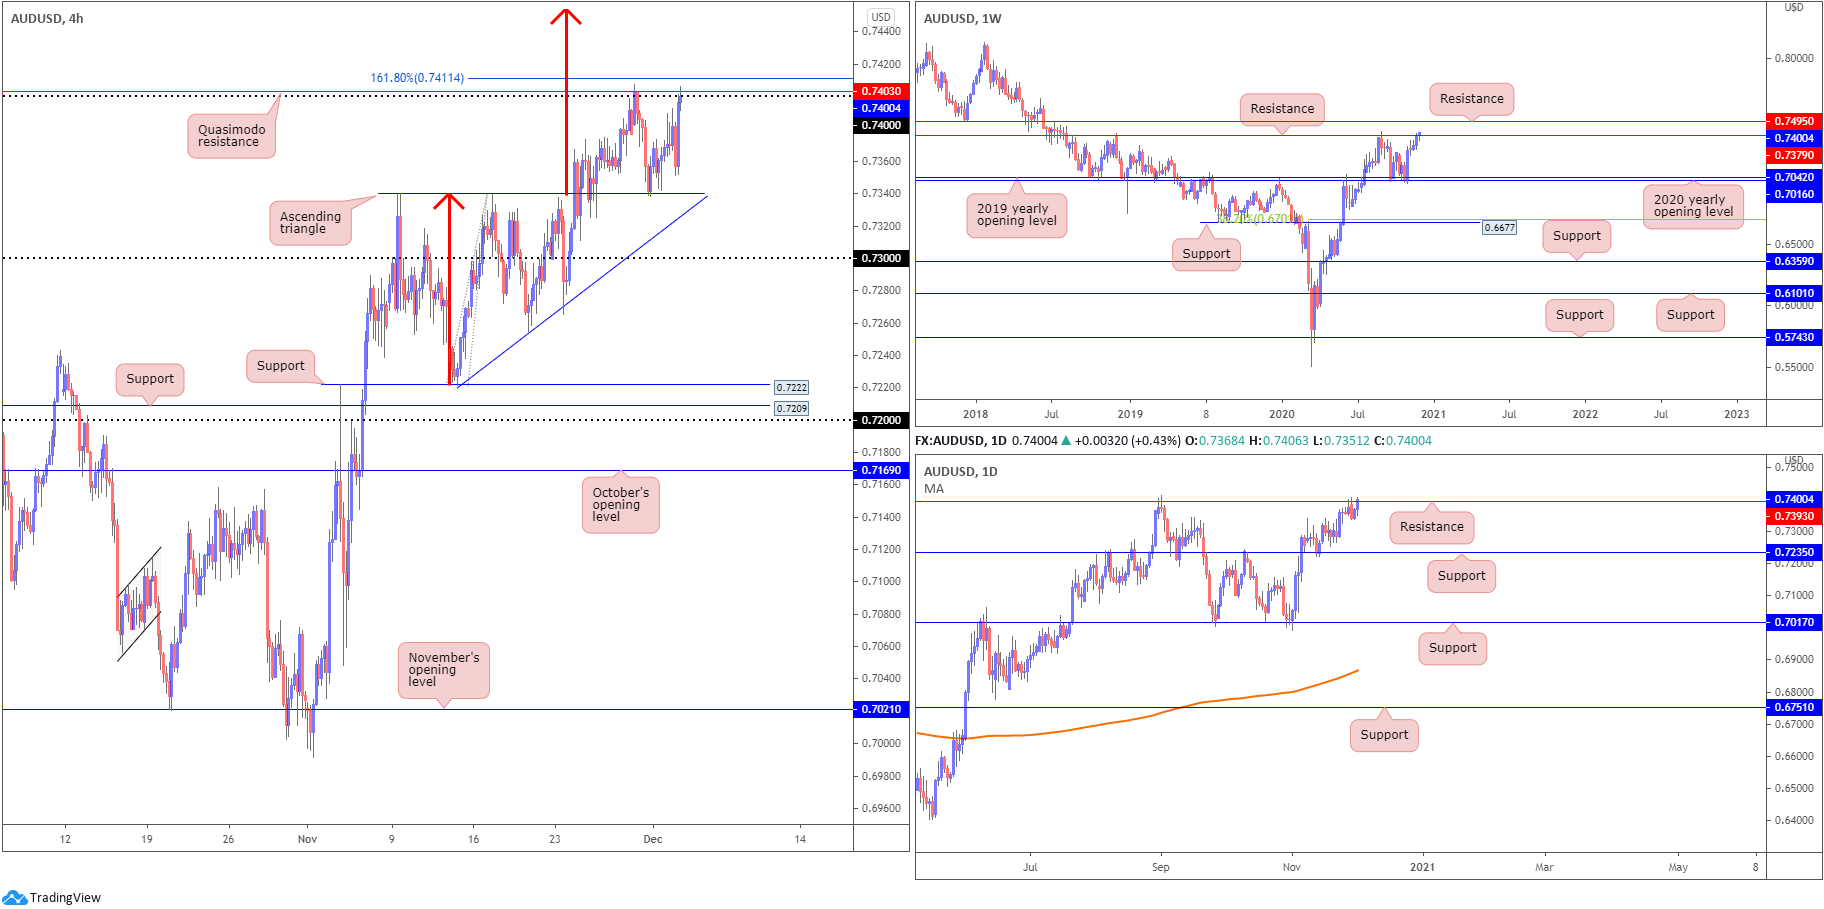
Recent trade retested 0.7340, the upper boundary of a H4 ascending triangle pattern, and challenged the underside of the 0.74 handle, as well as Quasimodo resistance at 0.7403 (located nearby the 161.8% Fibonacci projection point at 0.7411). Above these resistances, traders may be looking towards the ascending triangle take-profit target (red arrows) at 0.7453.
The weekly timeframe shows resistance in play at 0.7379, a level brought in following a strong showing off the 2020 (0.7016) and 2019 (0.7042) yearly opening values (supports) in early November. In view of this market trending higher since early 2020, buyers may also be eyeballing resistance parked at 0.7495.
Following November 13 retest of support at 0.7235, buyers eventually found some grip and crossed swords with resistance at 0.7393 on Friday (positioned above weekly resistance). This represents a level that has capped upside since December 2018. Given the lack of downside pressure witnessed Tuesday, and Wednesday’s advance, buyers may be looking to clear 0.7393, fuelling the prospect of a rally to weekly resistance mentioned above at 0.7495.
Areas of consideration:
- Buyers long the ascending triangle support at 0.7340 are likely to reduce risk at 0.74. Though knowing the trend in this market has been higher since March of this year, additional buyers could eventually overrun 0.74 and corresponding higher timeframe resistances to tackle the H4 ascending triangle take-profit target (red arrows) at 0.7453.
USD/JPY:
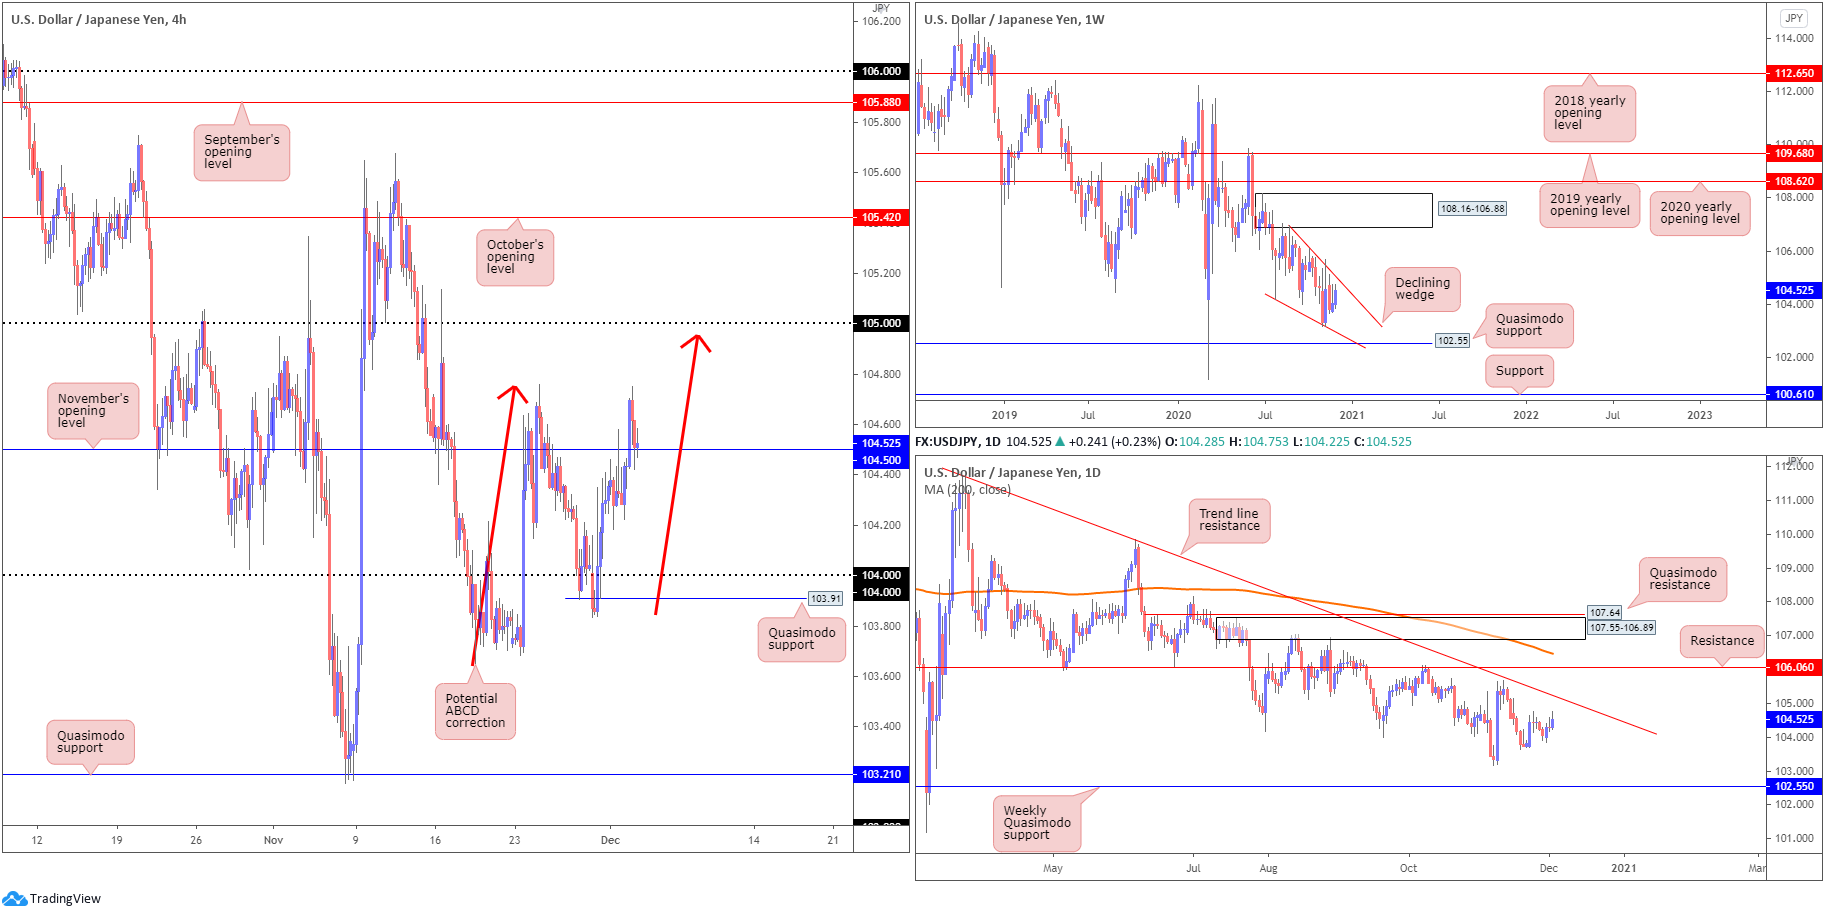
Despite the US dollar index renewing YTD troughs, the US dollar eked out marginal gains against the yen on Wednesday. This, as you can see, carried USD/JPY above November’s opening value at 104.50 on the H4 timeframe to highs at 104.75, with 104.50 currently being retested as support. Dip-buying emerging from this region could eventually deliver a 105 test.
Higher timeframe technical action remains unchanged.
From the weekly timeframe (italics):
Since connecting with the underside of supply at 108.16-106.88 in August, price has gradually shifted lower and developed a declining wedge (106.94/104.18).
Quasimodo support at 102.55 is in the picture this week, with a break revealing support plotted at 100.61. A strong bounce from 102.55 may provide enough impetus for buyers to attempt a breakout above the current declining wedge.
Daily timeframe (italics):
The technical landscape from the daily timeframe reveals scope to close in on trend line resistance, extended from the high 111.71. Sellers taking over, however, could lead price to the 103.17 November 6 low, followed by the noted weekly Quasimodo support at 102.55.
Areas of consideration:
- Possible dip-buying off November’s opening value at 104.50, having seen scope to advance on the bigger picture. Traders may want to acknowledge that 105, a reasonable upside objective on the H4, coincides with the upper boundary of the weekly declining wedge.
USD/CAD:
WTI gains spurring demand for the Canadian dollar and the US dollar index rolling towards 91.00 moderately weighed on USD/CAD Wednesday.
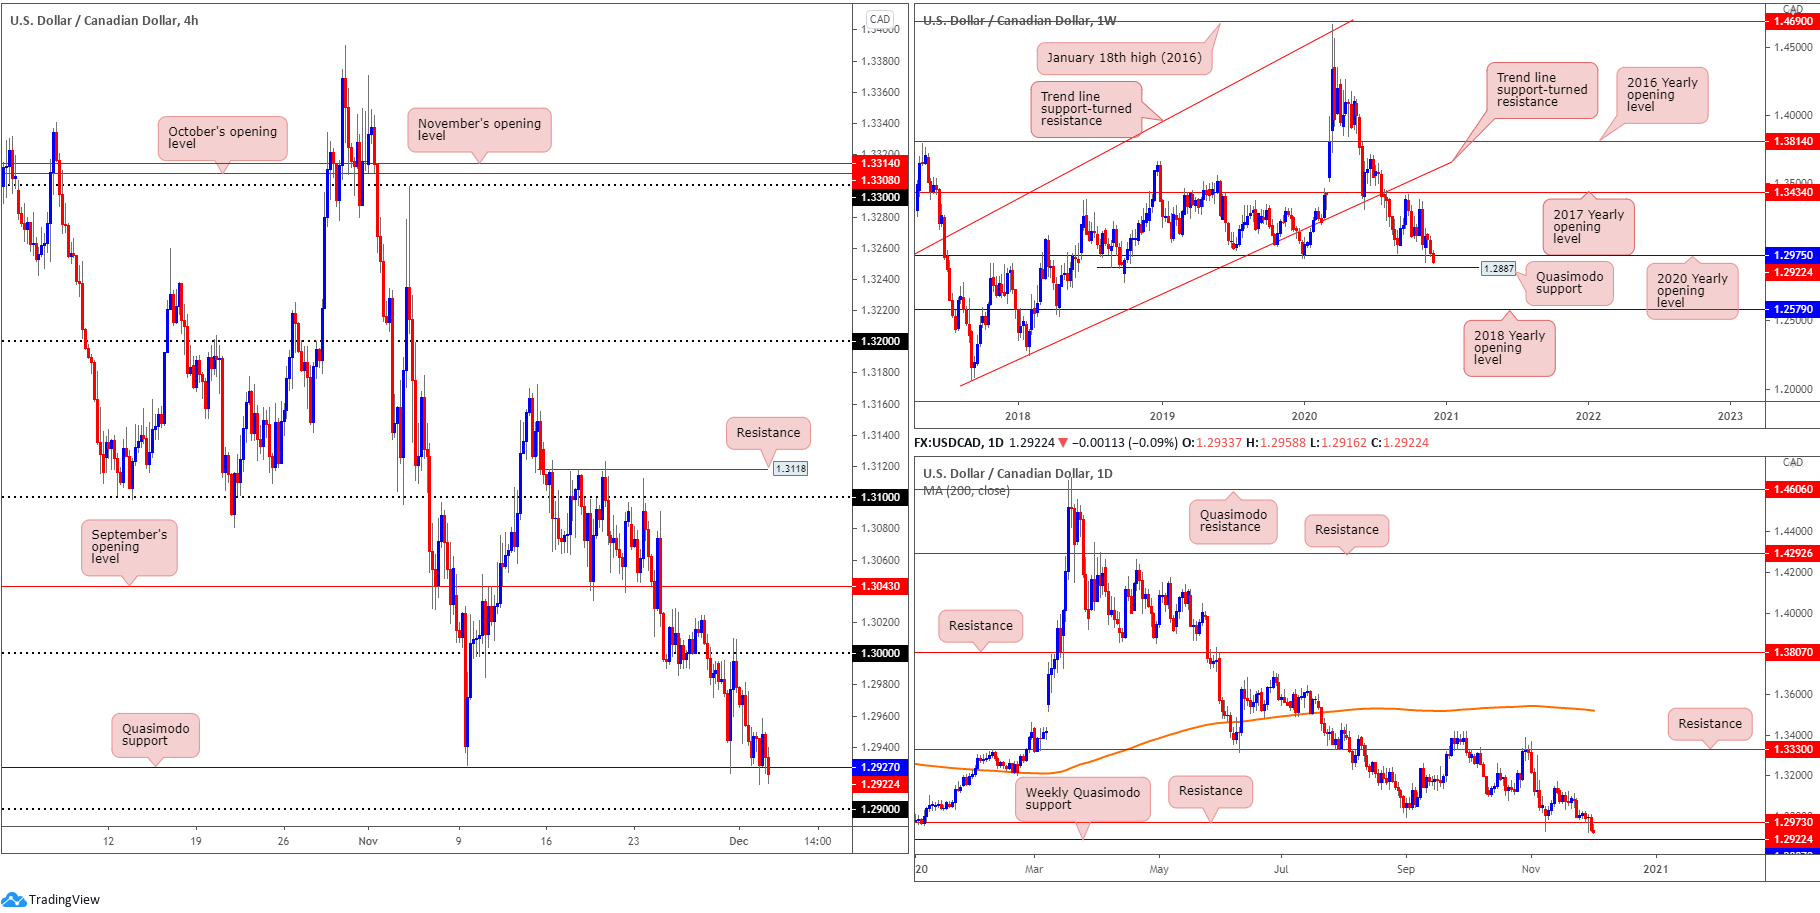
Following a 1.30 rejection at the beginning of the week, H4 Quasimodo support at 1.2927 made an appearance yesterday. Wednesday’s upside attempts, however, were swiftly interrupted around intraday resistance at 1.2948, proposing 1.29 is likely to make a show today.
The 2020 yearly opening value on the weekly timeframe at 1.2975 has come under pressure this week, with price now trading within striking distance of Quasimodo support at 1.2887. One can only imagine the number of stops this move has tripped under December 31 (2019) 1.2951 low.
By the same token, the daily timeframe also reveals support at 1.2973 (essentially the same area as weekly support) was taken out (now potential resistance), suggesting weekly Quasimodo support mentioned above at 1.2887 is likely to make it into the fight today.
Areas of consideration:
Outlook unchanged.
- The current downtrend, along with higher timeframe supports giving way, suggests H4 Quasimodo support at 1.2927 may be soft.
- 29 calls for attention should 1.2927 yield. 1.29, technically speaking, shapes strong support confluence in light of its close connection with higher timeframe support around 1.2887.

USD/CHF:
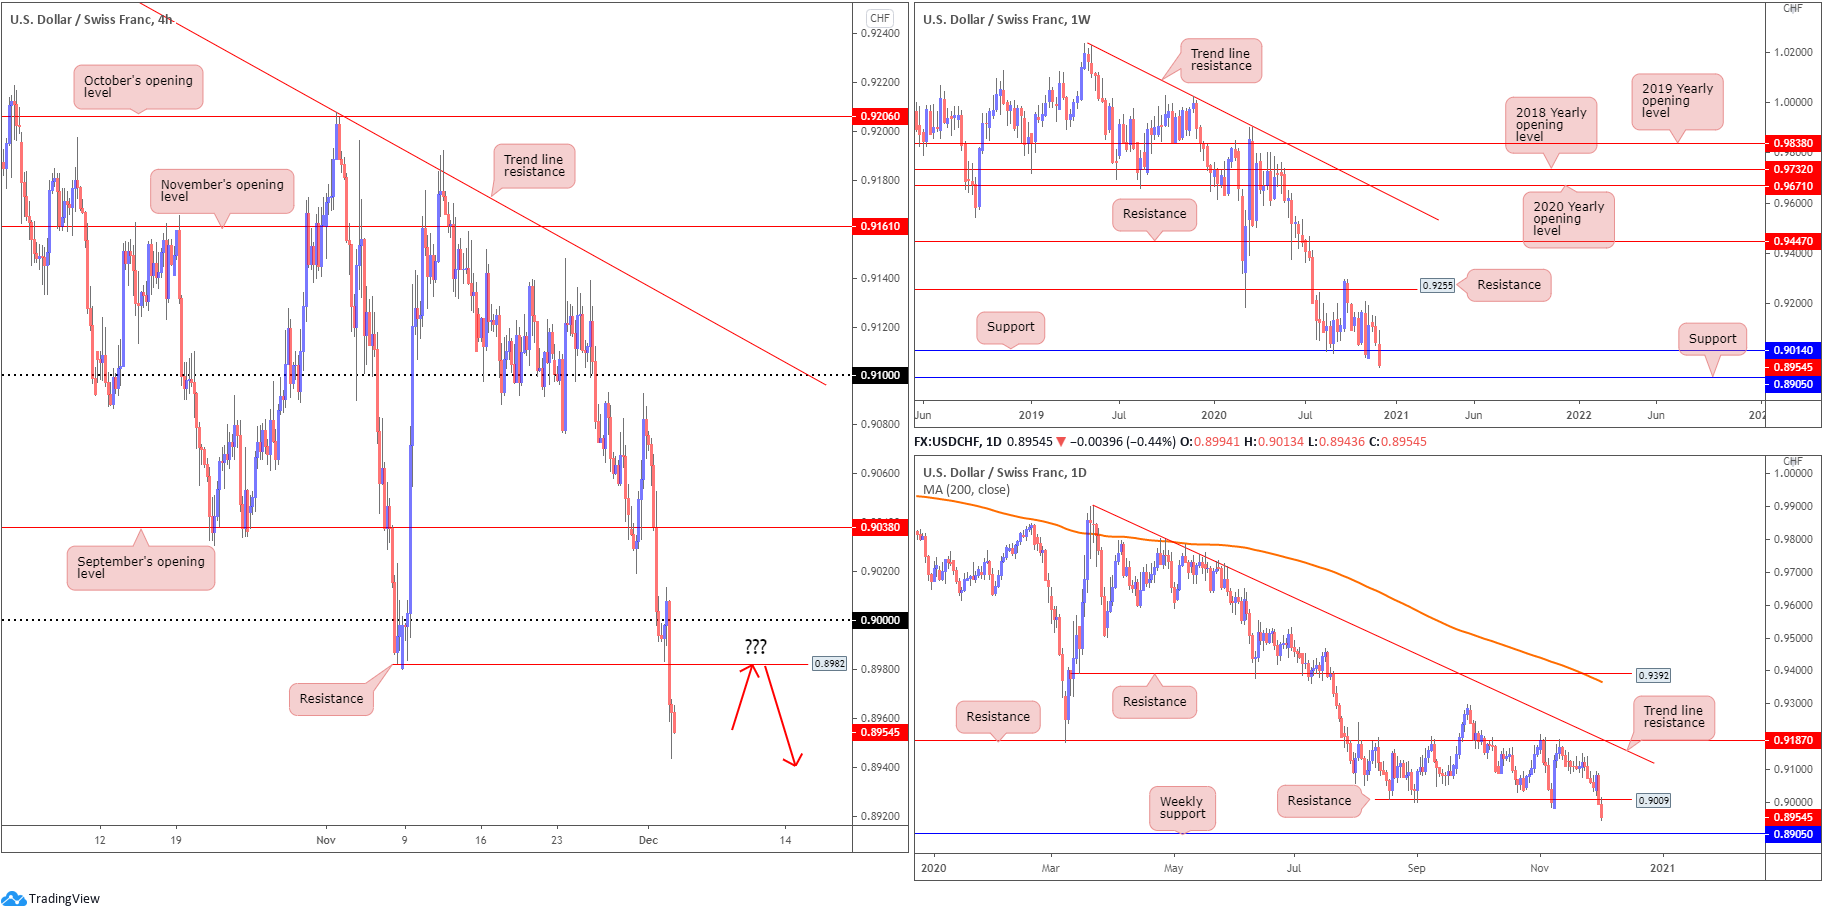
Hand in hand with the US dollar index registering YTD troughs, USD/CHF rejected highs at 0.9013 going into London hours on Wednesday, likely aided by the key figure 0.90 standing in as resistance. The subsequent downbeat tone also flushed out orders from H4 Quasimodo support at 0.8982, now representing potential resistance. Interestingly, sellers, according to the H4 timeframe, have room to stretch as far south as the 0.89 handle.
From the weekly timeframe, support at 0.9014 appears to have been drained, with additional selling to perhaps shake hands with support coming in at 0.8905. A similar picture is visible on the daily timeframe, following the break of support at 0.9009, consequently positioning sellers within close range of weekly support mentioned above at 0.8905.
Areas of consideration:
- 90 offering resistance, along with nearby H4 Quasimodo support at 0.8982 caving in, is considered a bearish cue, with sellers likely to hone in on the 0.89 handle, clipped together with weekly support at 0.8905.
- Retesting 0.8982 is a possible scenario that may attract fresh sellers (red arrows), with 0.89 targeted.
Dow Jones Industrial Average:
US equity benchmarks finished Wednesday mixed, as investors digested bleak ADP private jobs data and vaccine developments. The Dow Jones Industrial Average added 59.87 points, or 0.20%; the S&P 500 traded higher by 6.56 points, or 0.18% while the Nasdaq dipped by 5.74 points, or 0.05%.
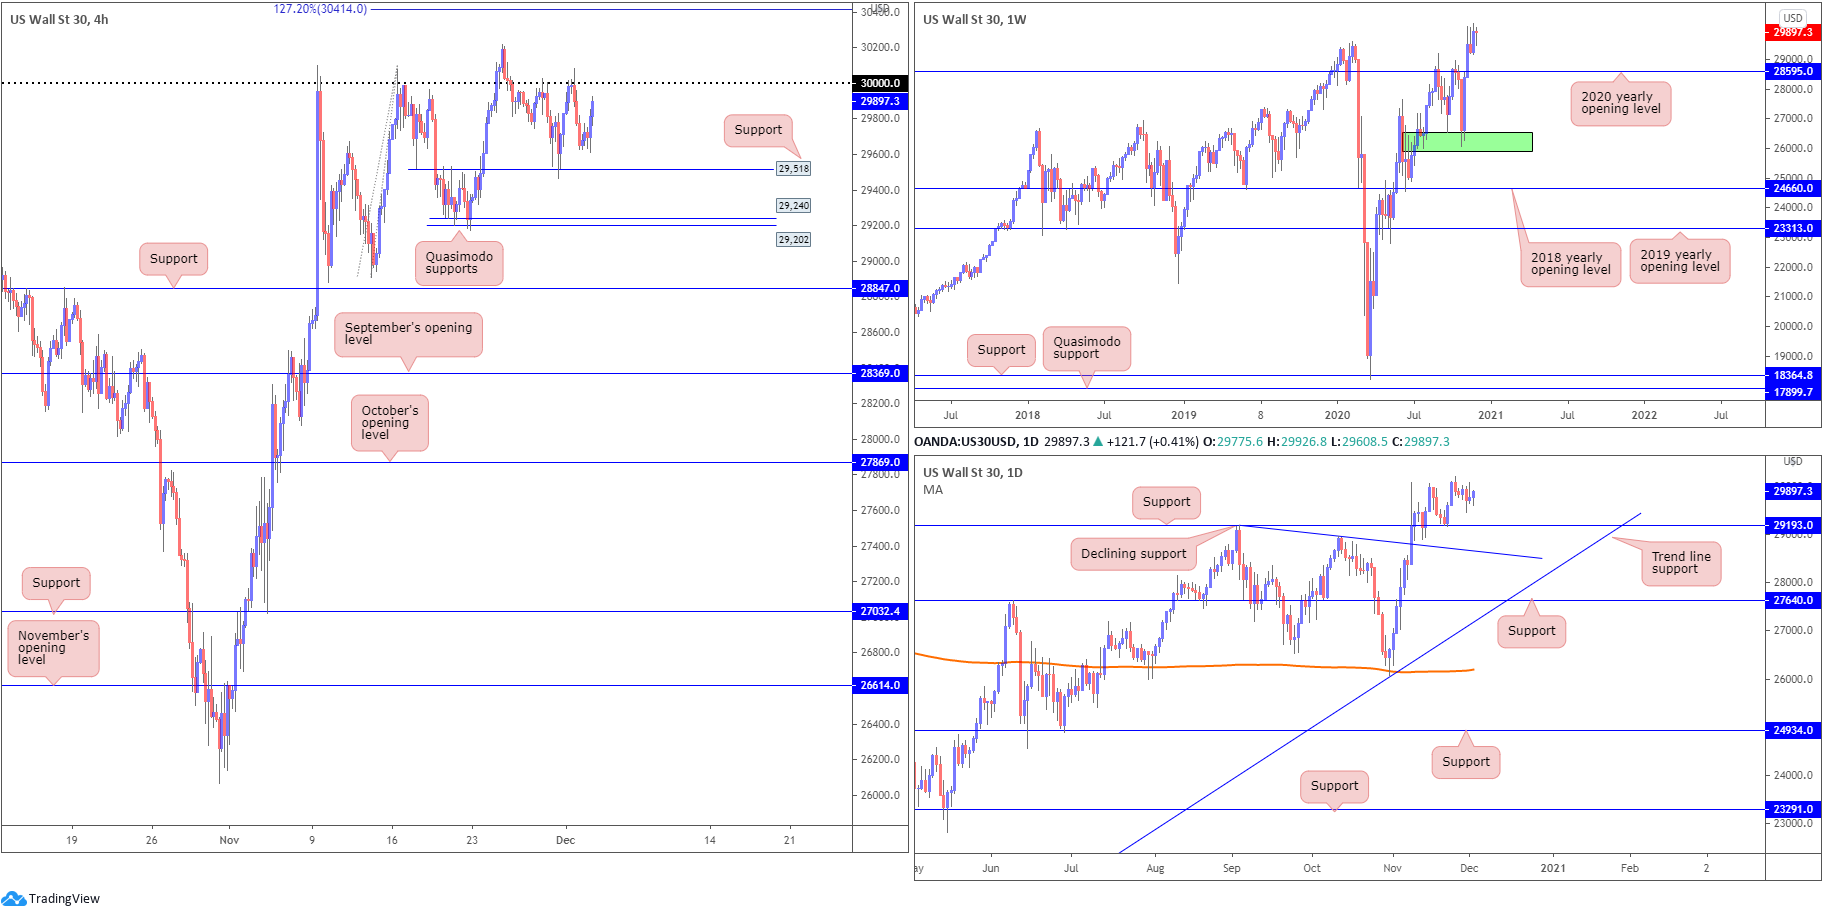
The widely watched 30,000 figure on the H4 remains centre stage, technically speaking. The level capped upside heading into last week’s close and again on Tuesday this week. H4 support at 29,518 also remains a key level to be mindful of, having seen buyers defend this region at the beginning of the week. However, it should be noted Quasimodo supports at 29,202 and 29,240 are likely to call for attention should buyers give up on 29,518.
The weekly timeframe remains lingering around all-time peaks at 30,217. In the event a correction materialises, the 2020 yearly opening value from 28595 could be an area dip-buyers find interest in. According to the daily timeframe, however, support is seen at 29,193, positioned above a declining support, taken from the high 29,193 (merges closely with 28595 on the weekly scale).
Areas of consideration:
- Having recently witnessed fresh all-time highs, dip-buyers off H4 support at 29,518 may still be active, despite the 30,000 rejection. Should 30,000 make its way back into the fray once again today, a break higher may see all-time peaks at 30,217 challenged, with subsequent buying to possibly reach for the 127.2% Fibonacci projection point at 30,414.
- Crossing back above 30,000 may also ignite breakout strategies.
XAU/USD (GOLD):
XAU/USD bulls remained in the driving seat on Wednesday, seeking higher ground on the back of a soft USD.
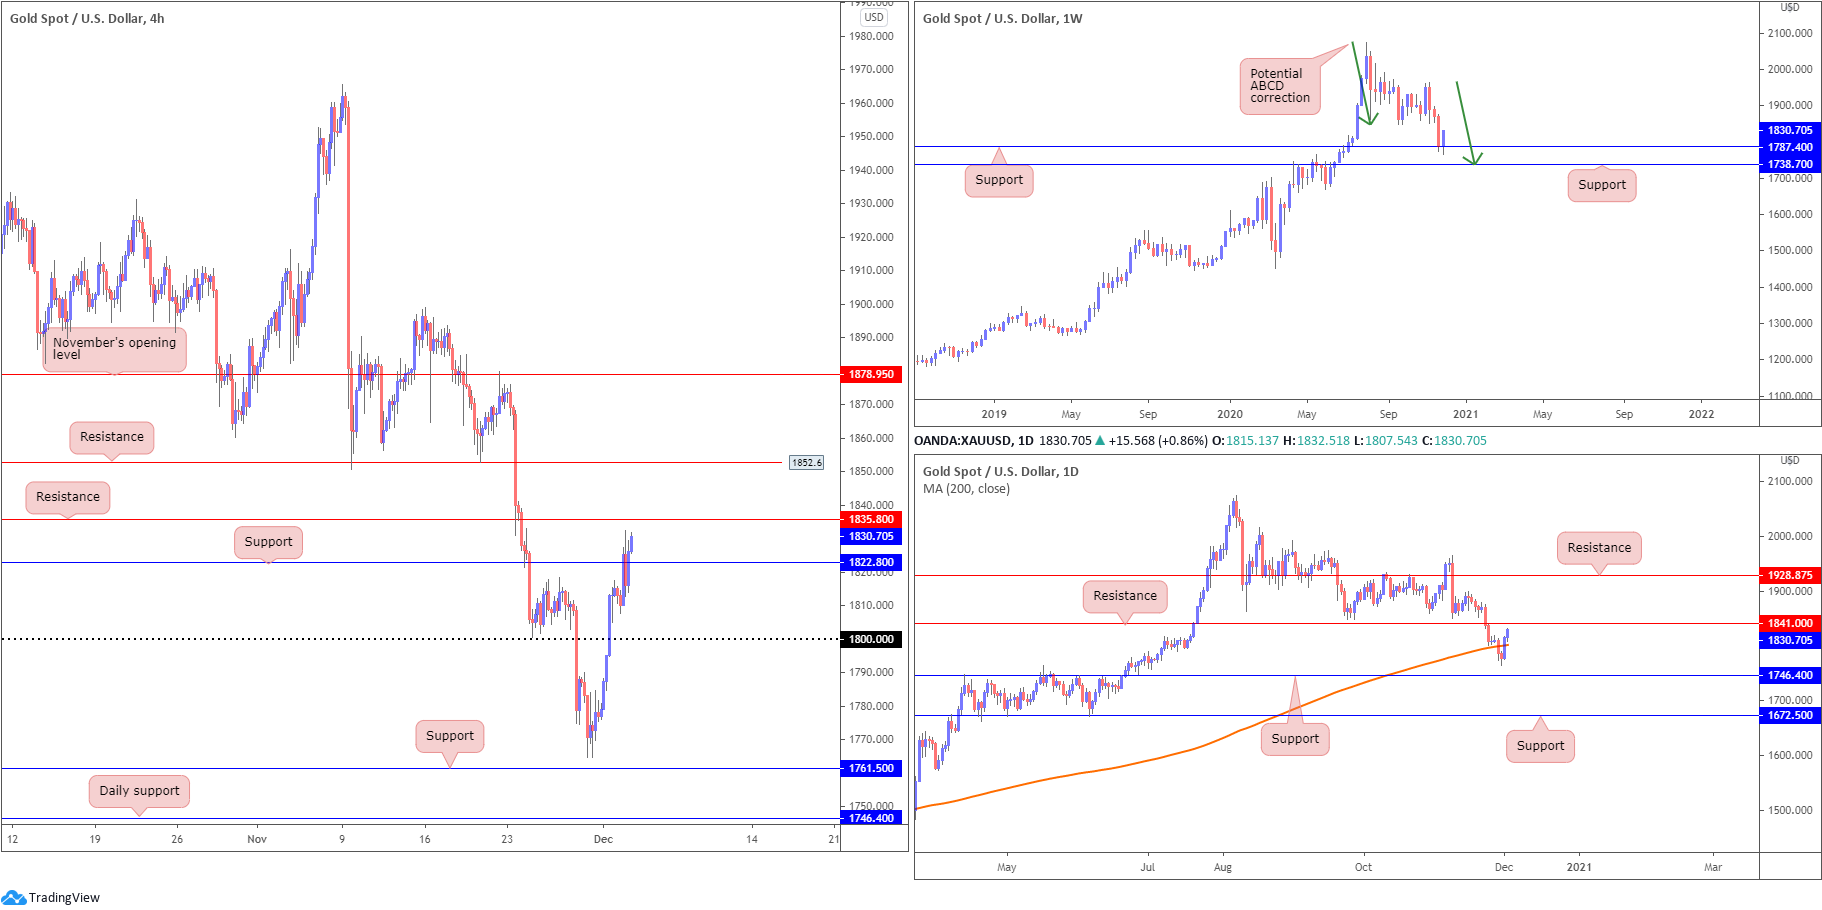
The weekly timeframe reveals the prospects of further buying materialising, following the retest of support at $1,787 (sited ahead of another support at $1,738 and a potential ABCD correction [green arrows]). The fact the yellow metal has been decisively trending higher since the beginning of 2016 adds to a bullish narrative off $1,787.
Meanwhile, on the daily chart, we can see buyers conquered the 200-day SMA (orange – $1,801) Tuesday and extended a bullish position north of the dynamic value on Wednesday. Resistance at $1,841 is now in close range. A break of here, together with the recent move above the 200-day SMA, would help further confirm the weekly timeframe’s bullish vibe.
Across the page on the H4 scale, $1,800 resistance was taken on Tuesday, leaving Wednesday free to overthrow resistance at $1,822 (now possible support). Another layer of resistance is visible nearby at $1,835, with a break exposing resistance at $1,852. In between these two levels, however, traders must acknowledge daily resistance from $1,841.
Areas of consideration:
- Uptrend remains strong (check weekly timeframe).
- Buyers appear free to take things higher, according to the trend and weekly support at $1,787. H4 buyers are unlikely to commit until resistance at $1,835 is cleared (targeting $1,852 resistance), though H4 buyers may also want to take into account daily resistance resides at $1,841.
The accuracy, completeness and timeliness of the information contained on this site cannot be guaranteed. IC Markets does not warranty, guarantee or make any representations, or assume any liability regarding financial results based on the use of the information in the site.
News, views, opinions, recommendations and other information obtained from sources outside of www.icmarkets.com.au, used in this site are believed to be reliable, but we cannot guarantee their accuracy or completeness. All such information is subject to change at any time without notice. IC Markets assumes no responsibility for the content of any linked site.
The fact that such links may exist does not indicate approval or endorsement of any material contained on any linked site. IC Markets is not liable for any harm caused by the transmission, through accessing the services or information on this site, of a computer virus, or other computer code or programming device that might be used to access, delete, damage, disable, disrupt or otherwise impede in any manner, the operation of the site or of any user’s software, hardware, data or property