Articles

USD/CAD: Loonie to start 2021 on a strong commodity note, fade as the US economy recovers
100398 December 31, 2020 22:02 FXStreet Market News
Pandemic risk premium extraction dominated USD/CAD price trading in 2020 but ended in July at 1.3400. Weak US employment data in November and December along with the inability of the US Congress to pass a second stimulus bill to that point were the deciding factors in the drop of the USD/CAD through the two-year support at 1.2960 in early December. Joseph Trevisani, an Analyst at FXStreet, justifies the Canadian dollar strength but forecasts a USD/CAD recovery towards 1.3400 in the second half of the next year.
Key quotes
“Continued commodity price strength, equivocal US economic statistics and Fed rate repression will keep the USD/CAD weak during the first half of 2021.”
“Despite the pressure on the USD/CAD in the first half of the year its decline will be relatively shallow due to the evolving and limiting circumstances of the second-half recovery.”
“If the pandemic is defeated by the end of the second quarter, a notable if, then the second half of the year could be a party. The combination of psychological and practical relief from the pandemic, returning jobs and wages could give two or even three-quarters of 5% annualized growth. Were that or something akin to happen, the expansion would drive US yields higher, regardless of the Fed, though restrained by their intervention and US statistics would reflect the expansion. The USD/CAD would accrue the benefits to 1.3400.”
Full Article
US: Weekly Initial Jobless Claims decline to 787K vs 833K expected
100397 December 31, 2020 21:45 FXStreet Market News
- Weekly Initial Jobless Claims in the US fell by 19,000 last week.
- US Dollar Index continues to move sideways near 89.60.
There were 787,000 initial claims for unemployment benefits in the US during the week ending December 26, the data published by the US Department of Labor (DOL) revealed on Thursday. This reading followed the previous print of 806,000 (revised from 803,000) and came in better than analysts’ estimate of 833,000.
Market reaction
The US Dollar Index largely ignored this report and was last seen losing 0.05% on a daily basis at 89.63.
Additional takeaways
“The 4-week moving average was 836,750, an increase of 17,750 from the previous week’s revised average.”
“The advance seasonally adjusted insured unemployment rate was 3.6% for the week ending December 19, unchanged from the previous week’s unrevised rate.”
“The advance number for seasonally adjusted insured unemployment during the week ending December 19 was 5,219,000, a decrease of 103,000 from the previous week’s revised level.”
Full Article
United States Initial Jobless Claims came in at 787K below forecasts (833K) in December 25
100396 December 31, 2020 21:45 FXStreet Market News
US dollar index (DXY) fades recent bounces off 32-month low while receding to 89.60 during the early Thursday. In doing so, the greenback gauge reverses the recovery gains from the multi-month low, marked during the Asian session, amid failures to cross the immediate resistance line.
Full Article
United States Continuing Jobless Claims registered at 5.219M, below expectations (5.39M) in December 18
100395 December 31, 2020 21:45 FXStreet Market News
US dollar index (DXY) fades recent bounces off 32-month low while receding to 89.60 during the early Thursday. In doing so, the greenback gauge reverses the recovery gains from the multi-month low, marked during the Asian session, amid failures to cross the immediate resistance line.
Full Article
United States Initial Jobless Claims 4-week average: 836.75K (December 25) vs 818.25K
100394 December 31, 2020 21:45 FXStreet Market News
US dollar index (DXY) fades recent bounces off 32-month low while receding to 89.60 during the early Thursday. In doing so, the greenback gauge reverses the recovery gains from the multi-month low, marked during the Asian session, amid failures to cross the immediate resistance line.
Full Article
US weekly initial jobless claims 787K vs 835K expected
100393 December 31, 2020 21:33 Forexlive Latest News Market News
Weekly US initial jobless claims data
- Prior was 803K
- Continuing claims 5219K vs 5390K expected
- Prior continuing claims 5337K
This is for the week ending December 26, which is obviously impacted by holidays and very tough to forecast because of that. I wouldn’t take a signal from the data until January, when the work week gets back to normal.
Full Article
EUR/USD retreats further from multi-year tops, slides to 1.2260
100392 December 31, 2020 21:29 FXStreet Market News
- EUR/USD witnessed some profit-taking amid year-end thin liquidity conditions.
- A bearish sentiment around the USD should help limit any corrective pullbacks.
The EUR/USD pair edged lower during the second half of the European session and dropped to fresh session lows, around the 1.2260 region in the last hour.
Having struggled to find acceptance above the 1.2300 mark, the pair witnessed some selling and eroded a part of the previous day’s positive move to fresh 32-month tops. The pullback lacked any obvious fundamental catalyst and could be solely attributed to some profit-taking. Typical thin trading volumes on the last day of the year prompted investors to lighten their bullish bets, though the downside seems limited amid the underlying bearish sentiment around the US dollar.
Investors have been betting on a strong global economic recovery in 2021. This, along with the likelihood of additional US financial aid package, dragged the key USD Index to the lowest level since April 2018. Apart from this, expectations that the Fed will keep rates lower for a longer period and the prevalent risk-on environment should continue to undermine the safe-haven greenback.
Valeria Bednarik, FXStreet’s Chief Analyst explains: “Reaching pre-pandemic employment levels is outside the foreseeable future, while inflation does not even worth mentioning. Depressed consumption will likely keep it subdued for longer than the most pessimistic central banks’ estimates. Anyway, optimism reigns in the wider perspective and despite the market’s turmoil that spurs safe-haven demand here and there.”
Even from a technical perspective, this week’s breakout through a symmetrical triangle – part of a bullish pennant formation – might have already set the stage for a further appreciating move. Hence, any meaningful dip might be seen as a buying opportunity. This makes it prudent to wait for strong follow-through selling before confirming that the EUR/USD pair has topped out in the near-term.
Technical levels to watch
Full Article
Chile Industrial Production (YoY) down to -0.7% in November from previous 3.5%
100391 December 31, 2020 21:17 FXStreet Market News
US dollar index (DXY) fades recent bounces off 32-month low while receding to 89.60 during the early Thursday. In doing so, the greenback gauge reverses the recovery gains from the multi-month low, marked during the Asian session, amid failures to cross the immediate resistance line.
Full Article
Russia Central Bank Reserves $ fell from previous $593.6B to $592.4B
100390 December 31, 2020 21:17 FXStreet Market News
US dollar index (DXY) fades recent bounces off 32-month low while receding to 89.60 during the early Thursday. In doing so, the greenback gauge reverses the recovery gains from the multi-month low, marked during the Asian session, amid failures to cross the immediate resistance line.
Full Article
USD/CAD bounces off two-week lows, turns flat around mid-1.2700s
100389 December 31, 2020 20:45 FXStreet Market News
- A softer USD exerted some pressure and dragged USD/CAD to two-week lows on Thursday.
- A modest pullback in crude oil prices undermined the loonie and helped limit deeper losses.
The USD/CAD pair quickly recovered around 20 pips after dropping to fresh two-week lows and was last seen trading in the neutral territory, around mid-1.2700s.
The underlying bullish sentiment around the global equity markets continued exerting pressure on the safe-haven US dollar. This was seen as one of the key factors that dragged the USD/CAD pair lower for the fourth consecutive session on Thursday. However, a modest pullback in oil prices undermined the loonie and helped limit any further losses.
The increasing likelihood of additional US financial aid package and hopes for a strong global economic growth in 2021 remained supportive of increasing appetite for perceived riskier assets. The already stronger risk sentiment got an additional boost after the UK regulators approved the use of AstraZeneca/Oxford coronavirus vaccine on Wednesday.
Meanwhile, worries about the discovery of a new faster-spreading variant of coronavirus and the imposition of strict lockdown/travel restrictions in the UK dampened hopes for a fuel demand recovery. This, in turn, led to some weakness in oil prices, which weighed on the commodity-linked Canadian dollar and extended some support to the USD/CAD pair.
Apart from this, investors refrained from placing any aggressive bets amid typical year-end thin trading volumes. This seemed to be the only factor that assisted the USD/CAD pair to stage a modest bounce from the daily swing lows, around the 1.2730 region. However, any meaningful recovery attempt might still be seen as a selling opportunity and remain capped.
Market participants now look forward to Thursday’s only release of the usual Initial Weekly Jobless Claims from the US. The data is unlikely to provide any meaningful impetus, leaving the USD/CAD pair at the mercy of the USD/oil price dynamics.
Technical levels to watch
Full Article
Polkadot is ready for correction to $7 before another spike to a new all-time high
100387 December 31, 2020 20:45 FXStreet Market News
- Polkadot’s DOT is boosted by Binance support.
- DOT may retreat to $7 and $5.5 before another bullish wave.
DOT broke the previous all-time high at $7 and jumped above the next psychological resistance of $8. At the time of writing, DOT is changing hands at $8.1, having gained over 12% on a day-to-day basis. The token sits at 6th place in the global cryptocurrency market rating with the current market capitalization of $7.3 billion.
Polkadot rivals ETH
DOT started breaking up on December 28, after Binance briefly featured the token on its homepage instead of ETH. The Chinese cryptocurrency and blockchain reporter Colin Wu was the first to notice the change. However, soon afterward, the company removed DOT from the Binance APP homepage.
Polkadot is considered as one of the main ETH rivals. The project is heavily financed by Binance. On December 27, the cryptocurrency trading platform announced the creation of a $10 million fund to support the development of Polkadot.
In October 2020, the head of Pantera Capital said that Polkadot had an excellent chance to stop Ethereum’s domination in the industry of decentralized applications.
According to PolkaProject, there are 325 projects currently deployed on Polkadot blockchain, which is over a 30% increase from September levels.
DOT is ready for a correction
From the technical point of view, DOT broke above the critical resistance of $8. If the upside momentum is sustained, the price may proceed to $10 and potentially $12.
Meanwhile, the TD Sequential indicator is ready to present a sell signal. Currently, it shows a green eight candlestick, meaning that the token may be ripe for a healthy correction. If the signal is confirmed, DOT may retreat towards $7 before the upside is resumed.
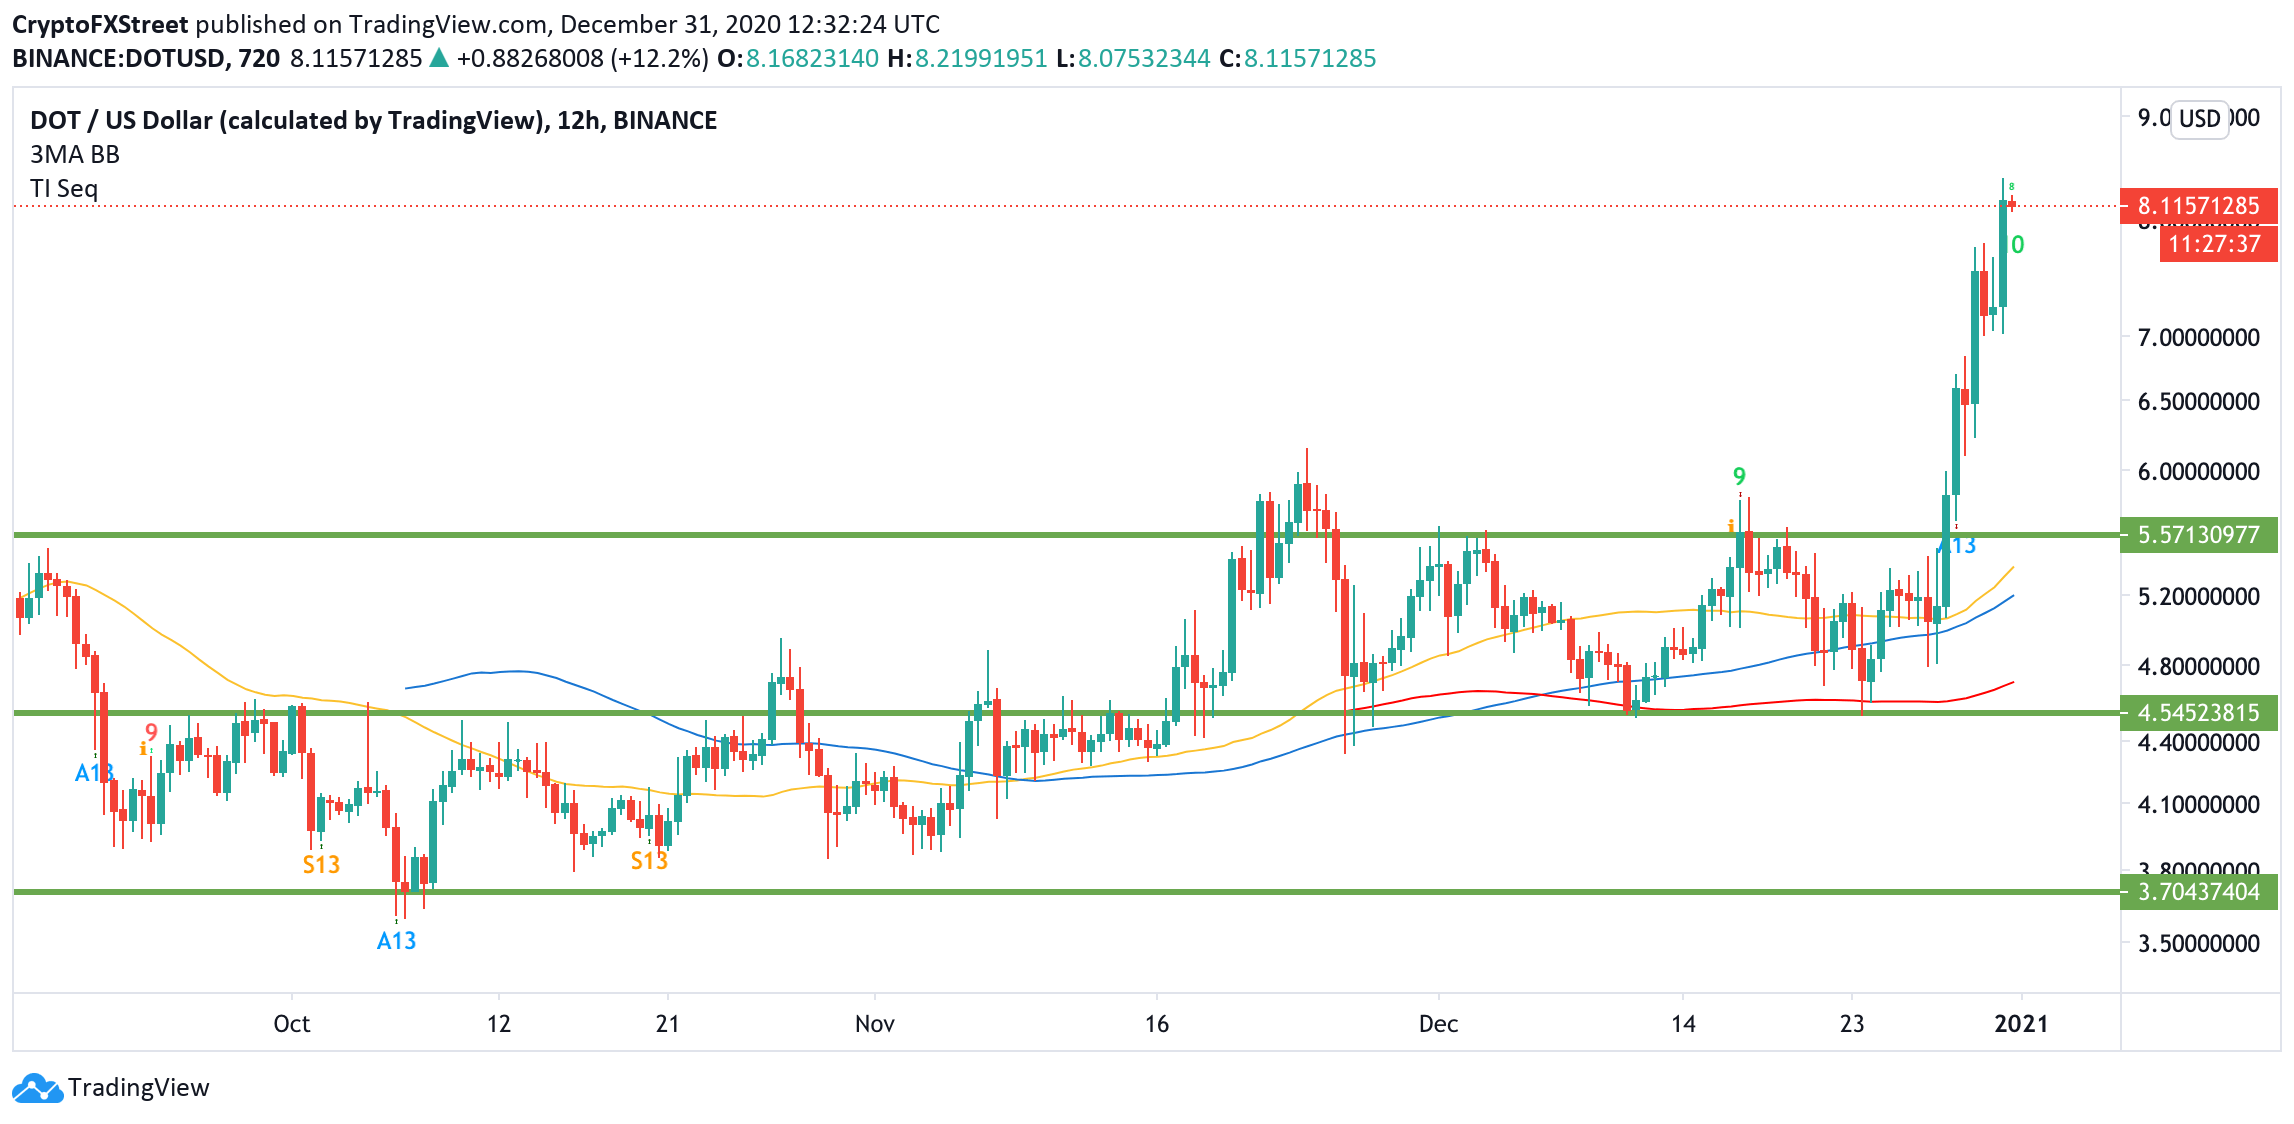
DOT, 12-hour chart
On the other hand, if $7 gives way, the sell-off may be extended to the next critical level of $6.1 (November 24 high) and the previous channel resistance of $5.5. If this barrier is verified as a support, the long-term bullish trend will be confirmed.
Full Article
AUD/USD continues to push higher above 0.7700 into the new year
100386 December 31, 2020 20:45 FXStreet Market News
- AUD/USD extends rally to fresh multi-year highs on Thursday.
- US Dollar ındex stages modest rebound ahead of US data.
Following a brief consolidation phase around 0.7700, the AUD/USD regathered bullish momentum and touched its highest level since April 2018 at 0.7742. As of writing, the pair was up 0.6% on a daily basis at 0.7730.
Thin trading conditions ahead of the New Year holiday seem to be causing the volatility to increase in short bursts. Nevertheless, financial markets are largely expected to turn subdued during the American trading hours and AUD/USD could struggle to make a decisive move in either direction until next week.
Later in the day, the US Department of Labor will publish its weekly Initial Jobless Claims data. Meanwhile, the US Dollar Index is flat on the day at 89.68.
AUD/USD 2021 outlook
AUD/USD Price Forecast 2021: Winning the covid crisis insufficient for the aussie to withstand Chinese boomerang.
“The weekly chart provides a big-picture view of AUD/USD movements and the critical levels to watch out for. The Aussie has surpassed both the 50-week and 200-week Simple Moving Averages for the first time since early 2018, a bullish sign,” notes FXStreet Analyst Yohay Elam. “On the other hand, it is entering overbought territory – a Relative Strength Index of 70 or higher – on the weekly chart, thus indicating a substantial correction.”