Articles
Monday 1st February: Weekly Technical Outlook and Review
108749 January 30, 2021 22:49 ICMarkets Market News
Key risk events today:
UK Final Manufacturing PMI; Canada Manufacturing PMI; US ISM Manufacturing PMI.
(Previous analysis as well as outside sources – italics).
EUR/USD:
Weekly gain/loss: -0.31%
Weekly close: 1.2132
Weekly perspective:
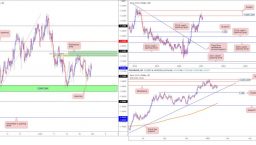
Sellers, as you can see, continue to hold territory south of supply at 1.2420-1.2214. This is an area that boasts healthy downside momentum from its base formed April 2018.
The 2018 yearly opening value at 1.2004 is in the crosshairs as potential support, should sellers make a push this week.
Trend studies reveal upside has remained favoured since price bottomed at 1.0637 in March 2020, movement which eventually overthrew trend line resistance, extended from the high 1.2555. For that reason, long-term dip-buyers may surface from 1.2004 if tested.
Daily perspective:
Resistance at 1.2165—an active S/R level since June 2010—has played an important role in capping buyers since January 21. Should 1.2165 give way this week, supply drawn from 1.2344-1.2279 (nestled within the walls of weekly supply mentioned above at 1.2420-1.2214) could work its way back into the spotlight.
Lower on the curve, however, trend line support, taken from the low 1.0774, is seen, plotted just north of support at 1.1965, a previous Quasimodo resistance level.
H4 perspective:
After Friday retested the 1.21 figure and formed a bullish pivot reversal, Europe’s shared currency managed to remain on the front foot against the US dollar. This followed Wednesday’s hammer pattern, a move that whipsawed through 1.21 into the jaws of H4 demand at 1.2040-1.2064.
Any sustained move north of 1.21 throws H4 resistance at 1.22-1.2180 (composed of the 1.22 figure and a collection of Fibonacci ratios) back into the mix. Further buying may also shine the torch on January’s opening value at 1.2239.
Areas of consideration:
- Trend: higher since the beginning of 2020.
- 21 (support) based on the H4 timeframe, though offers limited confluence.
- 22-1.2180 has proven itself in January as resistance on the H4.
- The round number 1.22 and lower edge of weekly supply at 1.2214 is a resistance zone that may enter play sometime this week.
- Daily resistance at 1.1265, although in isolation on the daily scale, is planted just south of resistance at 1.22-1.2180 on the H4.
GBP/USD:
Weekly gain/loss: +0.12%
Weekly close: 1.3689
Weekly perspective:
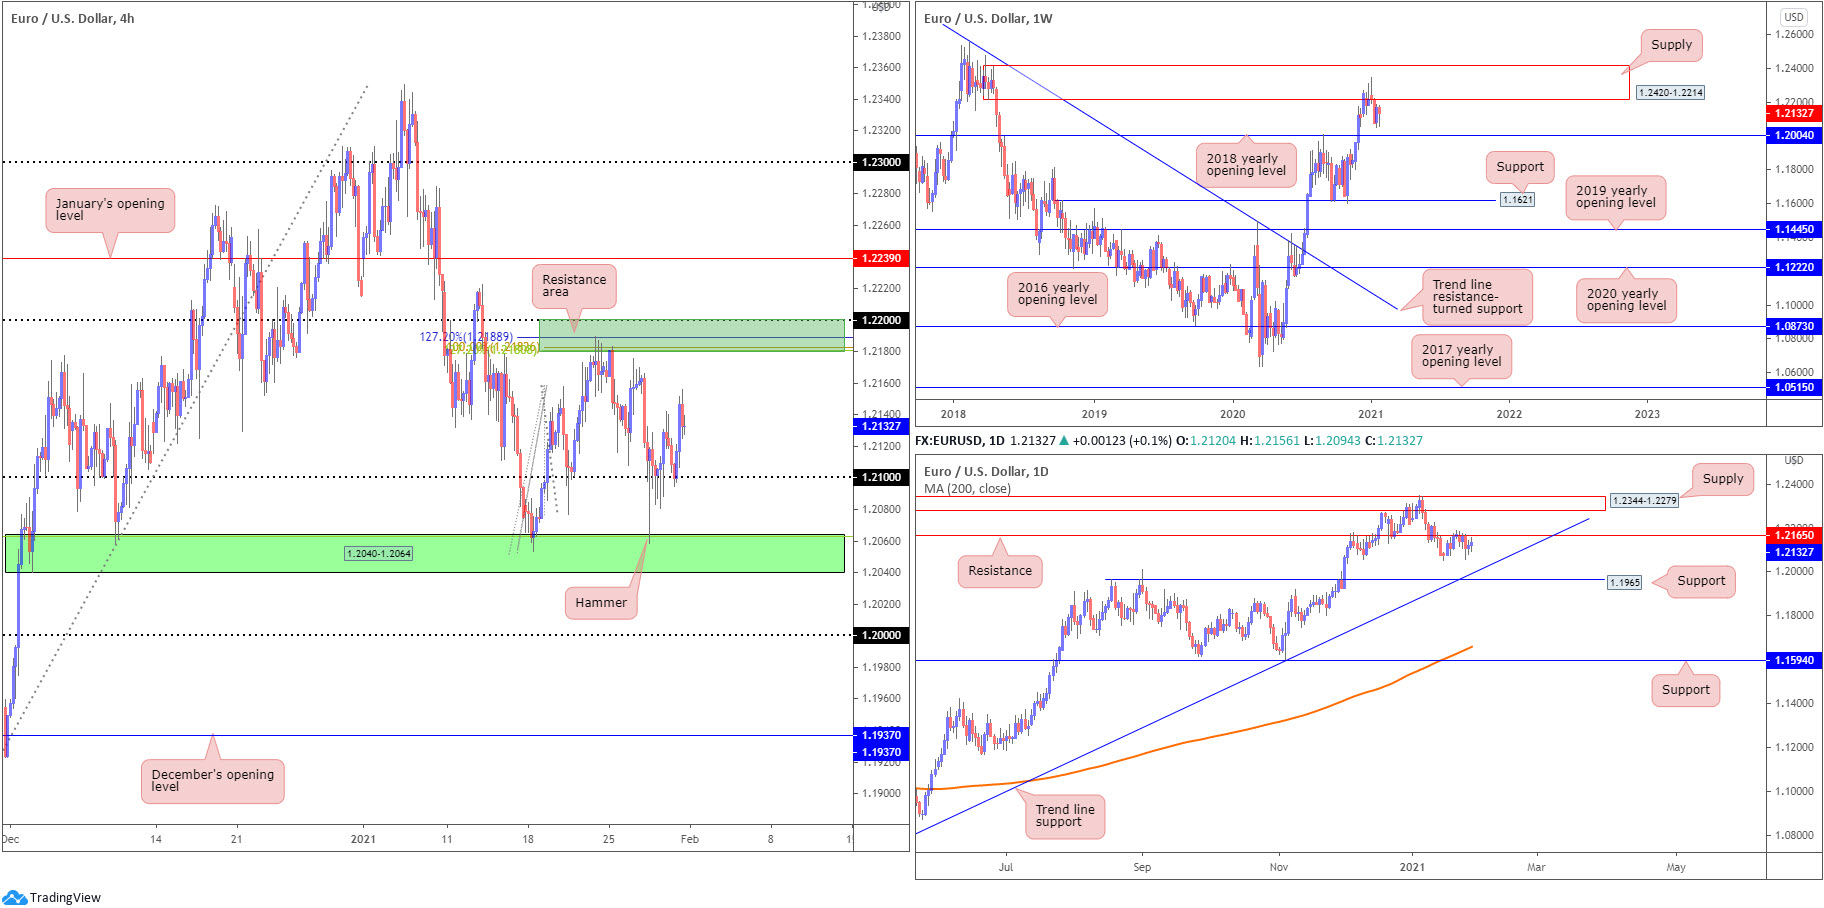
Orbiting fresh 33-month peaks, GBP/USD, although modestly higher last week, formed an indecision doji candle north of 1.3503—the 2018 yearly opening value. In a market trending higher since 2020, this stands long-term buyers in a favourable position, targeting resistance at 1.3847.
As highlighted in previous weekly reports, of technical interest is the recent engulf of 1.3514 (December 9 [2019] high), helping to confirm the current uptrend.
Daily perspective:
Buyers and sellers, once again, finished the week battling for position just south of a resistance level at 1.3763, a previous Quasimodo support level.
Trend line support, taken from the low 1.1409, is a visible downside target; breaking 1.3763, on the other hand, directs attention to the weekly resistance highlighted above at 1.3847.
H4 perspective:
January’s opening value at 1.3646 remains immediate support on the H4 scale, a level that’s proven effective since January 20. Directly overhead, the 1.37 figure has offered soft support/resistance, with focus largely on 1.3750, placed just beneath daily resistance mentioned above at 1.3763. In fact, many technical analysts have labelled the H4 timeframe rangebound between 1.3646 and 1.3750.
Above 1.3763 on the H4 shines the spotlight on the 1.38 figure, with a break possibly setting the stage for subsequent buying towards weekly resistance at 1.3847.
Areas of consideration:
- Trend: higher since 2020.
- Range traders may find use in the H4 timeframe’s consolidation between 1.3750 and 1.3646. Given the uptrend, traders may opt for longs at range support this week.
- Daily resistance at 1.3763 is a worthwhile note, with a break exposing 1.38 on the H4 and then weekly resistance at 1.3847.
AUD/USD:
Weekly gain/loss: -0.95%
Weekly close: 0.7638
Weekly perspective:
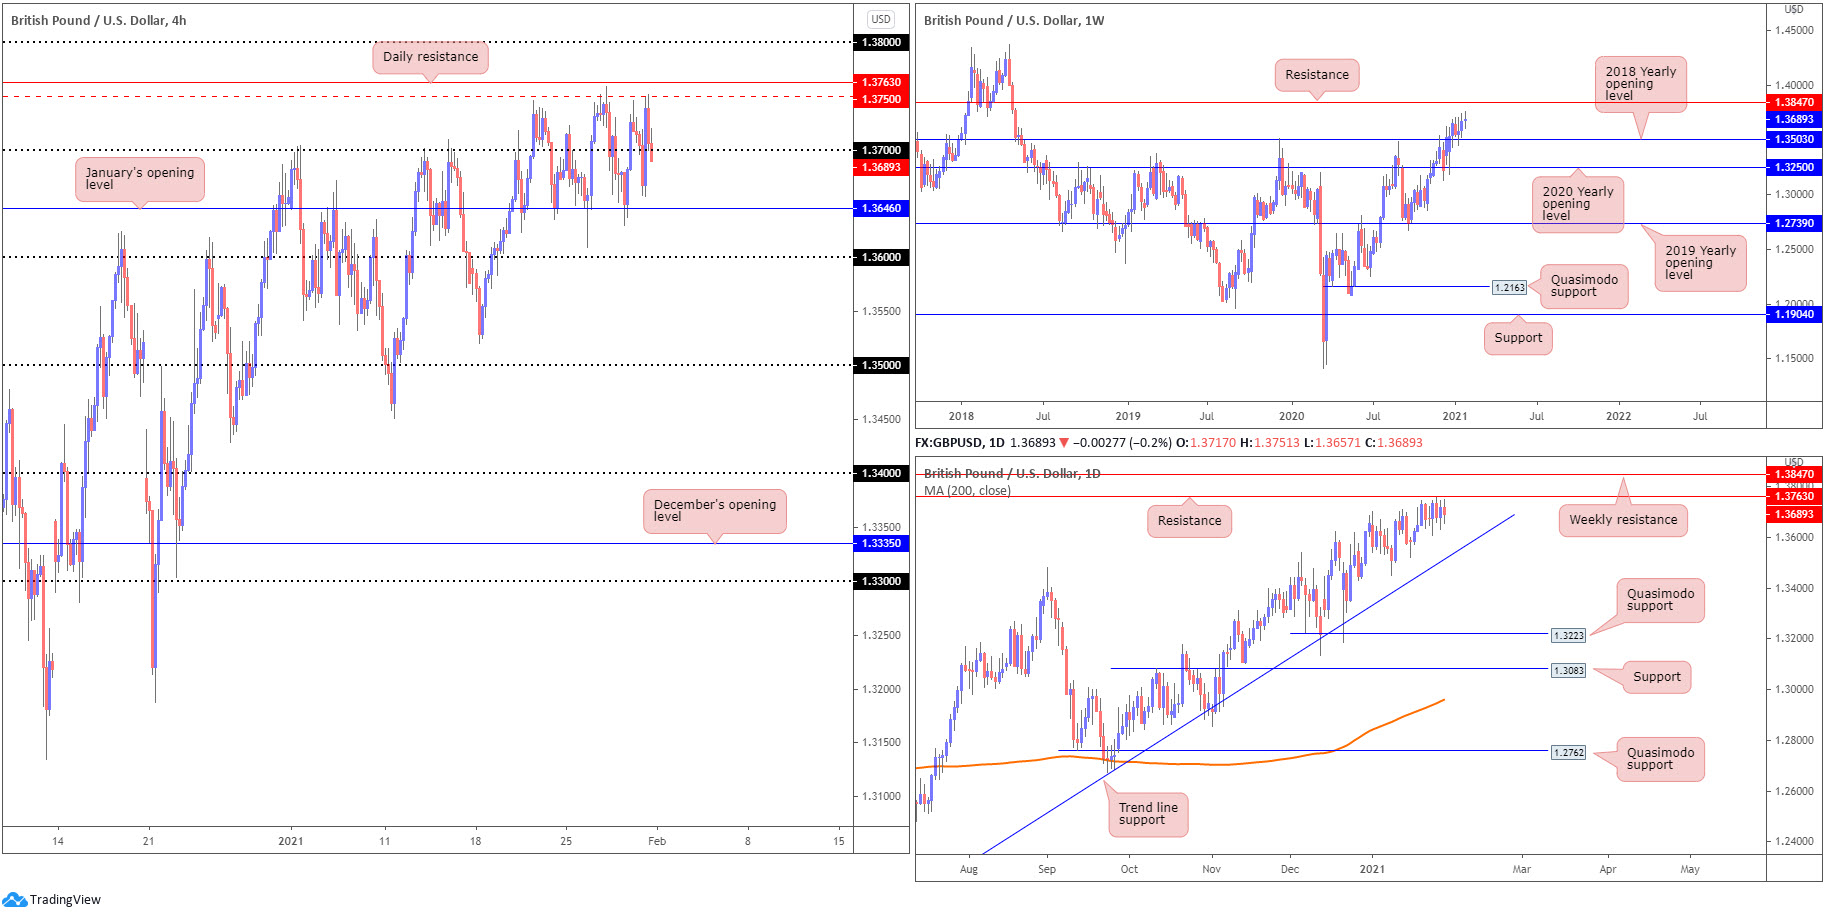
Following the break of Quasimodo resistance at 0.7605, and trend line resistance, taken from the high 1.1080, volatility diminished. That, of course, was until last week. Price reconnected with 0.7605 and, as you can see, dip-buyers made an appearance.
The 0.7605 level welcoming the retest, in a market trending higher, may tempt additional buying this week.
Daily perspective:
The outlook on the daily timeframe offers a somewhat less optimistic vibe.
Support at 0.7655 was retested in the second half of the week, in which buyers demonstrated some interest on Thursday. However, trade rolled out a sour tone Friday and has possibly swung the pendulum in favour of a move lower to test trend line support, extended from the low 0.5506.
H4 perspective:
Friday’s risk-averse market weighed on the Australian dollar Friday, aided by the H4 technical pullback that crossed swords with the 0.77 figure (reinforced by January’s opening value at 0.7701 and nearby 50.0% retracement ratio at 0.7704). Additional resistances to note are two Quasimodo formations at 0.7747 and 0.7781, as well as resistance between 0.7810 and 0.7791 (red).
With H4 poised to retest the 0.76 figure, a fakeout through the level is possibly on the cards since daily trend line support is seen just beneath the barrier. Not only would this move daily buyers into action, it could trip stops that may help fuel a recovery.
Areas of consideration:
- Trend: Decisively higher since 2020.
- 76 remains a technical point of interest on the H4. Although merging with weekly support at 0.7605, a fakeout into daily trend line support is a possible scenario. Should daily buyers defend the trend line, this could draw in buyers.
- (H4) 0.77 remains a level to be mindful of, converging with January’s opening value from 0.7701 and a 50.0% retracement level at 0.7704. Other resistances to note, as highlighted above, are the two Quasimodo formations at 0.7747 and 0.7781, as well as resistance between 0.7810 and 0.7791 (red).
USD/JPY:
Weekly gain/loss: +0.94%
Weekly close: 104.67
Weekly perspective:
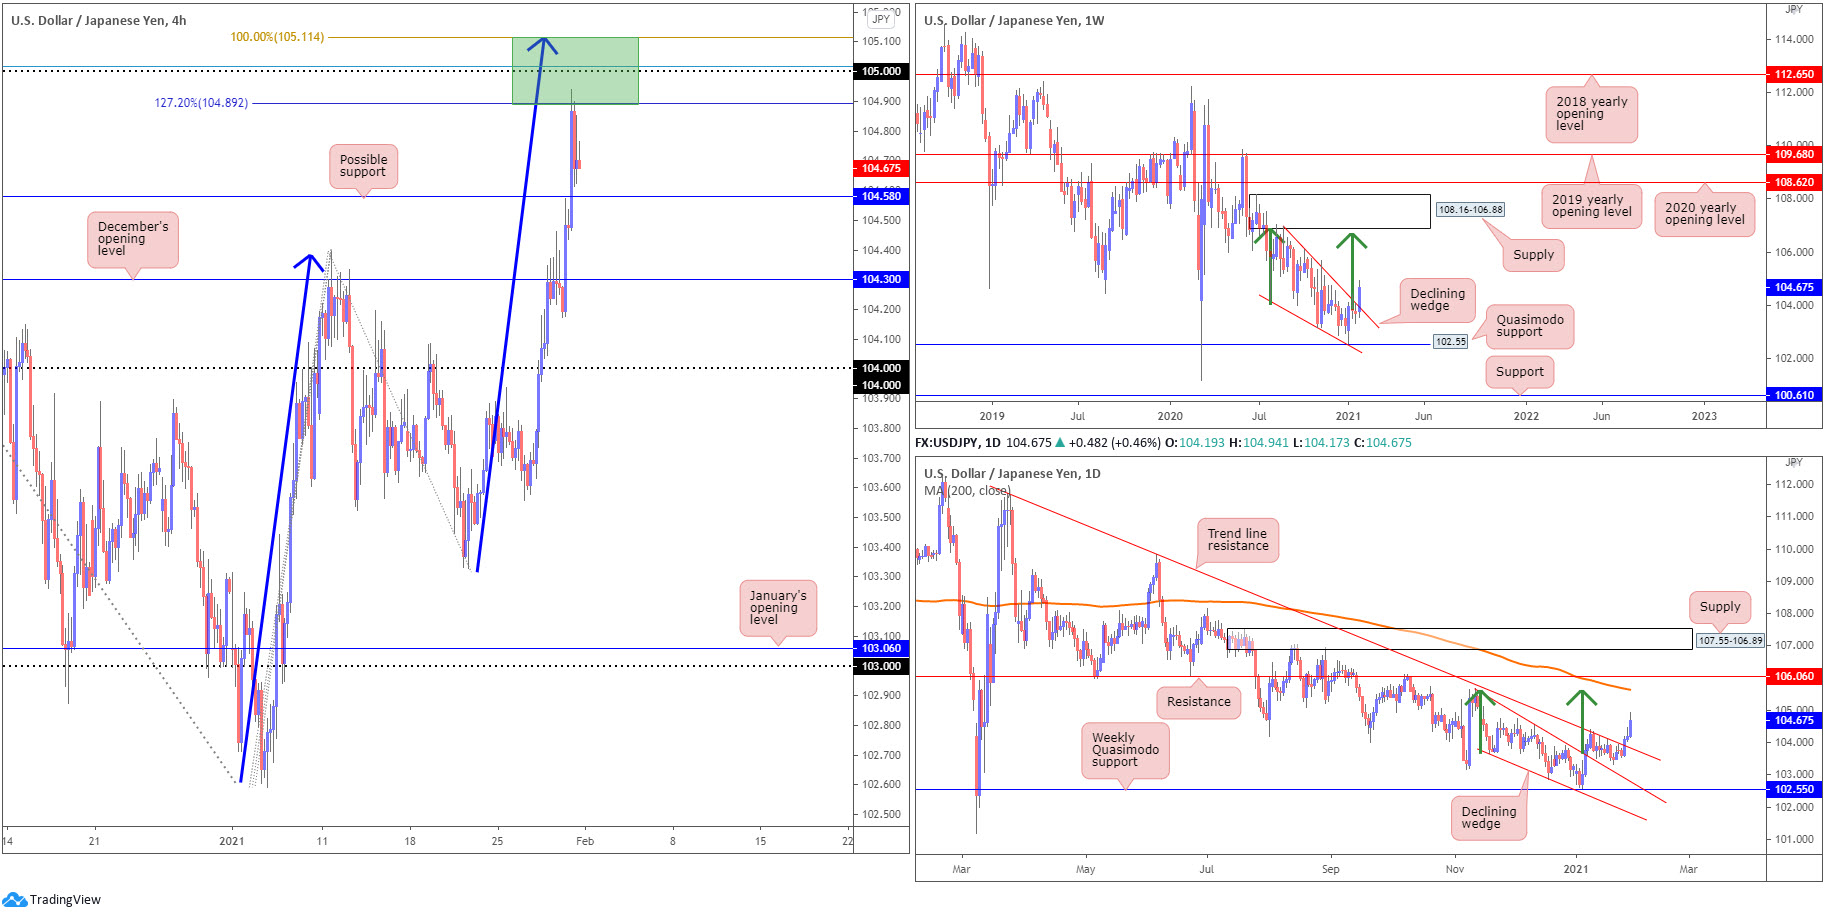
Since connecting with the underside of supply at 108.16-106.88 in August (2020), price has gradually shifted lower and developed a declining wedge (106.94/104.18).
Recent developments on the weekly scale, nonetheless, has witnessed price breakout above the aforementioned declining wedge. The velocity behind the breakout may be viewed as a reversal signal, zeroing in on the lower edge of supply (green arrows represent the take-profit objective).
Daily perspective:
The technical framework on the daily chart shows price not only also split the upper edge of a declining wedge (105.67/103.65) in early January, the unit also took on trend line resistance last week, taken from the high 111.71.
As for upside objectives on this scale, the declining wedge take-profit level is set around 105.59 (green arrows), with a break exposing the 200-day SMA (orange –105.64) and resistance priced in at 106.06
H4 perspective:
After taking out stops above 104.76 peaks Friday—a previous double-top pattern—USD/JPY shook hands with interesting resistance, composed of a 100% Fibonacci extension point at 105.11, a 78.6% Fibonacci retracement ratio at 105.01, the 105 figure and a 127.2% Fibonacci projection point at 104.89 (105.11-104.89).
The reaction from 105.11-104.89 throws 104.58 in the mix as possible support early week, together with December’s opening value at 104.30.
Traders are urged to remain cognisant of the bigger picture: both the weekly and daily timeframes suggest a break of the 105 figure to at least 105.59.
Areas of consideration:
- Trend: Lower since 2017. Though according to higher timeframe pattern structure, buyers are in the driving seat.
- With higher timeframes pointing higher, H4 traders may hone in on 104.58 and 104.30 as possible dip-buying sites this week.
- A H4 close above 105 is likely to be welcomed as a breakout signal, targeting pattern resistance at 105.59 on the daily timeframe.
USD/CAD:
Weekly gain/loss: +0.34%
Weekly close: 1.2774
Weekly perspective:
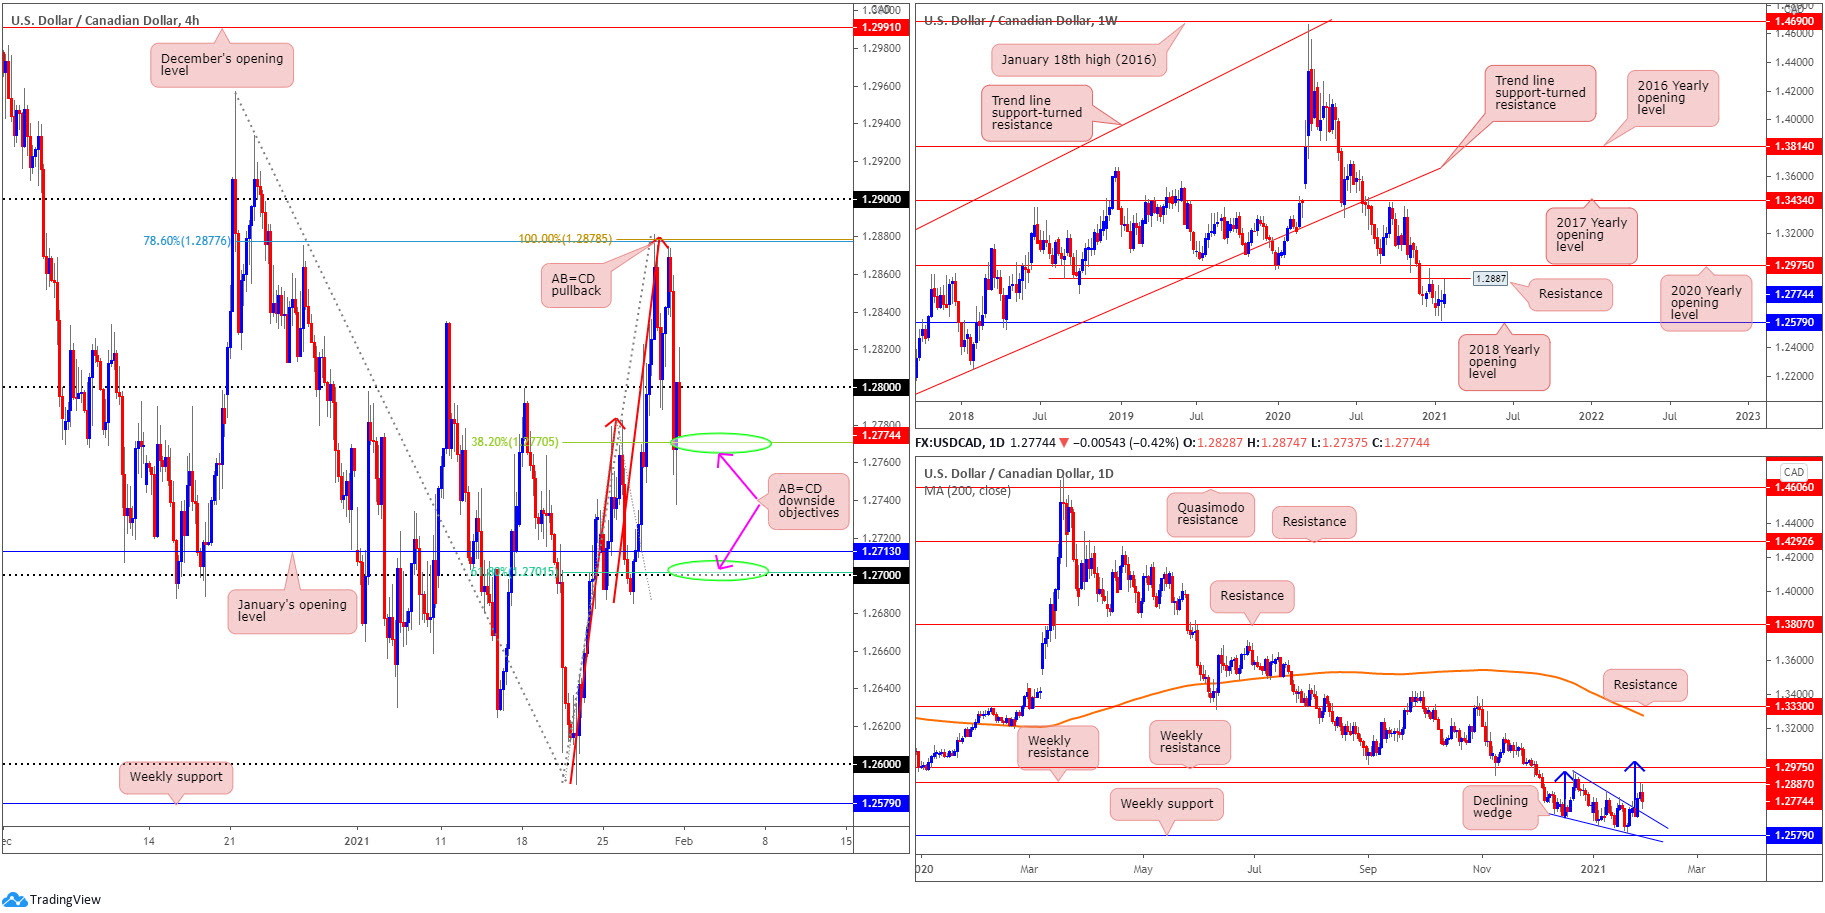
Following three back-to-back long-legged doji candles, price came within shouting distance of retesting resistance at 1.2887 last week, a previous Quasimodo support level.
As you can see, a reasonably robust end-of-week correction materialised, implying sellers could be gearing up for a test of the 2018 yearly opening value at 1.2579.
It is important to note long-term flow (trend) has been pointing lower since topping in March (2020).
Daily perspective:
Mid-week movement saw USD/CAD breakout above a declining wedge (1.2957/1.2688) and subsequently cross swords with space just south of the weekly resistance level mentioned above at 1.2887. Note that above here we have another layer of weekly resistance nearby at 1.2975 (the 2020 yearly opening value), followed by the daily timeframe’s declining wedge take-profit objective at 1.3009 (blue arrows).
H4 perspective:
For those who read Friday’s technical briefing you may recall the following (italics):
After touching gloves with multi-week tops, USD/CAD pared earlier gains on Thursday. Technically aided by a H4 AB=CD pullback at 1.2878, along with a 78.6% Fibonacci retracement ratio at 1.2877, the pair has since slipped beneath the 1.28 figure. Harmonic traders are also likely to acknowledge the 38.2% and 61.8% Fibonacci retracement ratios at 1.2770 and 1.2701, respectively—AB=CD downside objectives.
As evident from the H4 chart, Friday vigorously connected with the 38.2% Fibonacci retracement ratio at 1.2770, and spiked to lows at 1.2737.
With H4 finding some grip off the underside of 1.28, harmonic traders likely still have the 61.8% Fibonacci retracement ratio on their watchlists this week at 1.2701 (surrounded by the 1.27 figure and January’s opening value at 1.2713).
Areas of consideration:
- Trend: Lower since topping in March at 1.4667.
- With 1.28 offering resistance, follow-through selling to the 61.8% H4 Fibonacci retracement ratio at 1.2701 could be targeted.
- The breakout above the daily declining wedge, nevertheless, may eventually stir buyers enough to elevate things through weekly resistance at 1.2887 to another weekly resistance at 1.2975 (merges closely with the daily timeframe’s declining wedge pattern target).
USD/CHF:
Weekly gain/loss: +0.55%
Weekly close: 0.8898
Weekly perspective:
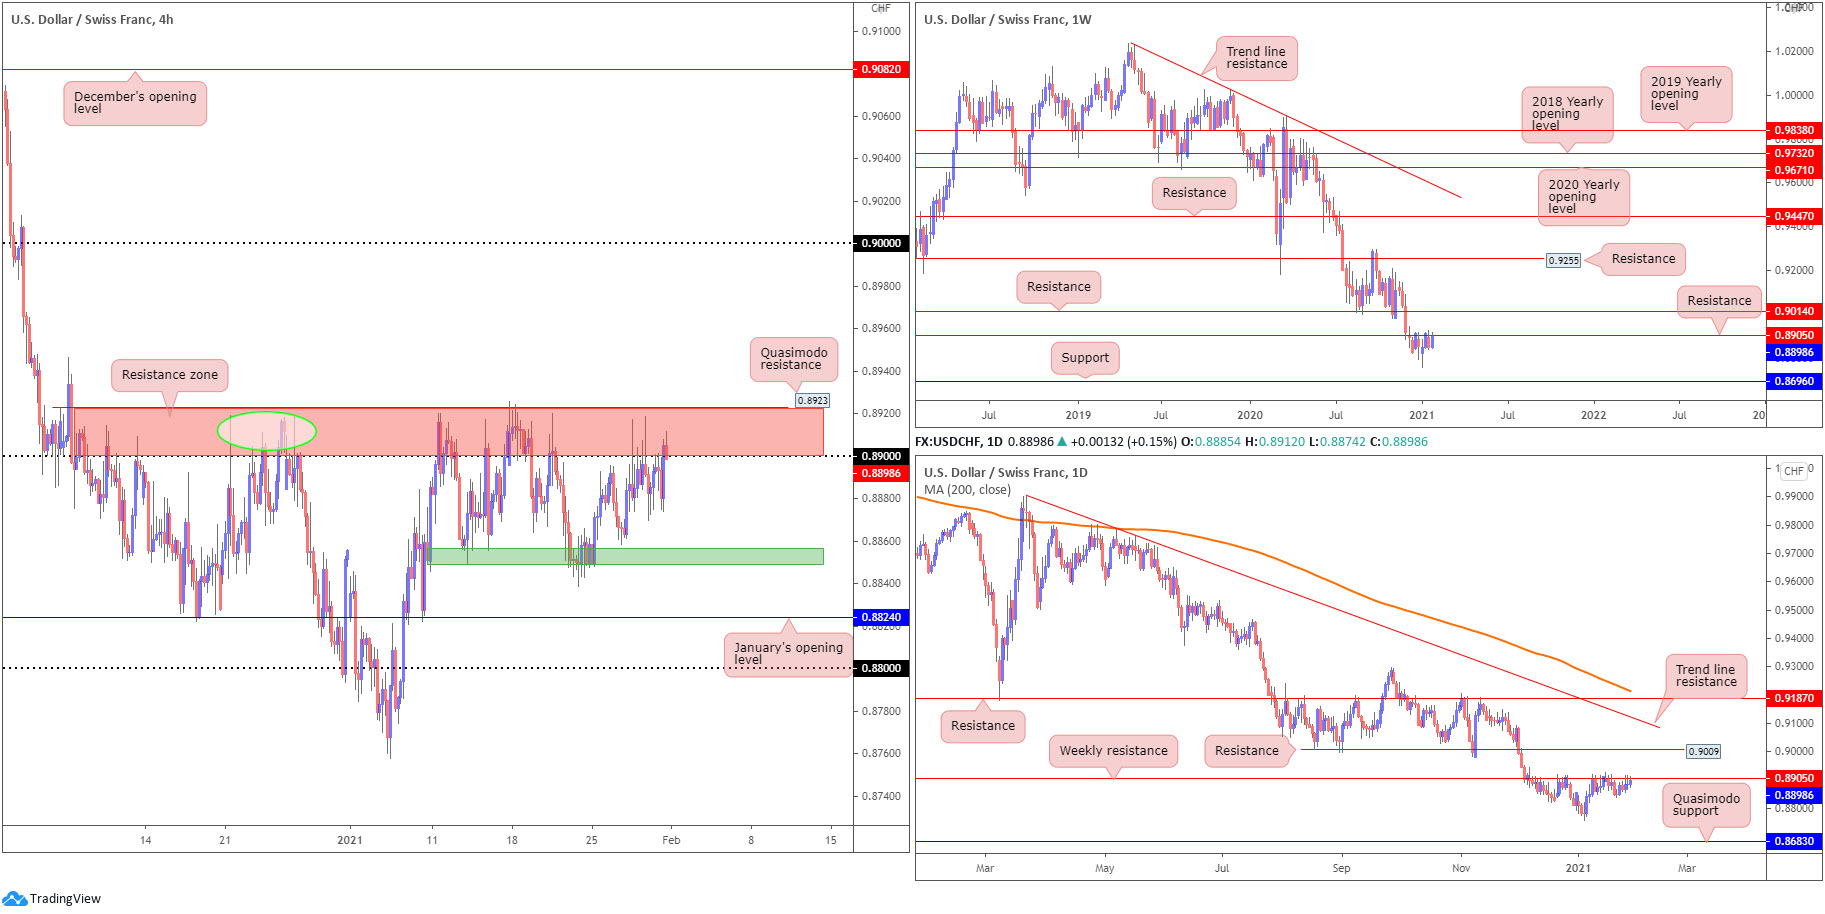
The weekly timeframe shows not only has USD/CHF been entrenched within a downtrend since May 2019, the pair also remains loitering at the underside of resistance drawn from 0.8905.
Because of this, sellers could maintain control in the coming weeks.
Support on the is not expected to make an appearance until 0.8696.
Daily perspective:
Similar to the weekly scale, the daily timeframe reveals weekly resistance at 0.8905 as a prominent base.
However, Quasimodo support at 0.8683 serves as the next downside target on the daily timeframe, situated a touch beneath weekly support at 0.8696.
H4 perspective:
The US dollar eked out a modest gain against the Swiss franc on Friday, challenging the grip of resistance at 0.8923-0.89 (Quasimodo resistance and psychological resistance). Although this area has remained a base of interest since the beginning of December, sellers appear to be losing traction. The initial reaction (green circle—December 24) saw lows of 0.8757, while mid-January’s reaction failed to overthrow 0.8850 (green). Adding to this, the second half of last week retested the said resistance and was unable to push through 0.8880.
Above 0.8923-0.89, we can see a reasonably clear path back to the key figure 0.90, which happens to align with daily resistance at 0.9009.
Areas of consideration:
- Trend: lower since May 2019.
- A H4 close above 0.8923 this week is likely to spark breakout buying interest, targeting the 0.90 region. Conservative buyers may seek a retest at 0.8923 before committing.
- Should sellers defend 0.8923-0.89, bearish scenarios may form should H4 close south of 0.8850. Although short-term downside targets rest between 0.8824 (January’s opening value) and the 0.88 figure, longer-term targets to be aware of are the multi-month troughs around 0.8757 (formed early January), with further selling to possibly take aim at weekly support drawn from 0.8696 and daily Quasimodo support at 0.8683.
Dow Jones Industrial Average:
Weekly gain/loss: -3.41%
Weekly close: 29,948
Weekly perspective:
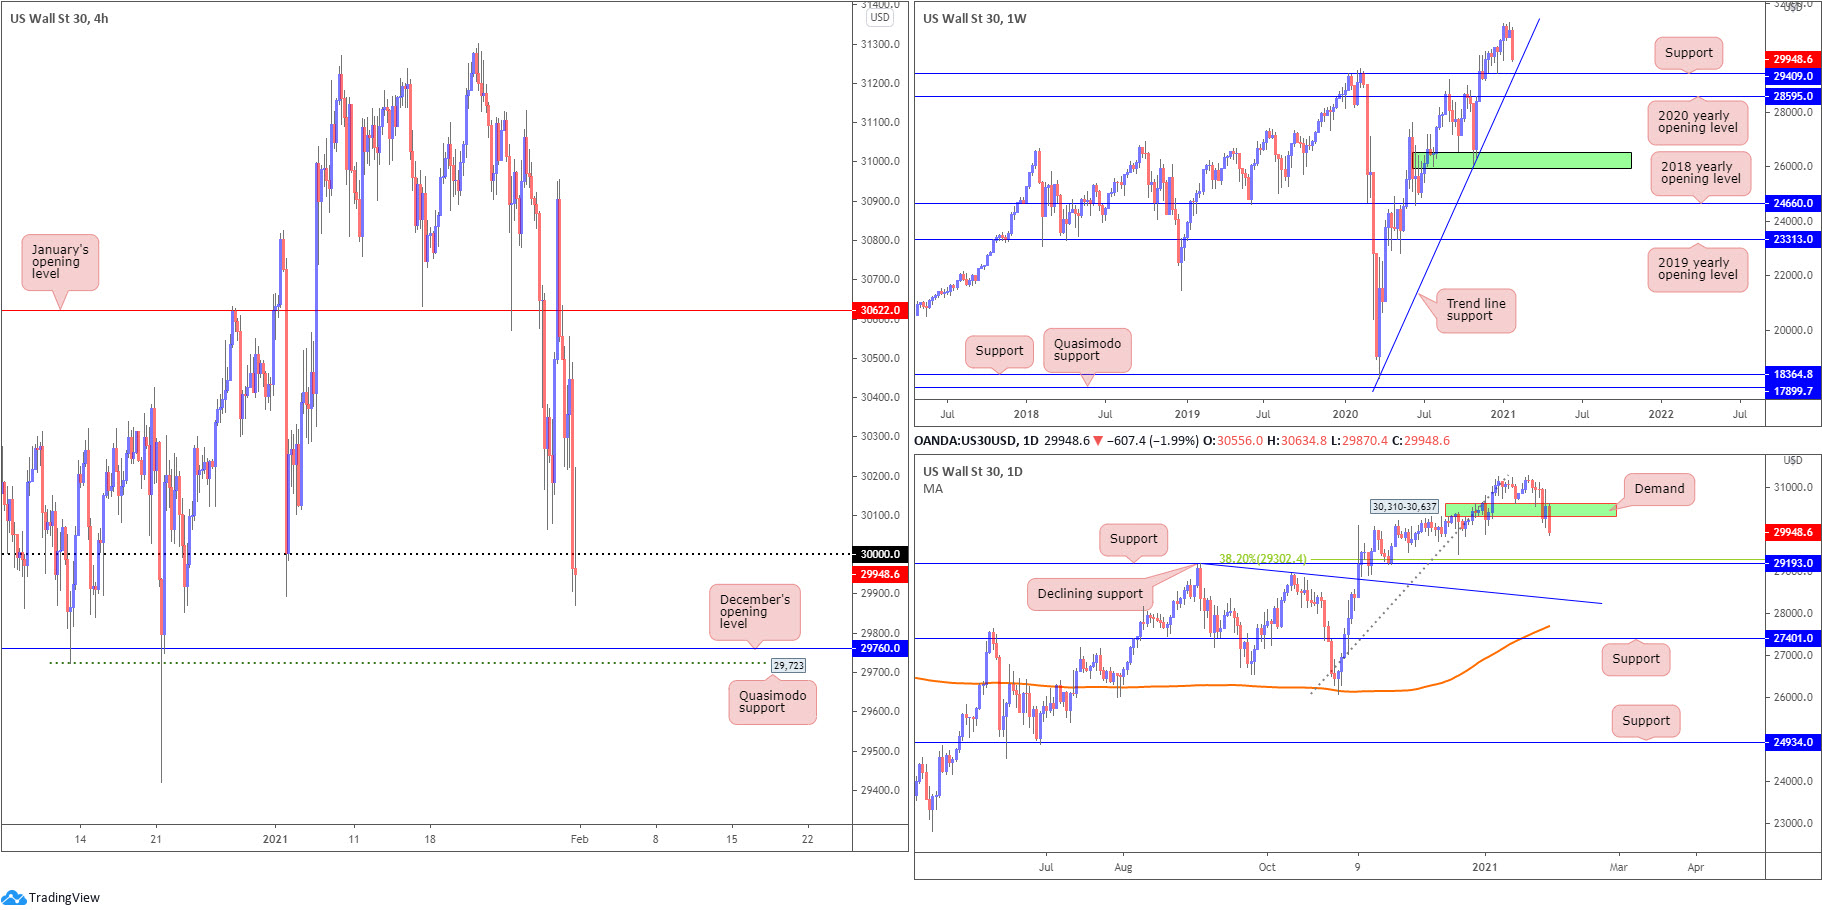
South of all-time highs at 31,301, DJIA shed more than 1,000 points last week and moulded a near-full-bodied bearish candle.
As noted in previous analysis, trend line support, extended from the low 18,213, could make a show this week, with possible follow-through selling drawing in another nearby support at 29,409, a previous Quasimodo resistance.
Daily perspective:
Despite trending higher since 2020, demand at 30,310-30,637 collapsed heading into the second half of last week’s trading. Friday’s dominant sell-off shines the technical spotlight on support at 29,193 this week (merging closely with a 38.2% Fibonacci retracement ratio at 29,302).
H4 perspective:
Major US equity benchmarks followed European bourses lower on Friday. The Dow Jones Industrial Average fell 620.74 points, or 2.03%; the S&P 500 dropped 73.14 points, or 1.93% and the Nasdaq fell 266.46 points, or 2.00%.
On the technical front, 30,000 came under pressure on Friday, following steep losses in the final hours of the week. This, consequently, threatens to reconnect with December’s opening value at 29,760, closely shadowed by Quasimodo support coming in at 29,723.
Areas of consideration:
- Trend: bull market—decisively higher since 2020.
- According to the higher timeframes, extending the recent retracement slide could be in the offing this week until weekly trend line support enters the fight. This suggests sellers are to likely try and overwhelm any buying off December’s opening value drawn from 29,760 on the H4.
- On the back of the above analysis, intraday sellers could try and hold position beneath 30,000 (H4) this week, ultimately targeting weekly trend line support.
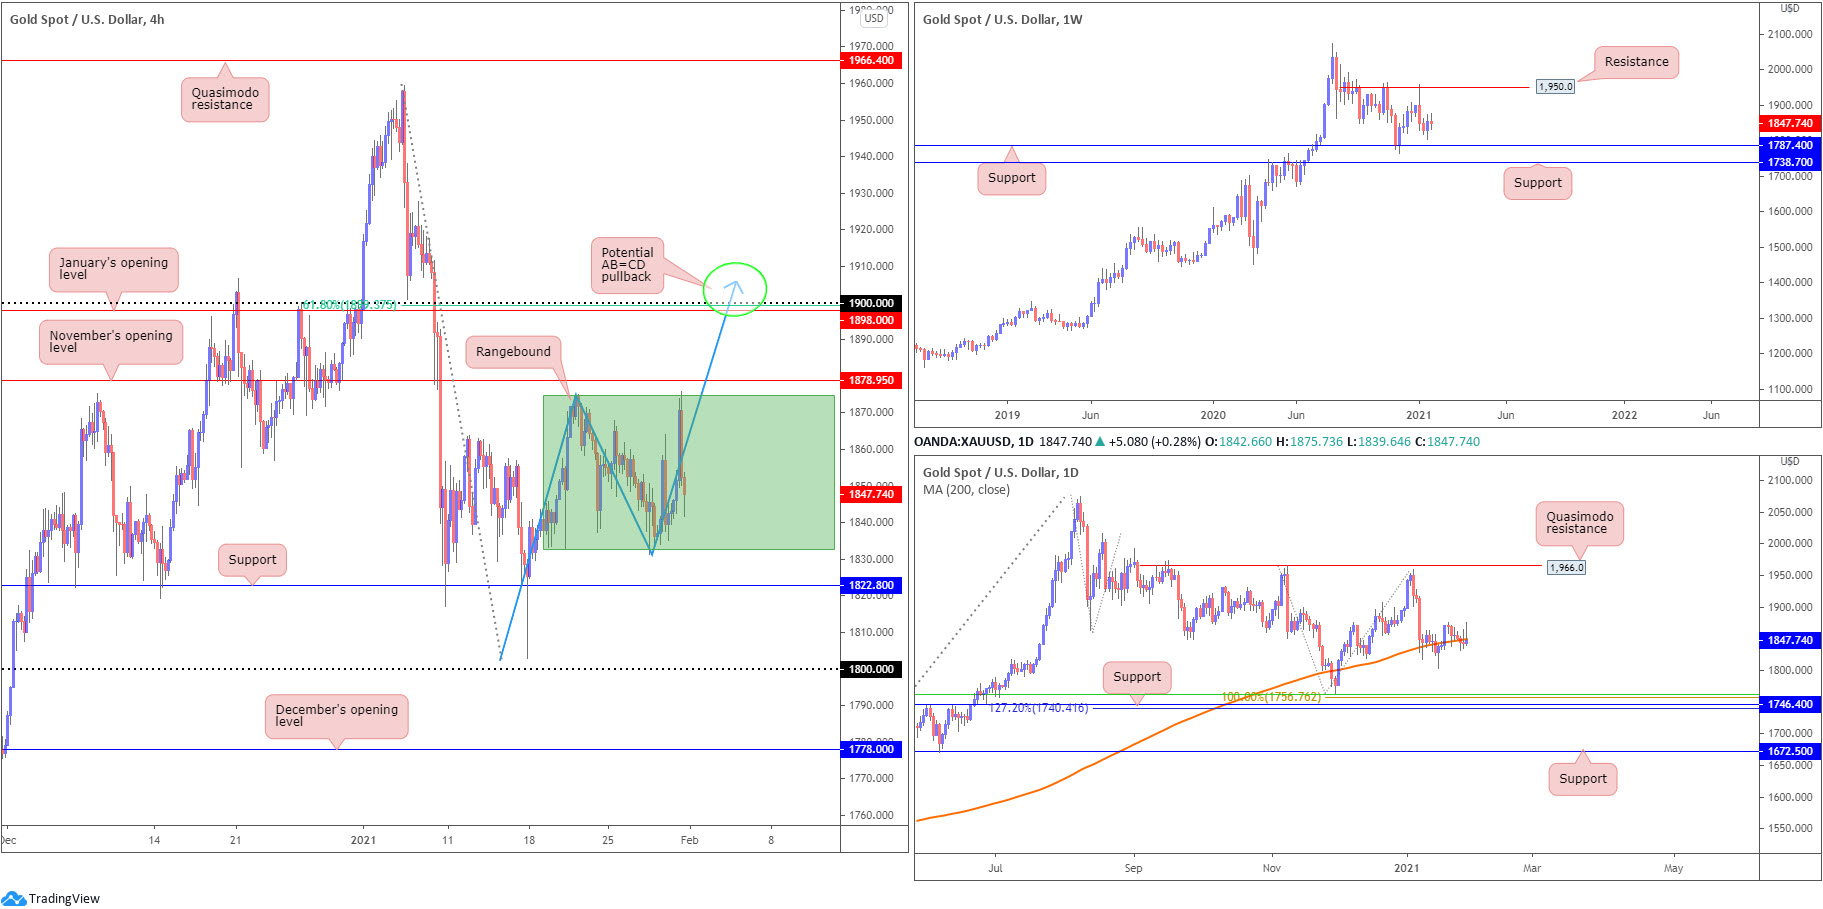
XAU/USD (GOLD):
Weekly gain/loss: -0.43%
Weekly close: $1,847
Weekly perspective:
The prior week’s bullish outside reversal candle failed to provide impetus, with last week’s session, albeit scratching out fresh highs, ending off best levels.
This hints at support at $1,787—set north of another support at $1,738—is perhaps to call for attention this week.
It is also important to note that in terms of trend we’ve been actively trending higher since early 2016.
Daily perspective:
Mid-week action witnessed the yellow metal slip beneath the 200-day SMA (orange – $1,849).
Any sustained selling south of this dynamic value is likely to be interpreted as a bearish cue. Below the noted SMA, support is arranged around $1,746, sited south of a 100% Fibonacci extension point at $1,756, a 50.0% retracement ratio at $1,762 and above a 127.2% Fibonacci extension point at $1,740.
H4 perspective:
Last week formed a range between $1,832 and $1,874.
Outside of this area, $1,822 is seen as immediate support, with a break exposing $1,800. To the upside, November’s opening value at $1,878 represents possible resistance, followed by January’s opening value at $1,898, a 61.8% Fibonacci ratio at $1,899, the $1,900 figure and a potential AB=CD pullback (blue arrows) at $1,906.
Areas of consideration:
- Trend: higher since early 2016.
- H4 shows a ranging environment between $1,832 and $1,874, which may attract lower timeframe traders at range extreme’s this week.
- The 200-day SMA breach has likely caught the eye of sellers, particularly with room seen on the weekly timeframe to approach support at $1,787.
- H4 support at $1,822 is in view, with November’s opening value at $1,878 seen to the upside.
- H4 AB=CD pullback around $1,900 may interest sellers should November’s opening value at $1,878 step aside.
The accuracy, completeness and timeliness of the information contained on this site cannot be guaranteed. IC Markets does not warranty, guarantee or make any representations, or assume any liability regarding financial results based on the use of the information in the site.
News, views, opinions, recommendations and other information obtained from sources outside of www.icmarkets.com.au, used in this site are believed to be reliable, but we cannot guarantee their accuracy or completeness. All such information is subject to change at any time without notice. IC Markets assumes no responsibility for the content of any linked site.
The fact that such links may exist does not indicate approval or endorsement of any material contained on any linked site. IC Markets is not liable for any harm caused by the transmission, through accessing the services or information on this site, of a computer virus, or other computer code or programming device that might be used to access, delete, damage, disable, disrupt or otherwise impede in any manner, the operation of the site or of any user’s software, hardware, data or property.

COVID-19: Looking at vaccines & variants
108745 January 30, 2021 18:29 Forexlive Latest News Market News
What you need to know
The basic playbook for the COVID-19 recovery is that the vaccine will work. However, one aspect you may have in the back of your mind is how effective will the vaccine be against the COVID-19 variants? In this article I will outline the variants and some of the key issues that there are around them.
Is a variant a real threat to the recovery?

In short, yes. Or at least it could be. Variants are inevitable as the virus moves amongst populations. Most variants are harmless. According to Sharon Peacock, the head of the COVID-19 Genomics Consortium, the main worry is if we get ‘escape mutations’. These are mutations that can evade our immune systems and/or the existing vaccines. This has the potential to push us back to the very start of dealing with the virus. Needless to say this would result in a large sell off in risk assets.
Which variants are we aware of?
The major variants that we are aware of are strains known as the UK, Brazilian, and South African mutations.
How do we spot them?
The London variant was spotted by a team who noticed a sharp rise of cases in Kent, England. This variant was known as the B.1.1.7 and was spreading faster than the others. The UK is well placed to spot these variants as the UK has a new body called the G2P -UK National Virology Consortium to specifically keep track of the new variants. Not every country will be as set up for spotting variants as the UK, so this does pose a risk. The London variant was spotted relatively quickly which allowed action to be taken to limit its spread. This is a concern highlighted by Angela Rasmussen at Georgetown University in Washington DC. She said that it is,’unlikely that, overnight, a variant is going to emerge that is capable of completely evading the vaccine, but if we are not looking, then we might not find them until it is too late’
How quickly is COVID-19 evolving?
Slowly, thankfully. According to David Robertson at the MC University of Glasgow Centre for Virus Research the virus is evolving. ‘very slowly’. According to the New Scientist (23 Jan edition 2021 p 08) the virus’s average mutation rate remains low and steady at about two mutations per lineage per month. So, this is in our favour.

Will the current vaccines work on the new variants?
In short, they are expected to. Those in the know, like Jesse Bloom at the Fred Hutchinson Cancer Research Centre in Seattle, are optimistic. Bloom said that, ‘current vaccines will remain quite useful’. However, she did qualify that by saying that ‘eventually it will be necessary to update vaccines to account for viral evolution’. Though, due to the slow change of COVID-19 that should not be necessary every year. This was underscored by Kingston Mills at Trinity College Dublin who said that, ‘it does not seem to be as mutable a virus as influenza’. So, this means we probably won’t need to update the virus every year.
Encouragingly this week the Novavax jab is the first to show that it is effective against the new virus variant found in the UK showing that it was over 89% effective in UK trials. This confirms what the received wisdom appears to be. A slow virus, with slow changes and the current vaccines should do the job.
Less encouragingly the Johnson & Johnson vaccine was only 57% effective in South Africa where one of the new variants are, However, at least the vaccine was 88% effective in preventing serious disease. So, although not great – it is a tolerable result. Especially as the effectiveness in the US was +72% with 70% being seen as the required target.
Can we eradicate the virus?
Unlikely. This is because some viruses can circulate as the vaccines only prevent the symptoms of the virus. We are also not sure exactly how all our vaccines are working at present.This means the virus may circulate quite happily, but only show symptoms in unvaccinated people. This is the case with whopping cough for example. Also, some people will refuse the vaccine. In France they are reported to have a 4 in 10 projected rejection rate. The only virus we have ever eradicated is the small pox virus and that took enormous time and effort to do. So, it is probably here to stay. However, it could end up as being just a mildly unpleasant virus like the common cold. So, a COVID-19 that remains is not necessarily going to be as harmful as it is now.
So, what’s the trade?

Global growth is set to continue and vaccine optimism is well placed. The variants should work and the Novavax trials give the green light for risk in the bigger picture.
AUDJPY, NZDJPY longs all look good on pro-cyclical and a global synchronised recovery. The FTSE 100 looks cheap now with Brexit done and around 11% of the UK has received at least one dose of a vaccine. A copper and oil buy on deeper pullbacks all make sense as well.
What’s the risk?
The risk is that a variant emerges, but the present evidence says that is unlikely. However, the market will be sensitive to this news and will be a key headline to watch. However, probably a buy on the dips until/unless the variant is proven to be resistant to our present vaccines.
XRP Price Prediction: Ripple tests key 200-day SMA resistance near $0.31
108742 January 30, 2021 17:49 FXStreet Market News
- Ripple rose above 200-day SMA on Friday but closed the day below that level.
- With a break above $0.31, XRP could target $0.38.
- Bearish pressure is likely to build up if price falls below $0.25.
Ripple closed the second straight day in the positive territory on Friday and continues to edge higher on Saturday. As of writing, XRP was up nearly 5% on a daily basis at $0.2980.
Daily close above 200-day SMA to attract buyers
On Friday, the price rose above the 200-day SMA, which is currently located at $0.31, for the first time in two weeks but closed the day below that level. Currently, Ripple remains within a touching distance of this critical resistance and a convincing breakthrough could bring in more buyers. On the upside, $0.33 (static resistance, Jan. 19 high) aligns as the initial hurdle ahead of $0.38 (100-day SMA, Jan. 7/10 high).
On the other hand, $0.25, the lower limit of the three-week-old horizontal channel, is a key support and the near-term outlook would turn bearish if the price drops below that level.
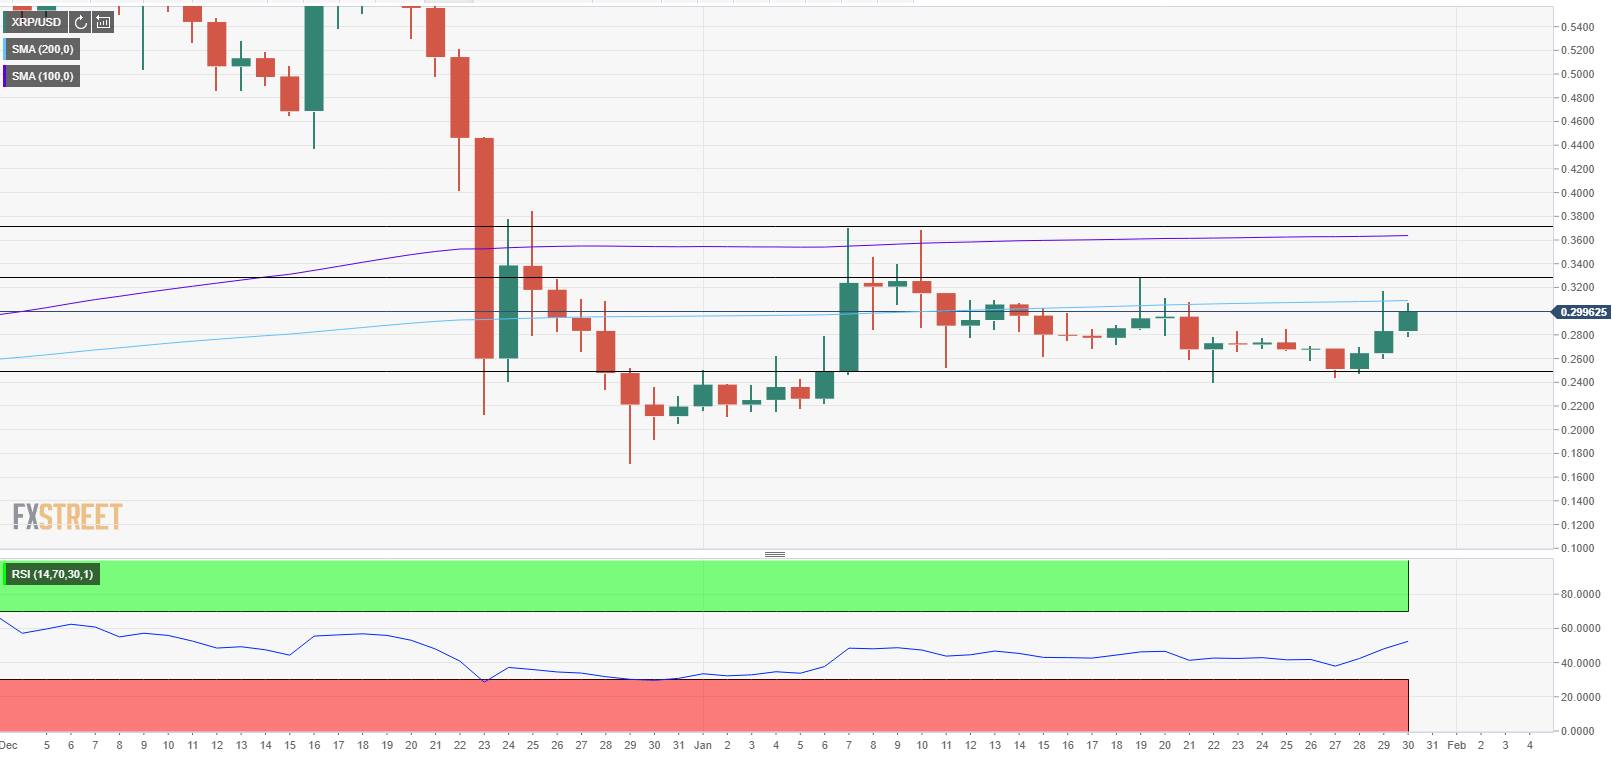
XRP/USD one-day chart
The technical developments seen on the four-hour chart confirms the bullish shift in the technical outlook. During the late American session on Friday, XRP rose above the 200 and the 100 SMAs on that chart and continues to trade near the upper limit of the ascending channel.
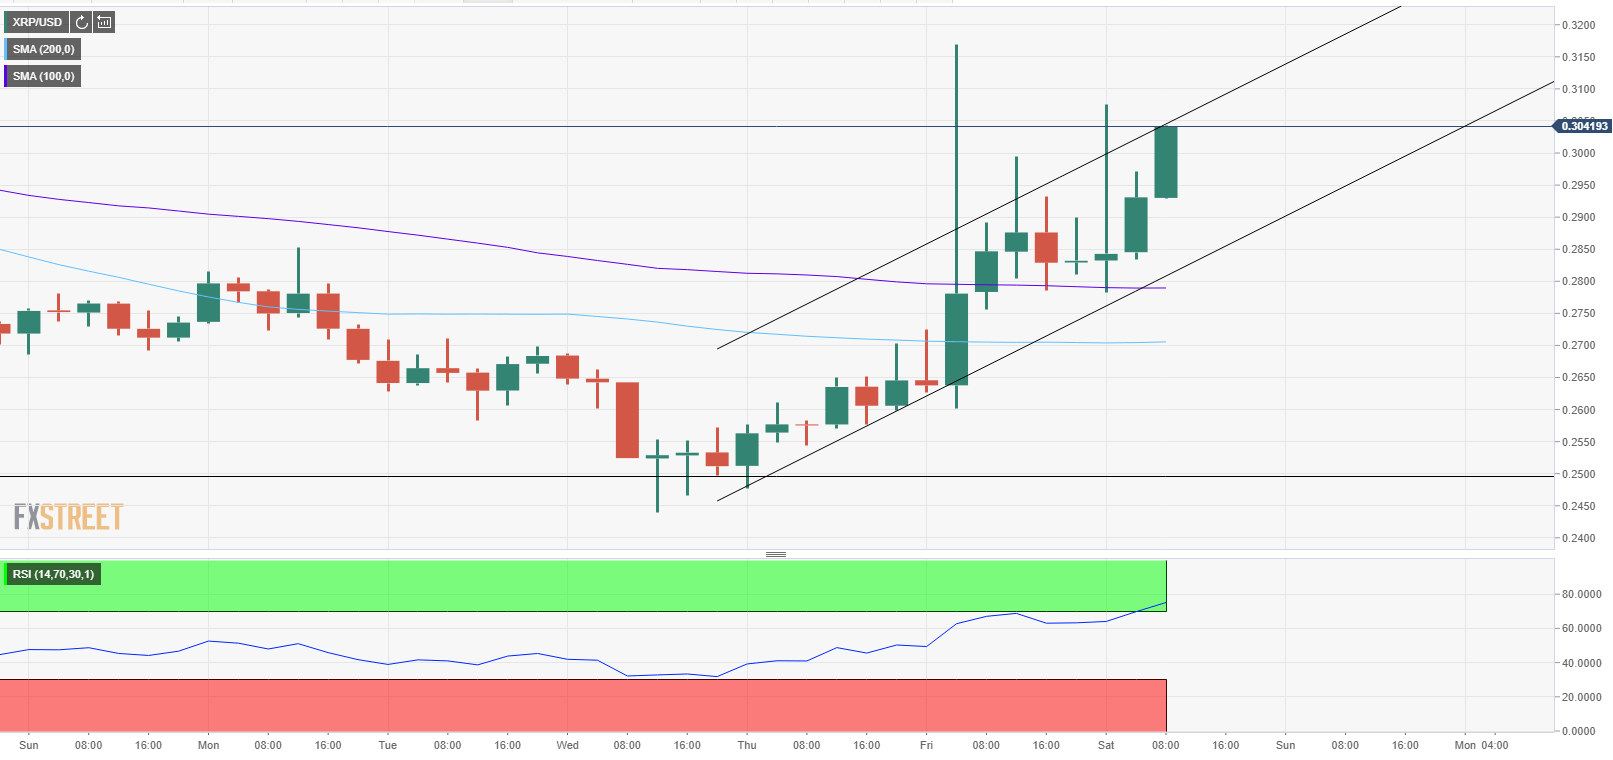
Ripple is on the verge of breaking out of its horizontal channel and could easily target $0.38. However, bulls need to commit to lifting the price beyond $0.31 in order for XRP to extend its rally.
Full Article
Bitcoin Price Analysis: BTC gets rejected near $39,000, correction to $32,000 likely
108739 January 30, 2021 17:17 FXStreet Market News
- BTC/USD rose to a fresh two-week high near $39,000 on Friday.
- Sharp pullback suggests that sellers look to retake control.
- Next line of defence is located around $32,000.
Bitcoin gained traction in the late American session on Friday and touched its highest level in two weeks near $39,000. However, BTC/USD failed to preserve its bullish momentum and staged a sharp technical correction to close the day modestly higher at $34,270. On Saturday, Bitcoin remains on the back foot and was last seen losing 1.1% at $33,870.
Critical support aligns at $32,000
With Friday’s upsurge, BTC/USD broke above the descending trend line coming from January 14 that can be seen on the four-hour chart. However, sellers took control of the price action as soon as the Relative Strength Index (RSI) on the same chart reached the overbought area above 70, suggesting that buyers showed no interest in defending the upside.
Currently, the 200-period SMA at $33,800 seems to be limiting Bitcoin’s downside. Below that level, the next support could be seen at $32,000, where the trend line is located.
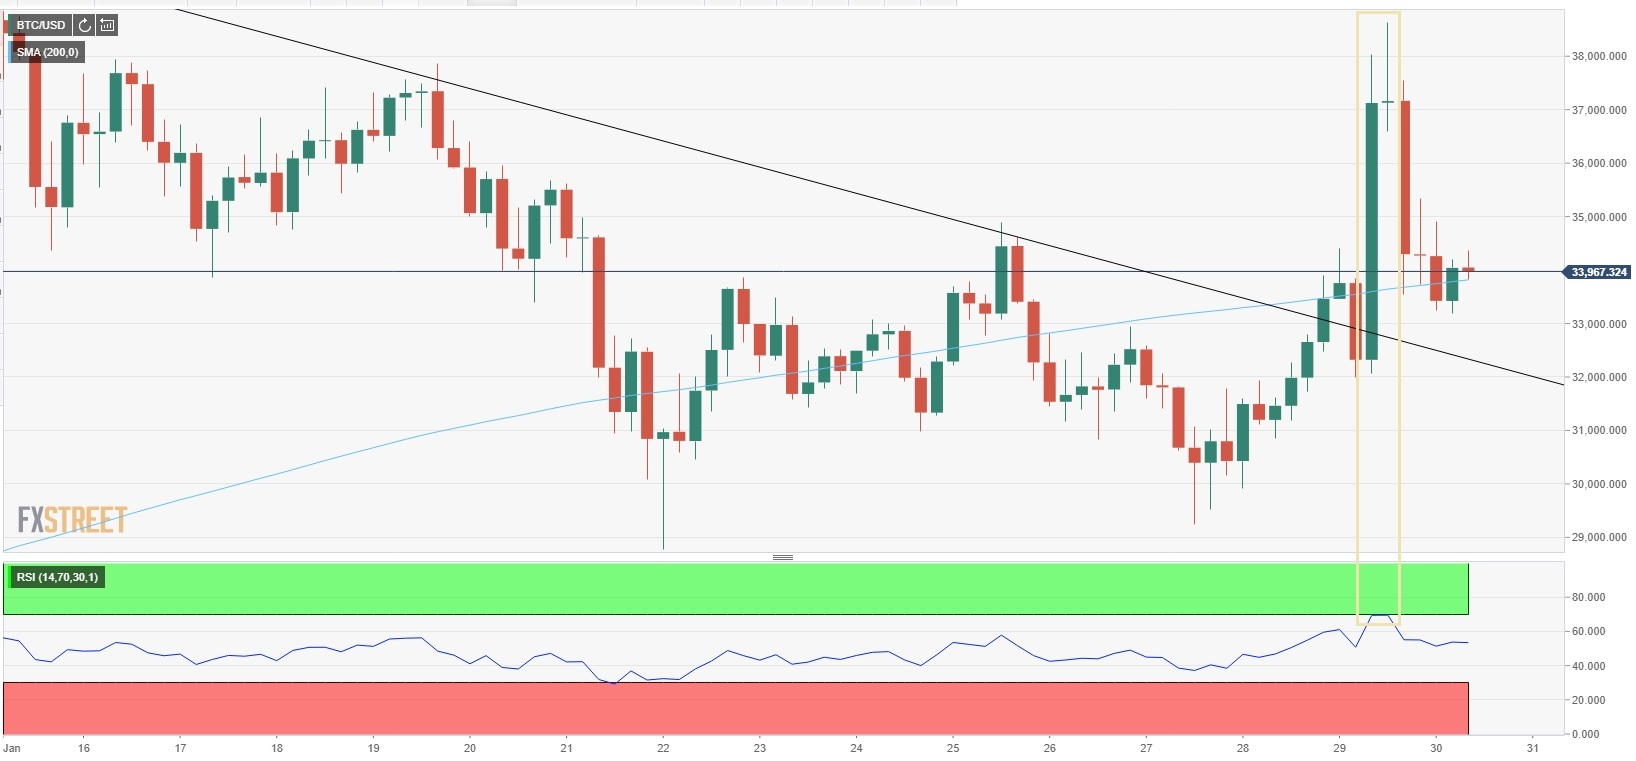
BTC/USD four-hour chart
Moreover, the 23.6% Fibonacci retracement of the three-week downtrend seen in January is reinforcing the $32,000 area. If Bitcoin manages to hold above that level in the near term, it could reverse its direction, once again. On the upside, the first resistance aligns at $35,500 (Fibonacci 50% retracement) ahead of $37,000 (Fibonacci 61.8% retracement) and $39,000 (Jan. 29 high).
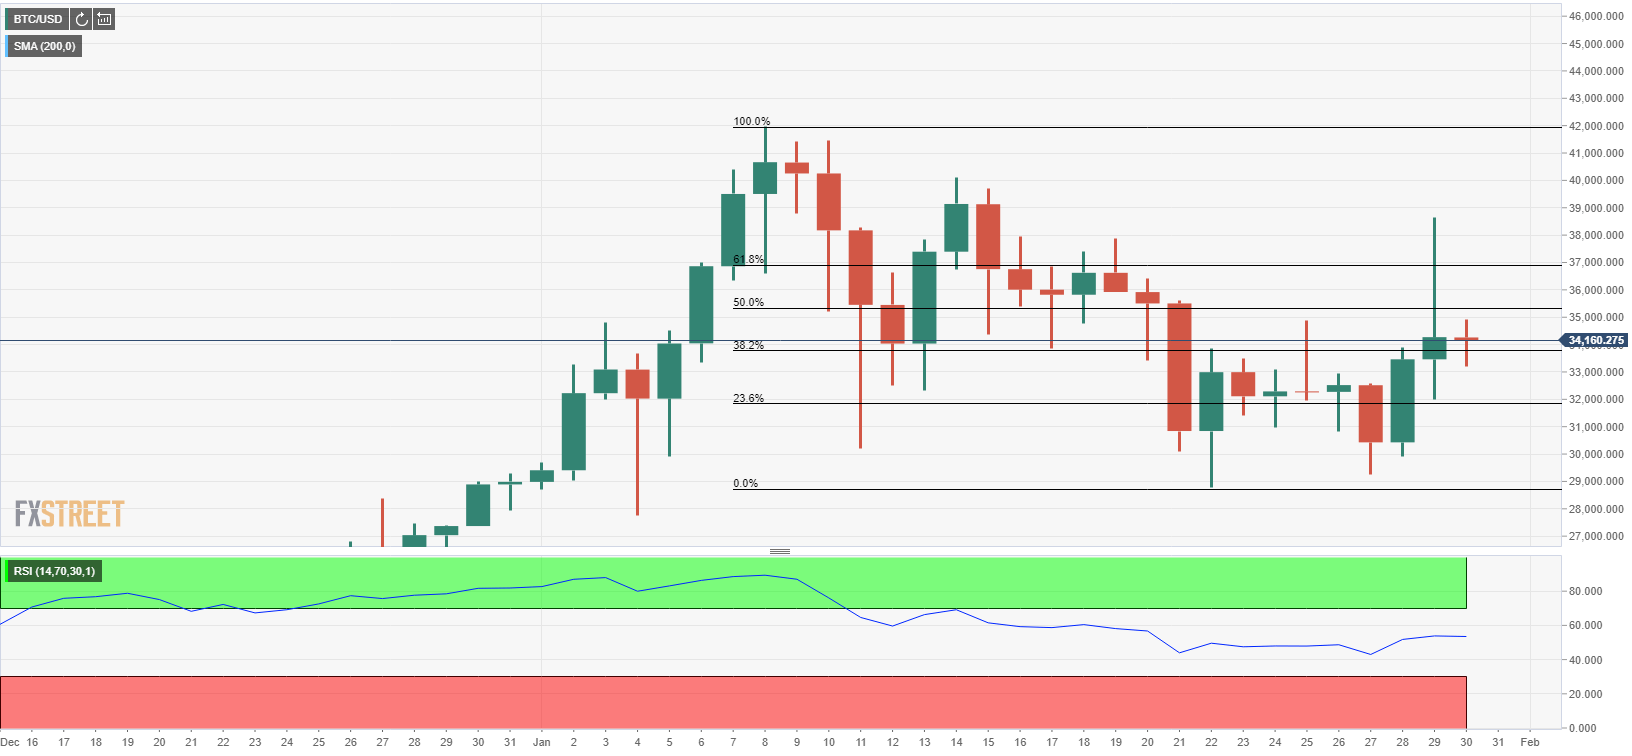
BTC/USD one-day chart
Friday’s impressive rally failed to attract bulls and BTC/USD fell sharply. However, the broken descending trend line suggests that Bitcoin could try to turn north. As long as $32,000 support holds, additional gains could be expected. On the other hand, a drop below $32,000 is likely to cause the technical outlook to turn bearish.
Full Article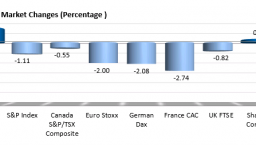
Forexlive America FX news wrap: The GBP ends the month as the strongest of the majors
108735 January 30, 2021 06:26 Forexlive Latest News Market News
The forex news for North American trading on January 29, 2021
It was a relatively quiet day for the meme stocks, after yesterday’s volatile price action following the restrictions on trading by RobinHood and others. The relative calm in the meme stocks, did not stop the major US indices from moving sharply to the downside and closing down near -2%.
A comment from Pfizer’s CEO accelerated the decline after he said “there is a high possibility that future variants will elude vaccines”.
That is not good for markets that are more focused on seeing the light at the end of the tunnel from the vaccines, vs. seeing another train light coming in the opposite direction straight toward a mid tunnel collision as a result of another variant that does not stop the Covid spread.
At the lows, the Dow industrial average was down -747 points. It closed down -620.74 points (-2.03%). The NASDAQ index was down -352 points before closing at -266.47 points (-2.0%). The S&P was down -93.26 points before closing at -73.14 points (-1.93%).
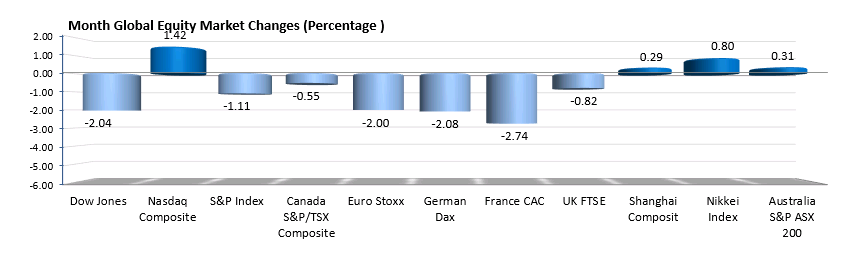
Today was month and then the major US indices closed mixed with the NASDAQ index rising by 1.42% while the Dow industrial average fell -2.04% and the S&P index fell -1.1%. European shares for the month of January got off to a slow start with all declining. The France’s CAC led the way with a -2.74% decline. Asian-Pacific shares increased with the Japan’s Nikkei up 0.8%. The Shanghai composite and Australia’s S&P/ASX 200 index eked out small gains (0.29% and 0.30%).
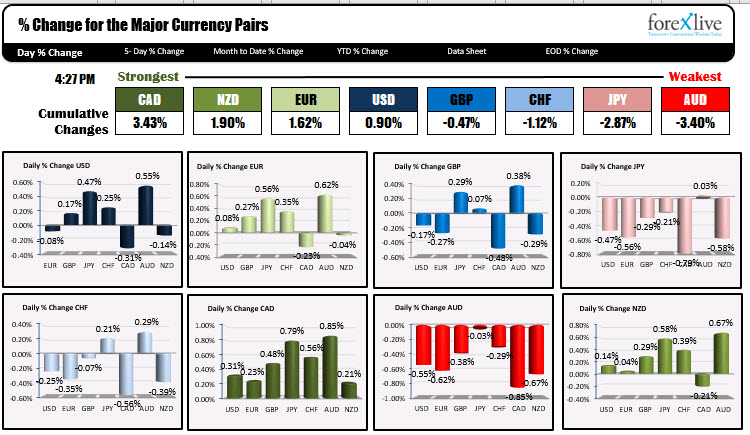
 In the Forex today, the CAD is ending as the strongest of the majors, while the AUD and JPY are the weakest. The USD had in other volatile up and down trading session in most of the currency pairs, but largely waffled sideways while stocks did their nosedive in the New York afternoon session.
For some specific currency pairs:
- EURUSD. The EURUSD had a down, up and down day, closing up about 15 pips on the day when all was said and done. The pair spent the last 5 or so hours trading mostly between its 100 hour moving average at 1.21269 and 200 hour moving average at 1.21360. In early trading next week, moving higher above the 200 hour moving average are lower below the 100 hour moving average will be the early bias shift.
- GBPUSD. The GBPUSD is another pair that saw up and down volatility today. It is also closing right around its 100 hour moving average at 1.3698 after falling to test its 200 hour MA at 1.36888 in the last hour of trading. The pair is closing down around -17 but traded both higher and lower intraday.
- USDJPY. The USDJPY in the Asian session moved to the highest level of the month at 104.934. In the process, the price moved above its 100 day moving average for the 1st time since June 2020. The 100 day moving averages at 104.399. The pair closed the day at 104.66. In the new trading week, the buyers are in control above its 100 day moving average. On the topside the 38.2% retracement of the move down from the June 2020 high cuts across at 105.358. It’s 200 day moving average (also not broken since early June) is up at 105.616.
- NZDUSD: The NZDUSD joins the EURUSD and GBPUSD as a pair where the price is closing near their 100 and 200 and 50% retracement The 100 hour moving averages at 0.71855. The 200 hour moving averages at 0.71807. The price is closing at 0.7189, just above the moving average levels. Needless to say those moving averages will be the barometer’s for both the buyers and sellers in early trading next week
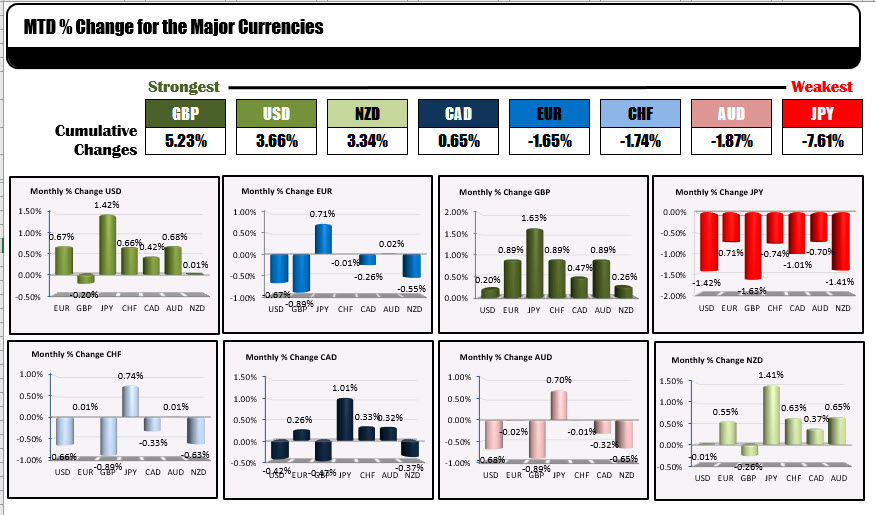
for the month of January, the strongest currency was the GBP, and the weakest currency wa the JPY. However, overall, you can characterize a price action is more choppy than trending for most of the currency pairs to start the new year. The US dollar was mostly stronger with the largest gains vs. the JPY (+1.42%), the AUDUSD, +0.68% and the EUR (+0.67%). The greenback was modestly lower vs the GBP and near unchanged vs the NZD. Below are the rankings of the major currencies for the month of January.
Fundamentally today:
- The US employment cost index for the 4th quarter was greater than expected at 0.7%
- US personal income rose by 0.6% but personal spending fell by -0.2% (and has been lower for 3 consecutive months). PCE inflation data remains tame at 1.3% for the headline number and 1.5% for the core deflator.
- US pending home sales fell from the 3rd consecutive month but were slightly better than the expectations at -0.3% vs. -0.5%. You are near however, pending home sales are up a large 22.8%.
- US consumer sentiment as measured by the University of Michigan dipped to 79.0 from the 79.2 preliminary estimate. Consumer sentiment is down from 81.8 in October 2020 and remains way below levels seen in from 2015 to the Covid plunge in March April 2020.
Wishing you all a good weekend. Thank you for your support.

Wall Street Close: S&P 500 and Dow erase gains for the year as investors fret over retail frenzy fallout
108734 January 30, 2021 05:56 FXStreet Market News
- Major US bourses dropped on Friday as investors fret about the fall-out of the recent retail trader induced frenzy on financial stability.
- The S&P 500 and Dow both erased their gains for the year.
It was an ugly finish to the week on Wall Street with all three major indices dropping and no sector spared from the selling pressure; the S&P 500 dropped back to the 3700 mark, down 1.9% on the day and 3.3% no the week, the Dow Jones Industrial Average dropped back to the 30,000 level, also down 1.9% on the day and 3.3% on the week, while the Nasdaq 100 dropped 2.1% to back below 13,000, down 3.5% on the week. Friday’s sell off saw the S&P 500 and Dow both erase their annual gains; on the year, the S&P 500 is now down 1.1%, the Dow is down 2.0%, while the Nasdaq 100 still clings on in positive territory.
Driving the day
In terms of the major market-moving talking points of the day…
1) Retail Traders versus Hedge Funds – The Reddit retail army bravely (or foolishly, critics of the movement would argue) continued their battle against the short-selling hedge funds on Friday. GameStop, the stock at the epicenter of the retail trader social media group WallStreetBet’s focus, ended the day 68% higher (and up more than 400% on the week) after restrictions on trading GME shares were eased at a number of popular retail brokerages including Robinhood, the brokers seemingly alarmed at the public/political backlash to their decision to impose restrictions in the first place. Other retail darling stocks saw similar gains on the day, with AMC one of the most heavily traded stocks on the NYSE and gaining 53.7%. In terms of why this is hurting the stock markets so badly, head of Bianco Research Jim Bianco put it well on Twitter; “the “masters of the universe” (referring to the Hedge Funds) are not surrendering their shorts/covering. So the fear is these shorts will rise so much, leading to losses and inability to meet margin calls…. margin calls put the financial industry at risk.”
2) Vaccine disappointment – Johnson & Johnson released their final vaccine trial results o Friday; the headline efficacy of the vaccine was not as high as the Pfizer or Moderna vaccines (seeing an average of 66% efficacy globally) and showed somewhat disappointing efficacy against the South African strain of Covid-19 of around 57%. However, the vaccine was 85% effective in preventing severe disease across all global testing regions. JNJ shares dropped by nearly 3.6% on the day, seemingly a reflection of disappointment about the vaccines lower than hoped for efficacy. Still, while not as good as other vaccines, the fact that the jab reduces severe disease by 85% means that it is still going to be a very useful tool in the armoury of the global fight against Covid-19 and ought to help accelerate the global drive towards herd immunity. Note also that within the last 24 hours, Novavax has also released vaccine results which showed 89% efficacy versus the UK variant of Covid-19, although was less effective against the South African variant.
3) Vaccine nationalism – Concerns over news of further delays of vaccine deliveries to the EU on Friday, this time from Moderna, weighed on European equities on Friday and likely also US stocks. Pfizer and AstraZeneca have also delayed deliveries amid production problems at European facilities. Markets are worried about how vaccine delivery issues will further delay the post-Covid-19 economic recovery. Perhaps even more worrying is the fact that the EU looks to be moving towards a form of vaccine nationalism; the bloc has been angered by the fact that AstraZeneca refused to divert vaccines supplies from the UK to make up for the company’s production short-fall on the mainland and is now threatening exports of the Pfizer vaccine to the UK. Blocking vaccine exports to the UK would mark a serious escalation in tensions between the countries and set the stage for some form of tit for tat economic war between the two economies.
Full Article
Fed’s Kaplan: More fiscal aid will create positive upside to forecast
108733 January 30, 2021 05:21 Forexlive Latest News Market News
Dallas Fed Pres. Kaplan participating in a virtual event
Fed’s Kaplan participating in a virtual event says:
- Downside risks include vaccine efficacy and virus variance
- Upside risks include bigger bouncing public confidence
- More fiscal aid will create positive upside to forecast
- Could see significant increase in economic activity before herd immunity
- Baseline growth forecast for 2021 is a 5%
Kaplan is a nonvoting member on the FOMC board in 2021
Ethereum Price Prediction: ETH on the verge of a 30% breakout towards $1,900
108728 January 30, 2021 05:21 FXStreet Market News
- Ethereum price had a major breakout today following Bitcoin’s rally thanks to Elon Musk.
- The digital asset faces one last critical resistance level before a major breakout.
- ETH is contained inside an ascending triangle pattern on the 12-hour chart.
Ethereum has been trading inside a tightening range after hitting a new all-time high at $1,475. The digital asset has formed a robust support trendline and faces only one crucial resistance point which will lead to a significant breakout.
Ethereum price needs to crack this crucial level to see $1,900
On the 12-hour chart, Ethereum has established an ascending triangle pattern with the resistance trendline formed at $1,430. A breakout above this point gives a target price of $1,900 in the long term.
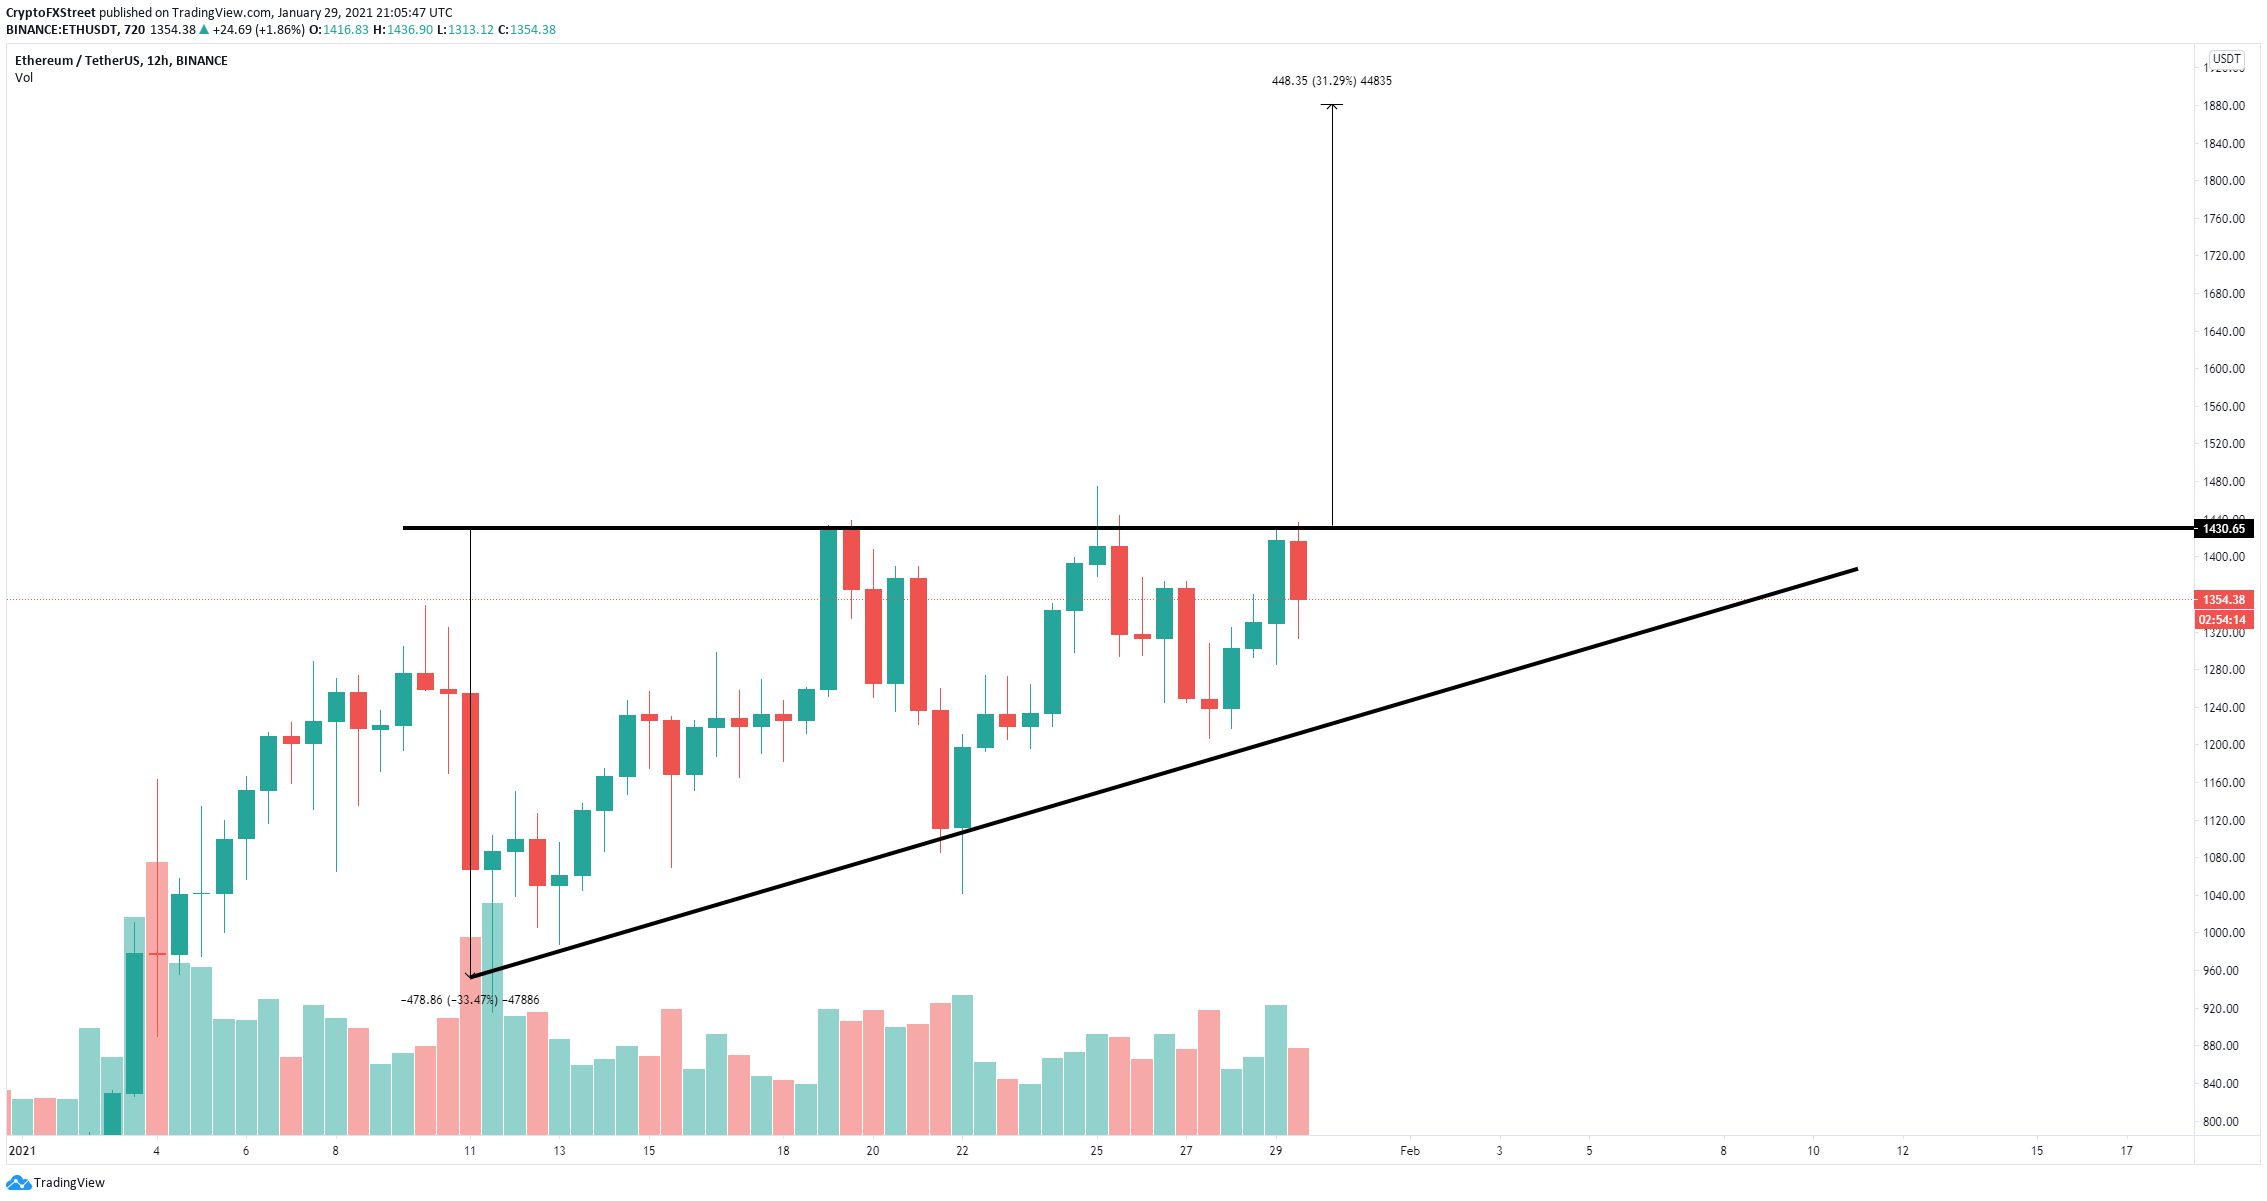
ETH/USD 12-hour chart
The In/Out of the Money Around Price (IOMAP) chart shows practically no resistance above $1,356 which means a bullish breakout is very likely. Just like we stated in our last few articles, the number of Ethereum inside exchanges has remained low.
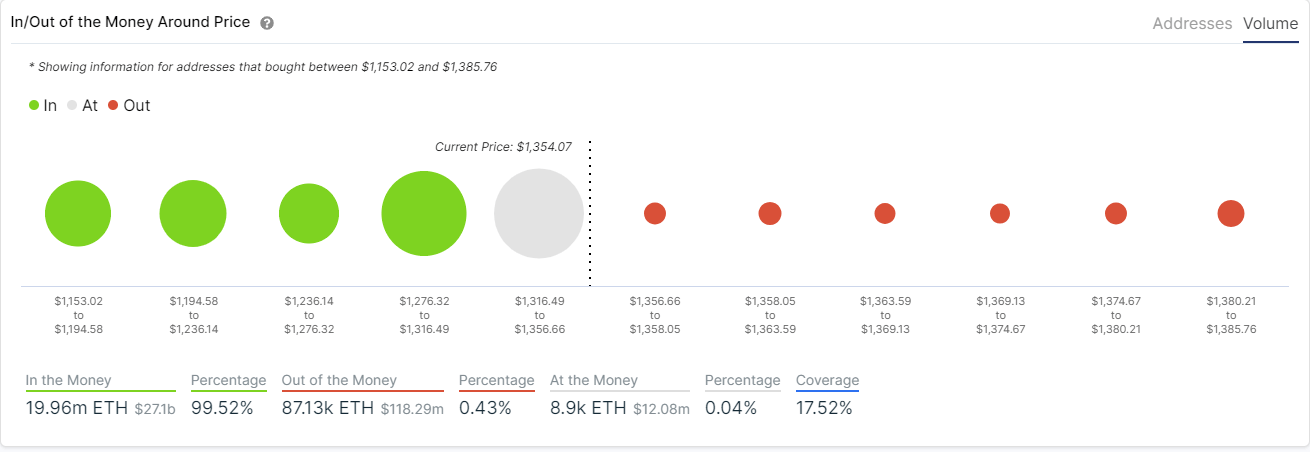
ETH IOMAP chart
Despite the massive price spike in the past 24 hours, no significant deposits have been made to exchanges and the percentage of ETH remains at 20.7%.
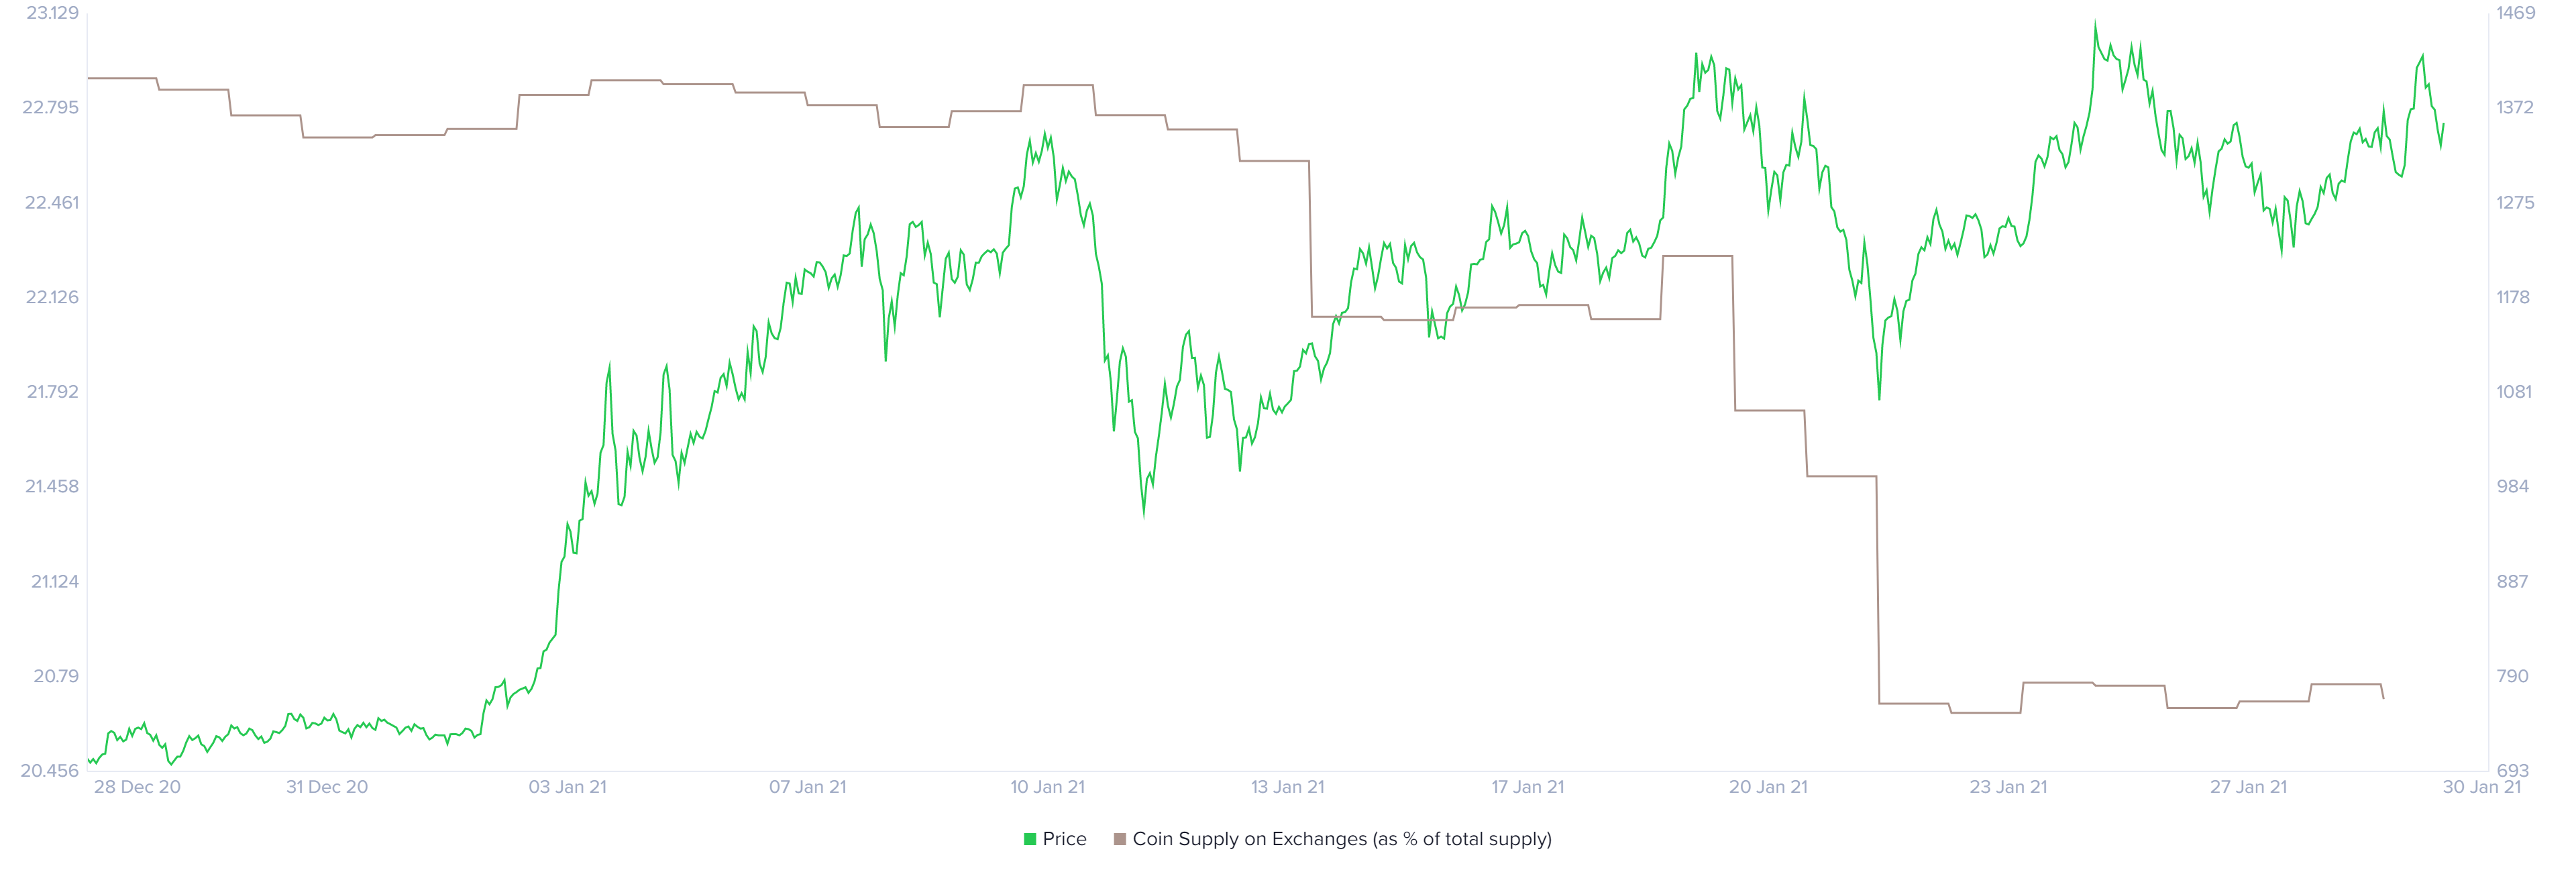
ETH coins inside exchanges
The ETH/BTC chart did flip in favor of Bitcoin for a while after the flagship cryptocurrency exploded 20%. However, it quickly went back up defending the 12-EMA on the daily chart. Ethereum remains in a healthy consolidation against Bitcoin, looking for the next leg up.
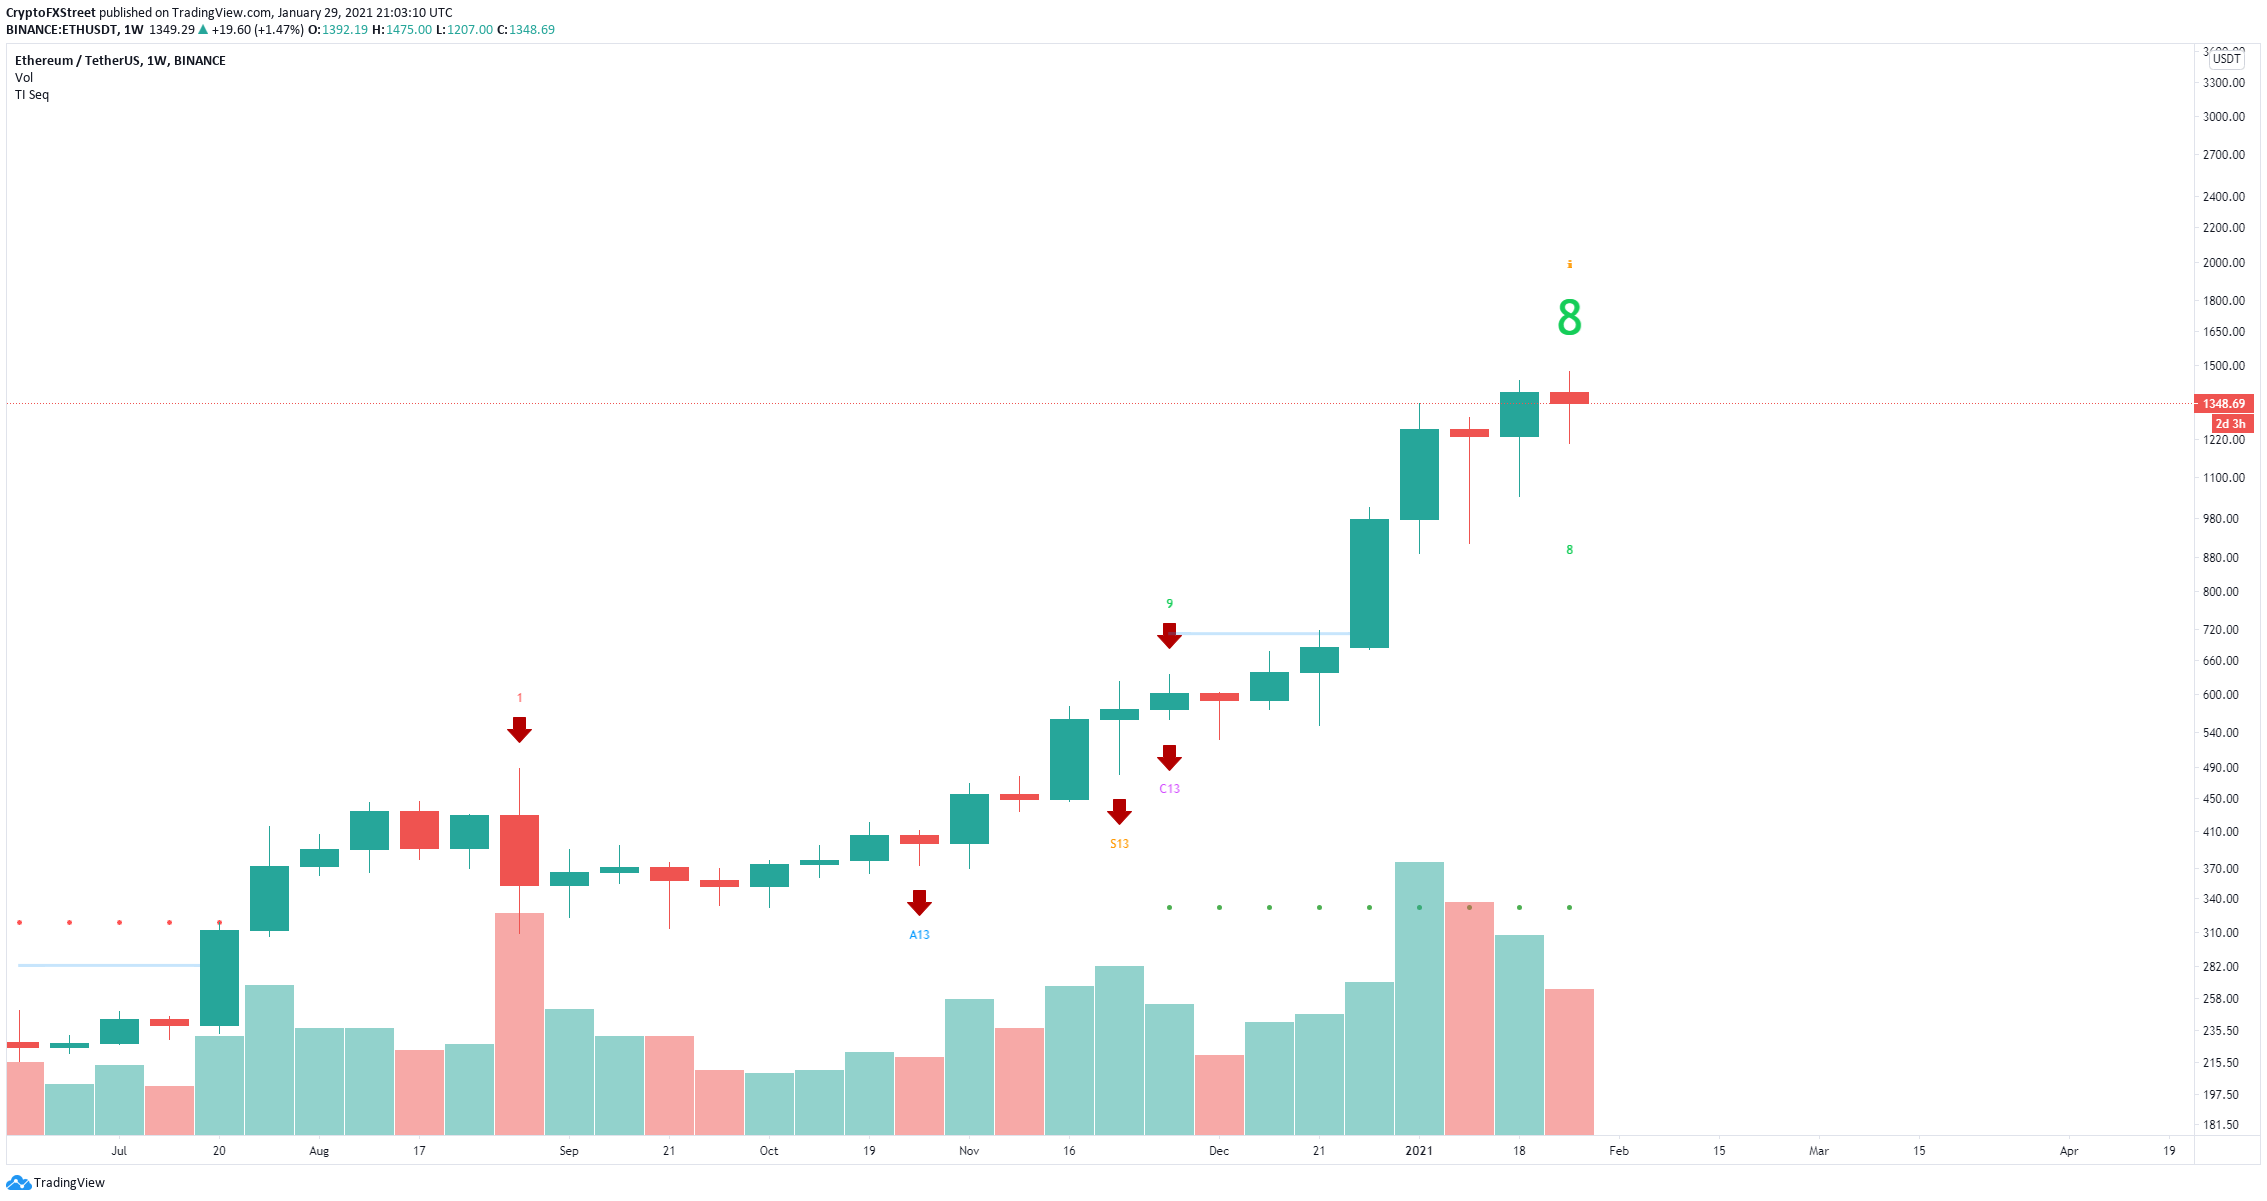
ETH/USD weekly chart
The only potential bearish sign is the TD Sequential indicator on the weekly chart which is close to presenting a sell signal. The confirmation of this call could push Ethereum price down to the psychological level at $1,000 if bears can manage to crack the support area between $1,276 and $1,316 which should offer a lot of strength according to the IOMAP model.
Full Article
United States CFTC Oil NC Net Positions dipped from previous 508.6K to 504.6K
108727 January 30, 2021 05:05 FXStreet Market News
Note: All information on this page is subject to change. The use of this website constitutes acceptance of our user agreement. Please read our privacy policy and legal disclaimer.
Trading foreign exchange on margin carries a high level of risk and may not be suitable for all investors. The high degree of leverage can work against you as well as for you. Before deciding to trade foreign exchange you should carefully consider your investment objectives, level of experience and risk appetite. The possibility exists that you could sustain a loss of some or all of your initial investment and therefore you should not invest money that you cannot afford to lose. You should be aware of all the risks associated with foreign exchange trading and seek advice from an independent financial advisor if you have any doubts.
Opinions expressed at FXStreet are those of the individual authors and do not necessarily represent the opinion of FXStreet or its management. FXStreet has not verified the accuracy or basis-in-fact of any claim or statement made by any independent author: errors and Omissions may occur.Any opinions, news, research, analyses, prices or other information contained on this website, by FXStreet, its employees, partners or contributors, is provided as general market commentary and does not constitute investment advice. FXStreet will not accept liability for any loss or damage, including without limitation to, any loss of profit, which may arise directly or indirectly from use of or reliance on such information.
Full Article
United States CFTC Gold NC Net Positions up to $257.5K from previous $246.6K
108726 January 30, 2021 05:05 FXStreet Market News
Note: All information on this page is subject to change. The use of this website constitutes acceptance of our user agreement. Please read our privacy policy and legal disclaimer.
Trading foreign exchange on margin carries a high level of risk and may not be suitable for all investors. The high degree of leverage can work against you as well as for you. Before deciding to trade foreign exchange you should carefully consider your investment objectives, level of experience and risk appetite. The possibility exists that you could sustain a loss of some or all of your initial investment and therefore you should not invest money that you cannot afford to lose. You should be aware of all the risks associated with foreign exchange trading and seek advice from an independent financial advisor if you have any doubts.
Opinions expressed at FXStreet are those of the individual authors and do not necessarily represent the opinion of FXStreet or its management. FXStreet has not verified the accuracy or basis-in-fact of any claim or statement made by any independent author: errors and Omissions may occur.Any opinions, news, research, analyses, prices or other information contained on this website, by FXStreet, its employees, partners or contributors, is provided as general market commentary and does not constitute investment advice. FXStreet will not accept liability for any loss or damage, including without limitation to, any loss of profit, which may arise directly or indirectly from use of or reliance on such information.
Full Article
European Monetary Union CFTC EUR NC Net Positions increased to €165.3K from previous €163.5K
108725 January 30, 2021 05:02 FXStreet Market News
Note: All information on this page is subject to change. The use of this website constitutes acceptance of our user agreement. Please read our privacy policy and legal disclaimer.
Trading foreign exchange on margin carries a high level of risk and may not be suitable for all investors. The high degree of leverage can work against you as well as for you. Before deciding to trade foreign exchange you should carefully consider your investment objectives, level of experience and risk appetite. The possibility exists that you could sustain a loss of some or all of your initial investment and therefore you should not invest money that you cannot afford to lose. You should be aware of all the risks associated with foreign exchange trading and seek advice from an independent financial advisor if you have any doubts.
Opinions expressed at FXStreet are those of the individual authors and do not necessarily represent the opinion of FXStreet or its management. FXStreet has not verified the accuracy or basis-in-fact of any claim or statement made by any independent author: errors and Omissions may occur.Any opinions, news, research, analyses, prices or other information contained on this website, by FXStreet, its employees, partners or contributors, is provided as general market commentary and does not constitute investment advice. FXStreet will not accept liability for any loss or damage, including without limitation to, any loss of profit, which may arise directly or indirectly from use of or reliance on such information.
Full Article
Australia CFTC AUD NC Net Positions declined to $0.9K from previous $4.9K
108724 January 30, 2021 05:02 FXStreet Market News
Note: All information on this page is subject to change. The use of this website constitutes acceptance of our user agreement. Please read our privacy policy and legal disclaimer.
Trading foreign exchange on margin carries a high level of risk and may not be suitable for all investors. The high degree of leverage can work against you as well as for you. Before deciding to trade foreign exchange you should carefully consider your investment objectives, level of experience and risk appetite. The possibility exists that you could sustain a loss of some or all of your initial investment and therefore you should not invest money that you cannot afford to lose. You should be aware of all the risks associated with foreign exchange trading and seek advice from an independent financial advisor if you have any doubts.
Opinions expressed at FXStreet are those of the individual authors and do not necessarily represent the opinion of FXStreet or its management. FXStreet has not verified the accuracy or basis-in-fact of any claim or statement made by any independent author: errors and Omissions may occur.Any opinions, news, research, analyses, prices or other information contained on this website, by FXStreet, its employees, partners or contributors, is provided as general market commentary and does not constitute investment advice. FXStreet will not accept liability for any loss or damage, including without limitation to, any loss of profit, which may arise directly or indirectly from use of or reliance on such information.
Full Article