Articles

US dollar drops as March winds down. What’s happening
126806 March 31, 2021 22:17 Forexlive Latest News Market News
Heavy dollar selling kicks in

The US dollar is taking a big hit at the moment, particularly against CAD, other commodity currencies and the pound.
If you’re looking for explanations, you’re come to the wrong place. It’s quarter end and this is the way it goes. The London fix at the top of the hour will mean even more whippy moves.
Full Article
USD/CAD Price Analysis: Dives to one-week lows, around mid-1.2500s
126804 March 31, 2021 22:17 FXStreet Market News
- USD/CAD added to its intraday losses and dropped to one-week lows in the last hour.
- A convincing break below the 1.2600 confluence support aggravated the bearish pressure.
- Oversold RSI on the 1-hour chart warrants some caution before placing fresh bearish bets.
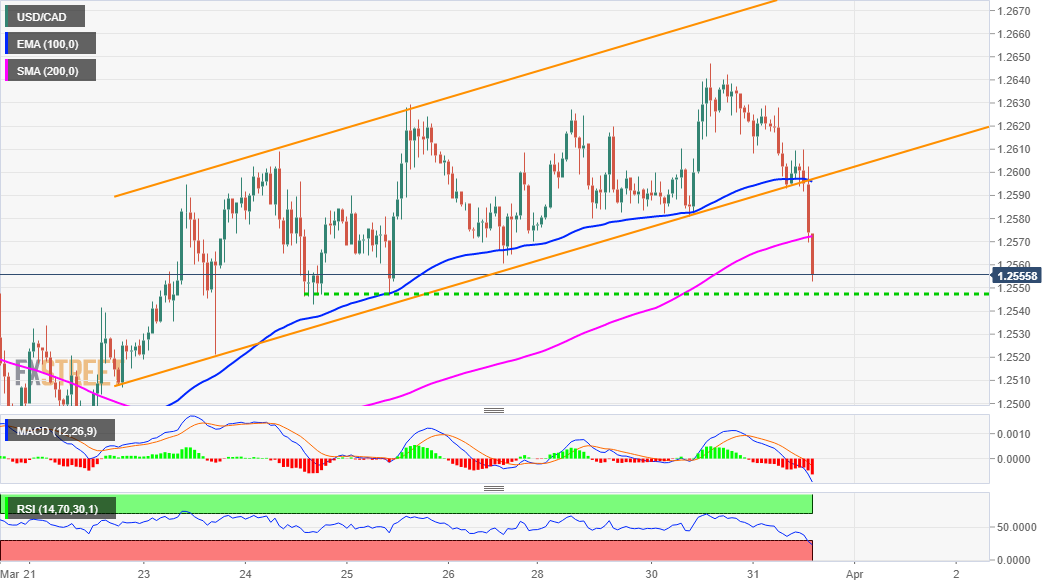
The USD/CAD pair witnessed some heavy selling during the early North American session and dived to one-week lows, around the 1.2560 region in the last hour.
A sustained break below the 1.2600 confluence support was seen as a key trigger for intraday bearish traders. The mentioned handle comprised of 100-hour SMA and the lower boundary of over one-week-old ascending channel and should now act as a key pivotal point for the next leg of a directional move.
The USD/CAD pair has now reversed the previous day’s positive move to the highest level in nearly three-week tops, with bulls failing to defend 200-hour SMA. Sustained weakness below might have already set the stage for a further depreciating move amid a softer tone surrounding the US dollar.
Meanwhile, technical indicators on 4-hour/daily charts are yet to confirm a bearish breakdown. Moreover, RSI (14) on the 1-hour chart is already flashing slightly oversold conditions. This, in turn, warrants some caution for aggressive bearish traders and positioning for any further decline.
Hence, any subsequent fall is more likely to find decent support and remain limited near the 1.2550 horizontal support. That said, some follow-through selling has the potential to drag the USD/CAD pair further towards challenging the key 1.2500 psychological mark.
In the meantime, any attempted recovery move now seems to confront immediate resistance near the 1.2580-85 region. This is closely followed by the 1.2600 support breakpoint, which if cleared might trigger a short-covering move and push the USD/CAD pair back towards the 1.2625-30 supply zone.
USD/CAD 1-hour chart
Techincal levels to watch
Full Article
US: Chicago PMI jumps to 66.3 in March vs. 60.7 expected
126803 March 31, 2021 22:09 FXStreet Market News
- Chicago PMI rose sharply to 66.3 in March.
- US Dollar Index is edging lower toward 93.00.
The data published by the ISM-Chicago showed on Wednesday that the Chicago Purchasing Managers’ Index (PMI) in March improved sharply to 66.3 in March from 59.5 in February. This reading came in better than the market expectation of 60.7.
Market reaction
The greenback continues to weaken against its major rivals during the American trading hours. As of writing, the US Dollar Index was down 0.2% on a daily basis at 93.11.
Full Article
Elrond Price Forecast: EGLD bounded between two key levels, awaits major move
126799 March 31, 2021 22:05 FXStreet Market News
- Elrond price is contained inside a significant symmetrical triangle pattern.
- The digital asset faces several critical resistance points on way up.
- EGLD is on verge of 45% move within next few days.
The Elrond price has been trading inside a tightening range for several weeks now and seems to be on the verge of a potential 45% breakout or breakdown. The digital asset faces steep resistance ahead but also has robust support.
Elrond price on brink of massive move
On the 12-hour chart, the Elrond price has established a symmetrical triangle pattern forming the top trend line at about $148. The lower support level is $125.
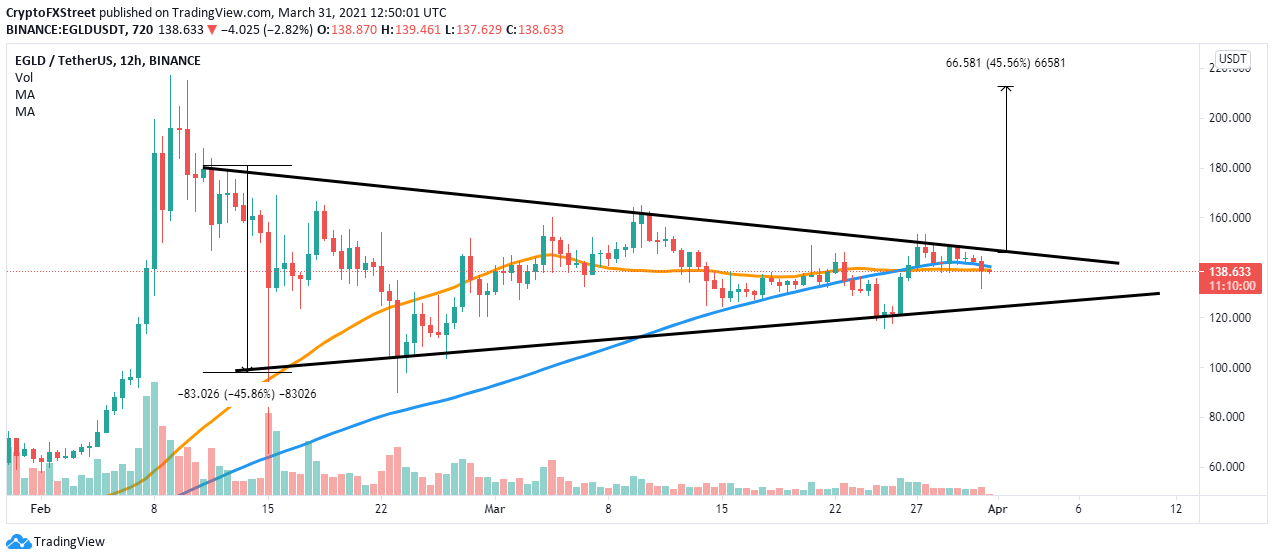
EGLD/USD 12-hour chart
The digital asset faces a lot of resistance ahead as the 50 and 100 SMAs both coincide at $140. Bulls must pass above these two levels and then break $148 for a massive move toward $212.
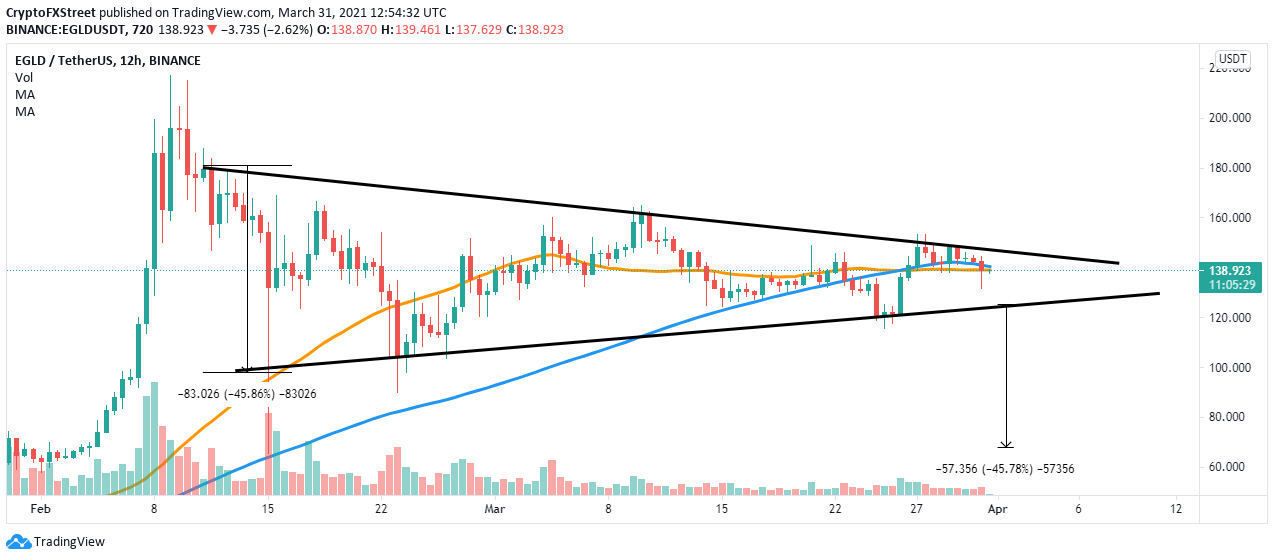
EGLD/USD 12-hour chart
On the other hand, a rejection from $140 would lead EGLD down to $124. A breakdown below this key level will drive the Elrond price toward $67.
Full Article
S&P 500 Index opens higher on the back of rising tech stocks
126798 March 31, 2021 22:05 FXStreet Market News
- Wall Street’s main indexes trade in the positive territory on Wednesday.
- Technology shares post strong gains as risk flows return to markets.
- Focus shifts to US President Joe Biden’s infrastructure plan.
Major equity indexes in the US opened higher on Wednesday as investors wait for US President Joe Biden to unveil his infrastructure plan, which is expected to be around $2 trillion. As of writing, the Dow Jones Industrial Average was up 0.2% on the day at 33,128, the S&P 500 was gaining 0.43% at 3,975 and the Nasdaq Composite was rising 1.08% at 13,036.
Among the 11 major S&P 500 sectors, the risk-sensitive Technology Index is up 1.24%, reflecting the upbeat market mood. On the other hand, the defensive RealEstate Index is losing nearly 1%.
Earlier in the day, the data published by the Automatic Data Processing (ADP) Research Institute showed that the private sector employment in the US rose by 517,000 in March following February’s increase of 176,000.
Full Article
US February pending home sales -10.6% vs -3.0% m/m expected
126797 March 31, 2021 22:02 Forexlive Latest News Market News
US February pending home sales data from the National Association of Realtors
- Prior was -2.8%
- Pending home sales index 110.3 vs 122.8 prior
- Sales y/y -2.7% vs +6.5% expected (prior +8.8%)
Tight inventories and cold February weather put a major damper on home sales in February. Each of the four regions experienced a decline.
Full Article
United States Pending Home Sales (YoY) dipped from previous 13% to -0.5% in February
126796 March 31, 2021 22:02 FXStreet Market News
EUR/USD is trading above 1.17, but off the highs, as markets await President Biden’s critical infrastructure speech. Europe’s covid issues weigh on the euro while ECB’s Lagarde dared markets to test the bank. EZ CPI missed with 1.3%. US ADP NFP also fell short with 517K.
Full Article
United States Pending Home Sales (MoM) below forecasts (-2.6%) in February: Actual (-10.6%)
126795 March 31, 2021 22:02 FXStreet Market News
EUR/USD is trading above 1.17, but off the highs, as markets await President Biden’s critical infrastructure speech. Europe’s covid issues weigh on the euro while ECB’s Lagarde dared markets to test the bank. EZ CPI missed with 1.3%. US ADP NFP also fell short with 517K.
Full Article
Palladium has the 2878.04 all-time highs in its sights – Commerzbank
126794 March 31, 2021 21:51 FXStreet Market News
Palladium continues to look perky as returned to the point of breakout and is now to head higher again. According to Axel Rudolph, Senior FICC Technical Analyst, the precious metal targets the 2878.04 all-time high.
Key quotes
“Palladium did a return to point of breakout, close to the November and January highs at 2516.51/2511.03, before heading back up again.”
“Since the decline from the current March high at 2758.00 looks corrective and can be subdivided into three smaller waves a, b and c, we expect the current advance to rise above the 2758.00 high towards the 2020 peak and all-time high at 2878.04.”
“Only an unexpected slip below the 2491.10 February high would make us re-evaluate our bullish view and may lead to further sideways trading around the 2278.99 March low and above the September-to-January lows at 2202.99/2184.67 to be witnessed.”
Full Article
United States Chicago Purchasing Managers’ Index above forecasts (60.7) in March: Actual (66.3)
126793 March 31, 2021 21:49 FXStreet Market News
EUR/USD is trading above 1.17, but off the highs, as markets await President Biden’s critical infrastructure speech. Europe’s covid issues weigh on the euro while ECB’s Lagarde dared markets to test the bank. EZ CPI missed with 1.3%. US ADP NFP also fell short with 517K.
Full Article
GBP/USD Price Analysis: Eases from tops, still well bid above 100-hour SMA
126791 March 31, 2021 21:49 FXStreet Market News
- A combination of factors assisted GBP/USD to gains positive traction on Wednesday.
- The intraday positive momentum faltered just ahead of the 1.3800 round-figure mark.
- Mixed oscillators on hourly/daily charts warrant some caution for aggressive traders.
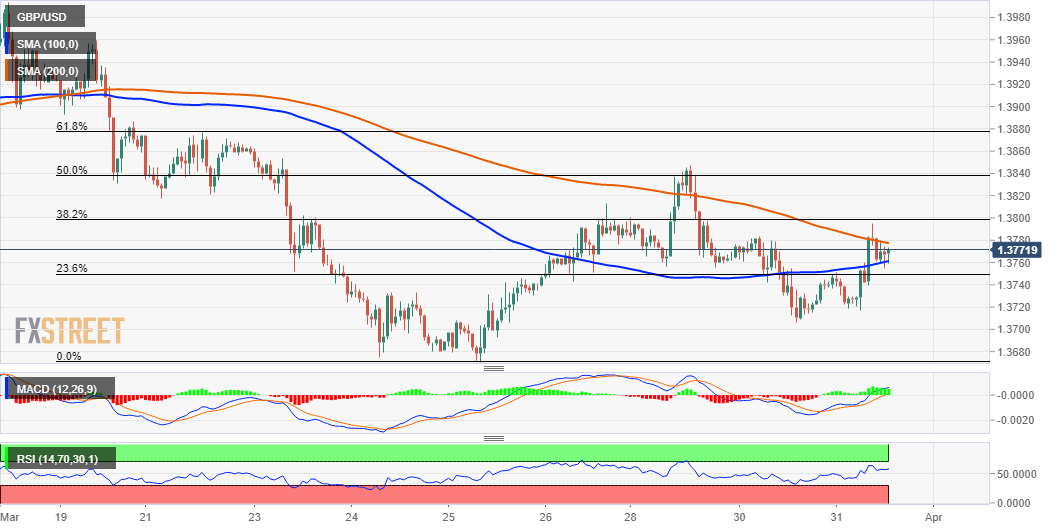
Having defended the 1.3700 mark in the previous session, the GBP/USD pair managed to regain some positive traction on Wednesday and snapped two consecutive days of the losing streak.
The British pound got a modest lift following the release of better-than-expected UK GDP growth figures for the fourth quarter of 2020. Apart from this, a modest US dollar pullback from multi-month tops provided an additional boost to the GBP/USD pair.
From a technical perspective, a sustained move back above 100-hour SMA was seen as a key trigger for intraday bullish traders. That said, the GBP/USD pair continued with its struggle to find acceptance above the 200-hour SMA and failed ahead of the 1.3800 mark.
The mentioned handle coincides with the 38.2% Fibonacci level of the 1.4002-1.3671 recent decline and should now act as a key pivotal point for short-term traders. In the meantime, the GBP/USD pair has now retreated back to 100-hour SMA, around the 1.3760-65 region.
Meanwhile, technical indicators on the 1-hour chart have been gaining positive traction and also recovered from the bearish zone on the 4-hour chart. However, oscillators on the daily chart are yet to confirm a bullish outlook and warrant caution for aggressive traders.
This makes it prudent to wait for a sustained strength beyond the 1.3800 mark before positioning for any further appreciating move. The GBP/USD pair might then resume its recent recovery move from multi-week lows and aim back to weekly tops, around mid-1.3800s.
On the flip side, the 1.3745-40 region now seems to protect the immediate downside, below which the GBP/USD pair could slide back towards the 1.3700 mark. Some follow-through selling should allow bearish traders to challenge multi-week lows, around the 1.3670 region.
GBP/USD 1-hour chart
Technical levels to watch
Full Article
Silver prices swing wither side of the $24.00 level as ADP data points to mending US economy
126790 March 31, 2021 21:45 FXStreet Market News
- Silver is trading either side of $24.00 as markets trade with caution ahead of key events later in the week.
- Biden will be unveiling infrastructure spending plans on Wednesday, ahead of ISM manufacturing on Thursday and NFP on Friday.
- ADP National Employment data points towards a solid NFP number and the ongoing healing of the US economy.
Spot silver prices (XAG/USD) are currently consolidating either side of the $24.00 level, as markets trade with a broad sense of caution ahead of key events later in the session and the week; US President Joe Biden will be unveiling the details of part one of his administration’s two-part infrastructure spending plan on Wednesday at 21:20BST, with the initial stage expected to carry a price tag of $2.25T and be funding in part by hikes on corporation taxes (and likely also on the rich). The US ISM Manufacturing PMI survey for the month of March is then released on Thursday ahead of the March US labour market report on Friday.
XAG/USD is yet to convincingly break to the south of the $24.00 level and prices are for now finding support around the prior annual lows at just above $24.00. Assuming this level does go, the door would be open (technically speaking) to a move down towards last September and November lows under $22.00, amid a lack of any notably key areas of support in the interim.
Driving the day
ADP’s estimate of the number of jobs added to the US economy in March was recently released. The payroll firm’s data indicated that 517K jobs were gained on the month, a little below expectations for ADP’s data to show 550K in job gains. Needless to say, however, more than half a million in job gains is pretty impressive. If the official labour market report on Friday confirms half a million in job gains, that would put total non-farm employment at roughly 143.5M, more than 13.5M above last April’s 130Mish lows, but still substantially below pre-pandemic levels of roughly 152.5M in total employment in the country.
Note that while ADP has not been particularly accurate in predicting the official NFP number over the past few months, it has helped to indicate the trend; i.e. ADP accurately predicted the stagnation in the rate at which jobs have been gained in the US into the end of 2020 and start of 2021, and may now be pointing towards the expected pick up in employment over the coming weeks. Wednesday’s ADP data should instill confidence in the market’s consensus prediction for 650K jobs to have been added to the US economy in March.
Markets, including precious metals such as silver, have not been particularly responsive to the above data, which came in pretty close to expectations. But more confirmation that the US economy is on the mend and is set to perform well in 2021 and beyond is unlikely to be a long-term positive for the likes of silver as better US economic conditions ahead likely means a combination of higher US government bond yields (which is negative for precious metals) and a stronger dollar (also precious metal negative) – the latter is particularly likely to be true so long as the US economy is on the path to outperforming its peers (such as the EU, UK and Japan), which seems likely amid the flood of fiscal stimulus already unleashed and in the pipeline in the form of infrastructure investment.
Full Article