Articles

Mexico Fiscal Balance, pesos dipped from previous -3.08B to -118.46B in June
157941 July 31, 2021 06:17 FXStreet Market News
Information on these pages contains forward-looking statements that involve risks and uncertainties. Markets and instruments profiled on this page are for informational purposes only and should not in any way come across as a recommendation to buy or sell in these assets. You should do your own thorough research before making any investment decisions. FXStreet does not in any way guarantee that this information is free from mistakes, errors, or material misstatements. It also does not guarantee that this information is of a timely nature. Investing in Open Markets involves a great deal of risk, including the loss of all or a portion of your investment, as well as emotional distress. All risks, losses and costs associated with investing, including total loss of principal, are your responsibility. The views and opinions expressed in this article are those of the authors and do not necessarily reflect the official policy or position of FXStreet nor its advertisers. The author will not be held responsible for information that is found at the end of links posted on this page.
If not otherwise explicitly mentioned in the body of the article, at the time of writing, the author has no position in any stock mentioned in this article and no business relationship with any company mentioned. The author has not received compensation for writing this article, other than from FXStreet.
FXStreet and the author do not provide personalized recommendations. The author makes no representations as to the accuracy, completeness, or suitability of this information. FXStreet and the author will not be liable for any errors, omissions or any losses, injuries or damages arising from this information and its display or use. Errors and omissions excepted.
The author and FXStreet are not registered investment advisors and nothing in this article is intended to be investment advice.
United States CFTC Oil NC Net Positions up to 449.8K from previous 448.7K
157940 July 31, 2021 06:17 FXStreet Market News
Information on these pages contains forward-looking statements that involve risks and uncertainties. Markets and instruments profiled on this page are for informational purposes only and should not in any way come across as a recommendation to buy or sell in these assets. You should do your own thorough research before making any investment decisions. FXStreet does not in any way guarantee that this information is free from mistakes, errors, or material misstatements. It also does not guarantee that this information is of a timely nature. Investing in Open Markets involves a great deal of risk, including the loss of all or a portion of your investment, as well as emotional distress. All risks, losses and costs associated with investing, including total loss of principal, are your responsibility. The views and opinions expressed in this article are those of the authors and do not necessarily reflect the official policy or position of FXStreet nor its advertisers. The author will not be held responsible for information that is found at the end of links posted on this page.
If not otherwise explicitly mentioned in the body of the article, at the time of writing, the author has no position in any stock mentioned in this article and no business relationship with any company mentioned. The author has not received compensation for writing this article, other than from FXStreet.
FXStreet and the author do not provide personalized recommendations. The author makes no representations as to the accuracy, completeness, or suitability of this information. FXStreet and the author will not be liable for any errors, omissions or any losses, injuries or damages arising from this information and its display or use. Errors and omissions excepted.
The author and FXStreet are not registered investment advisors and nothing in this article is intended to be investment advice.
Australia CFTC AUD NC Net Positions declined to $-39.3K from previous $-35.7K
157939 July 31, 2021 06:12 FXStreet Market News
Information on these pages contains forward-looking statements that involve risks and uncertainties. Markets and instruments profiled on this page are for informational purposes only and should not in any way come across as a recommendation to buy or sell in these assets. You should do your own thorough research before making any investment decisions. FXStreet does not in any way guarantee that this information is free from mistakes, errors, or material misstatements. It also does not guarantee that this information is of a timely nature. Investing in Open Markets involves a great deal of risk, including the loss of all or a portion of your investment, as well as emotional distress. All risks, losses and costs associated with investing, including total loss of principal, are your responsibility. The views and opinions expressed in this article are those of the authors and do not necessarily reflect the official policy or position of FXStreet nor its advertisers. The author will not be held responsible for information that is found at the end of links posted on this page.
If not otherwise explicitly mentioned in the body of the article, at the time of writing, the author has no position in any stock mentioned in this article and no business relationship with any company mentioned. The author has not received compensation for writing this article, other than from FXStreet.
FXStreet and the author do not provide personalized recommendations. The author makes no representations as to the accuracy, completeness, or suitability of this information. FXStreet and the author will not be liable for any errors, omissions or any losses, injuries or damages arising from this information and its display or use. Errors and omissions excepted.
The author and FXStreet are not registered investment advisors and nothing in this article is intended to be investment advice.
United States CFTC Gold NC Net Positions climbed from previous $196K to $199.4K
157938 July 31, 2021 06:12 FXStreet Market News
Information on these pages contains forward-looking statements that involve risks and uncertainties. Markets and instruments profiled on this page are for informational purposes only and should not in any way come across as a recommendation to buy or sell in these assets. You should do your own thorough research before making any investment decisions. FXStreet does not in any way guarantee that this information is free from mistakes, errors, or material misstatements. It also does not guarantee that this information is of a timely nature. Investing in Open Markets involves a great deal of risk, including the loss of all or a portion of your investment, as well as emotional distress. All risks, losses and costs associated with investing, including total loss of principal, are your responsibility. The views and opinions expressed in this article are those of the authors and do not necessarily reflect the official policy or position of FXStreet nor its advertisers. The author will not be held responsible for information that is found at the end of links posted on this page.
If not otherwise explicitly mentioned in the body of the article, at the time of writing, the author has no position in any stock mentioned in this article and no business relationship with any company mentioned. The author has not received compensation for writing this article, other than from FXStreet.
FXStreet and the author do not provide personalized recommendations. The author makes no representations as to the accuracy, completeness, or suitability of this information. FXStreet and the author will not be liable for any errors, omissions or any losses, injuries or damages arising from this information and its display or use. Errors and omissions excepted.
The author and FXStreet are not registered investment advisors and nothing in this article is intended to be investment advice.
Dogecoin price in quest of a buying stampede, as DOGE suffers without the spirit of FOMO
157936 July 31, 2021 06:05 FXStreet Market News
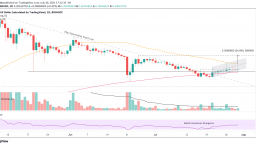
- Dogecoin price drifts upwards within an ascending parallel channel, but no hint of a resumption of the rally.
- May 19 low of $0.195 combines with the 200-day simple moving average (SMA) to transmit support.
- DOGE fails to tally the significant gains captured by other coins, as a nine-day gain only strikes 20%.
Dogecoin price has stumbled after the energetic charge of 11% on July 21, registering just a 7% gain over the last nine days. Many of the days have concluded with doji candlestick patterns, signifying a balance between buyers and sellers and overall uncertainty within the ranks of DOGE investors. Until the altcoin can register a daily close above the declining 50-day SMA, it is better to let Dogecoin price sway in the boundaries of the ascending parallel channel pattern.
Dogecoin price not getting a quality jump from the pump
A recent FXStreet article on July 26 pointed out that the social media ravings of Elon Musk about DOGE have failed to ignite a powerful and sustainable rally in Dogecoin price. It is unfamiliar territory for the meme token and diehard DOGE investors. Earlier this year, the rantings of Musk and other high-profile personalities would drive the cryptocurrency notably higher and secure the lead story on the news roll.
Without the prospect of social media-driven FOMO, it is profitable to consider the price structure being plotted by Dogecoin price. The rise from the July 20 low, excluding July 21, has taken on a corrective personality, suggesting it is a pause in the larger correction that began at the beginning of May.
To turn the probabilities in favor of an extended rally, Dogecoin price needs to close above the 50-day SMA at $0.233. If successful, DOGE may be motivated to test the June 25 high of $0.291, logging a 25% gain. The declining 50-day SMA will partially restrict a continuation of the rally as it pulls down on price.
DOGE/USD daily chart
Fortunately for Dogecoin price, three support levels are present that may arrest any selling pressure before it gets started. One level is the lower line of the ascending parallel channel tested today, followed by the May 19 low of $0.195, tested today, and finally the 200-day SMA at $0.191.
Even a daily close below the 200-day SMA does not guarantee a rapid descent as the July 20 low of $0.159 and the June 22 low of $0.152 create formidable support for Dogecoin price. A decline from the 200-day SMA to the June 22 low would yield a 20% loss. Interestingly, the June 22 low aligns with the May descending trend line, reinforcing the support value.
With many of the altcoins and Bitcoin at or near considerable resistance, the probability of short-term weakness in the cryptocurrency complex is tilted higher, leaving Dogecoin price with no tailwind to help press DOGE through the trigger price.
If this is a new chapter in the DOGE story, it is not interesting for market operators. In reality, Dogecoin price is learning the harsh realities of an environment that ignores the social media antics of the famous and cannot engineer the FOMO that underpinned the dramatic advance earlier in the year. As long as the 200-day SMA holds, the altcoin will likely continue the quest for a buying stampede.
Here, FXStreet’s analysts evaluate where DOGE could be heading next as it looks ready to jump.
Forexlive Americas FX news wrap: Core PCE comes in weaker but Amazon earnings/Covid worries dominate trader mindset
157932 July 31, 2021 05:45 Forexlive Latest News Market News
Forex news for North American traders on July 30, 2021.
The North American session started with concerns about the stock market and lingering fears above Covid. The earnings from Amazon after the close showed revenues less than expectations and revenue guidance going forward also lower. That came after Facebook the day before also scare the market with a less than rosy outlook. The NASDAQ was leading the way to the downside with the Core PCE data ahead.
That key data came in better than expected with YoY inflation at 3.5% versus 3.7% expected. The monthly increase came in at 0.4% vs 0.6% expected. Phew!
Is the peak in? Will inflation levels start to move back down?
Ford Motor came out today and forecasts car prices to move back down after the chip shortage is fixed. That makes sense as most carmakers have been, building but have a backlog of cars without chips. One can foresee, there would be a glut of auto’s when the final piece is added.
This transient inflation sentiment continues to be one that Fed Chair Powell reiterated this week after the FOMC decision.
On the other end of the Fed spectrum is Fed’s Bullard (St. Louis Fed President and hawk) who got back on his soapbox after the end of the “quiet period”. He said today that he still expects 7% growth in 2021 and above trend growth for “quite some time”. He added that he expects inflation to remain above the Fed target this year and next year, making up for the years below the level, and proposes tapering both government and MBS purchases at the same time – ending the taper process in early 2022. Bullard is a voting member in 2022 and is one of the Fed members who sees hikes in 2022.
It is too early to see how the cards play, but next week, employment statistics will be the major event that may further sway the markets.
Other economic data today showed University of Michigan consumer sentiment rising to 81.2 versus 80.8 expected (that was the preliminary as well). Expectations rose to 79.0 from 70.4. The inflation gauges dipped down to 4.7% from 4.8% for 1 year and 2.8% from 2.9% for 5-year expectations.
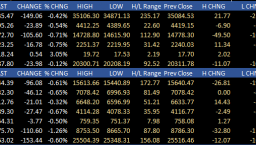
The better data did not prevent a decline in equities today, and declines for the week (although the major indices did close higher for the month. The changes for today, had the NASDAQ index falling by -0.71%. The S&P fell by -0.54% and the Dow shed 0.42%. The NASDAQ was down as much as -1.1% at the session lows.
European shares also fell across the board with the UK FTSE 100 down -0.65% and Spain’s Ibex down -1.26%.
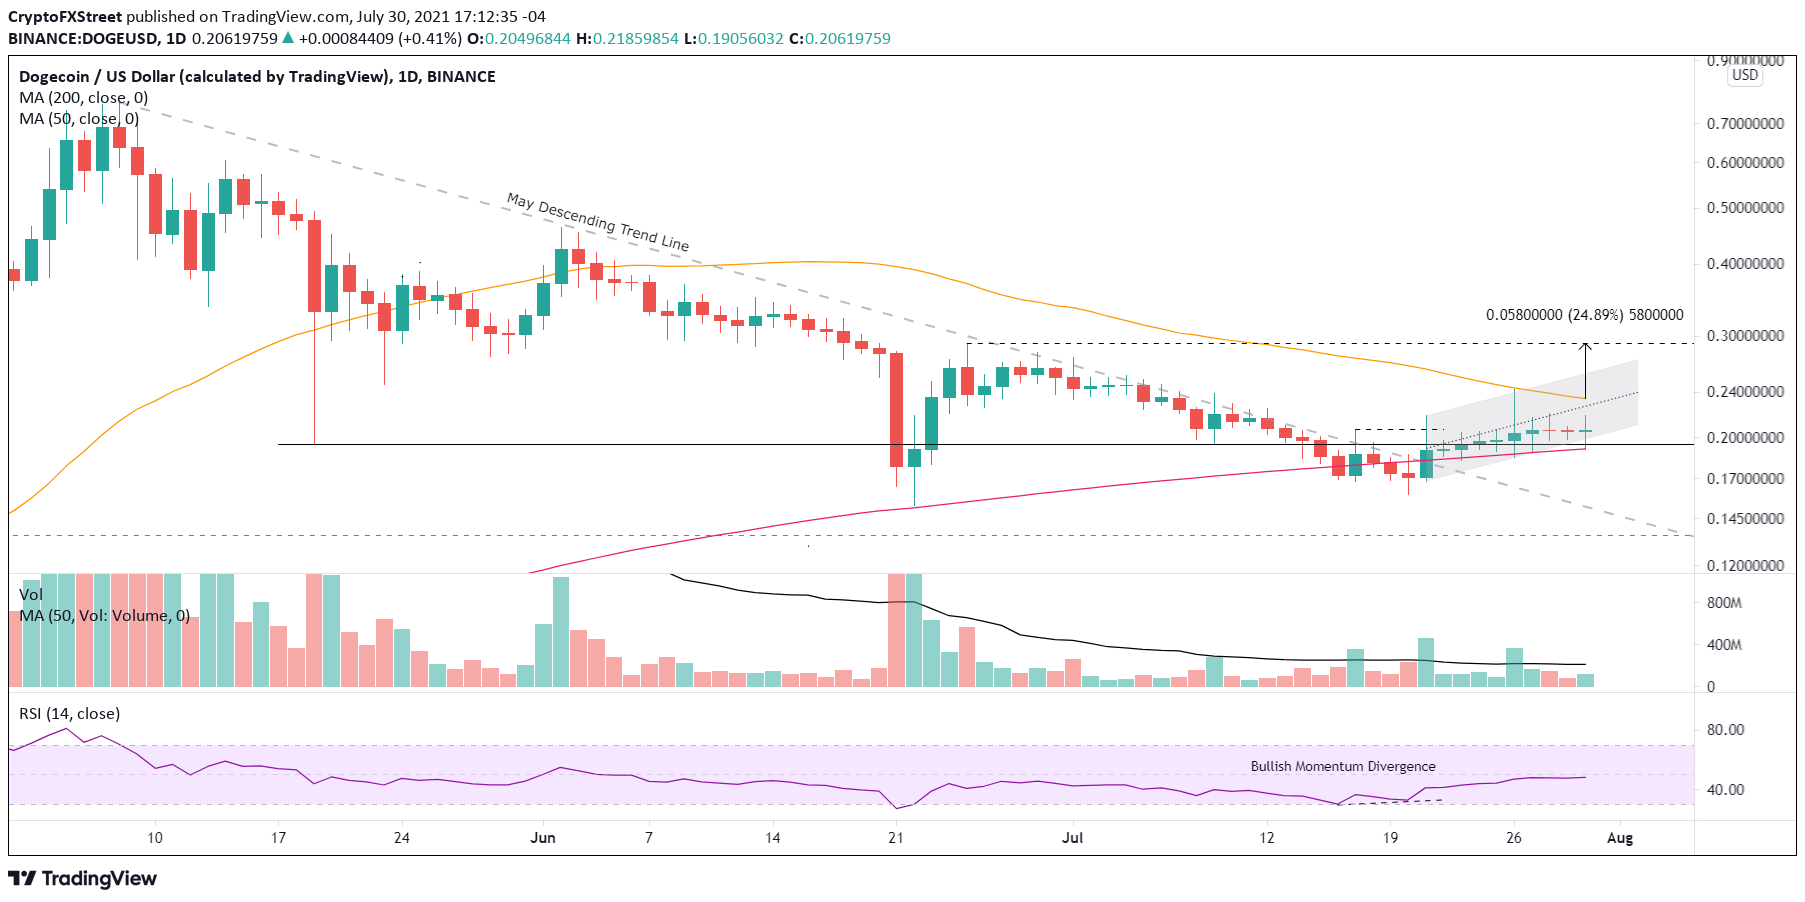
Below are the summaries of the changes for the major US and European indices:
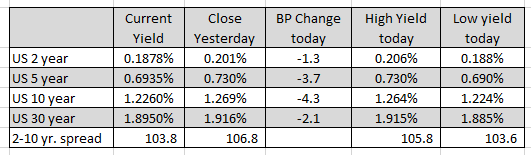
In the US debt market today, the yield are closing lower, helped by the week and expected core PCE. The 10 year yield was down -4.3 basis points and closed just off the lows at 1.226%.
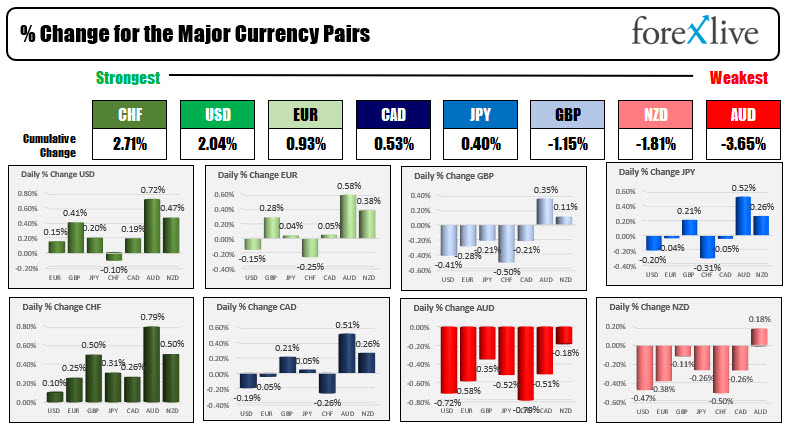
The USD did not take is clues from the lower rates or lower inflation (and move lower). Instead it moved higher in reaction to flight to safety flows. The CHF and the USD are ending the day higher (traditional flight to safety currencies) and are the strongest of the majors. The AUD and NZD are the weakest. That is also consistent with flight to safety/move out of risk flows. Below are the rankings of the major currencies and the % changes of the majors vs each other.
US jobs report next week
157931 July 31, 2021 04:02 Forexlive Latest News Market News
ISM data and jobs reports highlight the events next week
Monday will be the August 2nd and the start of a new month. That means the traditional ISM data, ADP employment, the US and Canada jobs reports.
Highlights on the economic calendar.
Monday (bank holiday in Canada)
- Japan consumer confidence 36.0 versus 37.4 last month
- German retail sales, estimate 1.9%
- German PMI final, 65.6 est
- UK PMI final, 60.4 est
- France PMI, 58.1 est
- Italy PMI final, 62.5 est
- US ISM manufacturing 60.8 versus 60.6 last month
Tuesday
- RBA rate statement. No change expected
- Spain’s unemployment change. Last -166.9 K
- Canada manufacturing PMI, last 56.5
- US factory orders, estimate 1.2% versus 1.7% last month
Wednesday
- New Zealand employment change, 0.7% quarter on quarter versus 0.6% last quarter. Unemployment rate 4.4% versus 4.7%
- Australia retail sales, -1.8% estimate versus -1.8% last month
- German final services PMI, 62.2 estimate
- France’s final services PMI 57.0 estimate
- UK’s final services PMI 57.8 estimate
- US ADP nonfarm employment change, 680K estimate versus 692K last month
- US ISM services PMI 60.5 versus 60.1 last month
Thursday
- German factory orders, 2.1% versus -3.7%
- ECB economic bulletin
- BOE interest rate decision. No change expected. Monetary policy report/monetary policy summary
- US trade balance $-72.5 billion versus $-71.2 billion
Friday
- Canada employment change. Last month 230.7 K. Canada unemployment rate last month 7.8%
- US nonfarm payroll, 925K estimate versus 850K last month. Unemployment rate 5.6% versus 5.9% last month. Average hourly earnings 0.3% versus 0.3% last month
Full Article
Colombia Interest rate meets forecasts (1.75%) in July
157930 July 31, 2021 04:02 FXStreet Market News
Information on these pages contains forward-looking statements that involve risks and uncertainties. Markets and instruments profiled on this page are for informational purposes only and should not in any way come across as a recommendation to buy or sell in these assets. You should do your own thorough research before making any investment decisions. FXStreet does not in any way guarantee that this information is free from mistakes, errors, or material misstatements. It also does not guarantee that this information is of a timely nature. Investing in Open Markets involves a great deal of risk, including the loss of all or a portion of your investment, as well as emotional distress. All risks, losses and costs associated with investing, including total loss of principal, are your responsibility. The views and opinions expressed in this article are those of the authors and do not necessarily reflect the official policy or position of FXStreet nor its advertisers. The author will not be held responsible for information that is found at the end of links posted on this page.
If not otherwise explicitly mentioned in the body of the article, at the time of writing, the author has no position in any stock mentioned in this article and no business relationship with any company mentioned. The author has not received compensation for writing this article, other than from FXStreet.
FXStreet and the author do not provide personalized recommendations. The author makes no representations as to the accuracy, completeness, or suitability of this information. FXStreet and the author will not be liable for any errors, omissions or any losses, injuries or damages arising from this information and its display or use. Errors and omissions excepted.
The author and FXStreet are not registered investment advisors and nothing in this article is intended to be investment advice.
Gold Weekly Forecast: XAU/USD bulls hesitate as focus shift to NFP
157926 July 31, 2021 03:09 FXStreet Market News
- Gold posted gains for the week despite Friday’s pullback.
- FOMC Chairman Powell’s remarks and disappointing data weighed on USD.
- Gold’s near-term technical outlook turns neutral as focus shifts to US July jobs report.
After closing the previous week in the negative territory, gold stayed on the back foot on Monday and dropped below $1,800. However, the subdued market action ahead of key macroeconomic events allowed the precious metal to stay in a consolidation phase on Tuesday. With the greenback coming under heavy selling pressure in the second half of the week, the XAU/USD pair managed to stage an impressive rebound. Following a rally to a fresh two-week high of $1,832 on Thursday, the pair retraced a portion of its upside but registered weekly gains by settling above $1,810.
What happened last week
The cautious market mood at the start of the week helped the USD stay resilient against its rivals but gold also attracted some demand as a safe-haven and XAU/USD struggled to make a decisive move in either direction.
On Wednesday, the US Federal Reserve announced that it left the benchmark interest rate, the target range for federal funds, unchanged at 0%-0.25% as widely expected. Moreover, the central bank noted that it will continue to buy at least $80 billion/month of Treasuries and $40 billion/month of mortgage-backed securities until substantial further progress is made on maximum employment and price stability goals. In its policy statement, the FOMC reiterated that it will use the full range of its tools to support the economic recovery.
During the press conference following the monetary policy decisions, FOMC Chairman Jerome Powell acknowledged that policymakers started debating how and when they can adjust asset purchases. Powell, however, refrained from suggesting that they could taper before the end of the year and investors assessed his tone as relatively dovish. In the meantime, Powell repeated that higher-than-expected inflation is caused by temporary factors. The US Dollar Index, which tracks the greenback’s performance against a basket of six major currencies, turned south following the FOMC event and dropped to its lowest level in a month below 92.00 on Friday, reflecting the broad-based USD weakness.
On Thursday, disappointing macroeconomic data releases from the US made it difficult for the USD to erase its losses and helped XAU/USD preserve its bullish momentum. The US Bureau of Economic Analysis (BEA) reported that the real Gross Domestic Product expanded at an annualized rate of 6.5% in the second quarter. This reading missed the market expectation of 8.5%. Additionally, the US Department of Labor announced that there were 400,000 initial claims for unemployment benefits in the week ending July 24, compared to analysts’ estimate of 380,000.
Finally, the BEA announced on Friday that the Core Personal Consumption Expenditures (PCE) Price Index edged higher to 3.5% on a yearly basis in June. This print came in lower than the market expectation of 3.7% and failed to trigger a noticeable market reaction. Nevertheless, falling US stocks and some hawkish Fed commentary provided a boost to the USD ahead of the weekend and XAU/USD reversed its direction. St. Louis Fed President James Bullard argued that the Fed should start reducing asset purchases this fall and added that he expects to see the initial rate hike in the last quarter of 2022. Furthermore, profit-taking on the last trading day of the month could also have played a role in gold’s weakness on Friday.
Next week
On Monday, the ISM will release the Manufacturing PMI report for July. Although the business activity in the manufacturing sector is expected to continue to expand at a robust pace, the Prices Paid Index component of the survey will be watched closely by market participants and a reading above 90 could revive inflation concerns and help the USD gather strength. The same goes for the ISM’s Services PMI report, which will be published on Wednesday.
On Thursday, the weekly Initial Jobless Claims will be the only data featured in the US economic docket. In the meantime, the Bank of England will announce its monetary policy decisions. It’s difficult to say if this event can have a direct impact on gold’s valuation but a sharp movement in the GBP/USD pair could affect the USD demand.
On Friday, the US Bureau of Labor Statistics will publish the Nonfarm Payrolls data for July. FOMC Chairman Jerome Powell said that they have some ground to cover on the labor market side with regards to “substantial further progress.” A stronger-than-expected reading could cause investors to price a hawkish policy outlook and lift the USD against its peers and vice versa.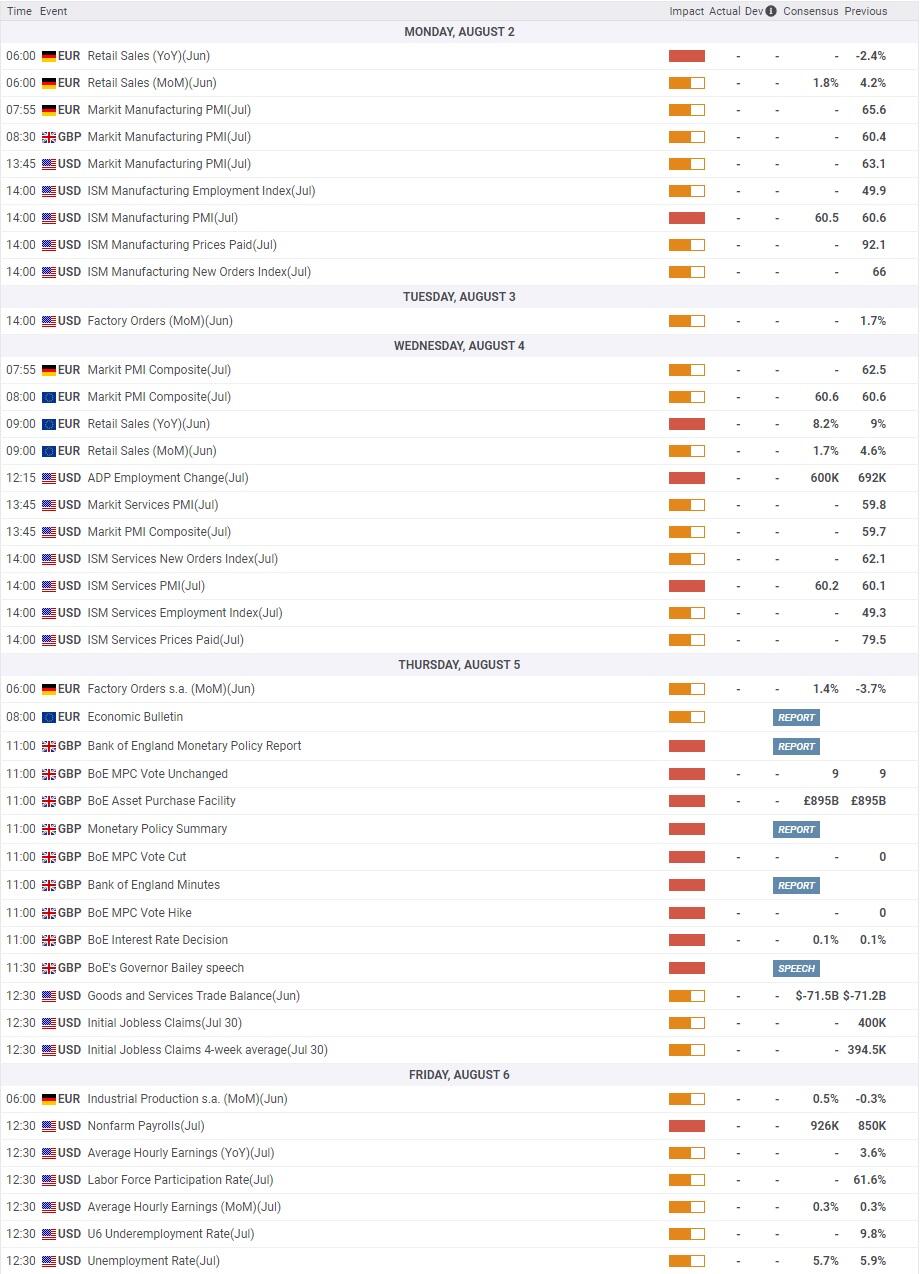
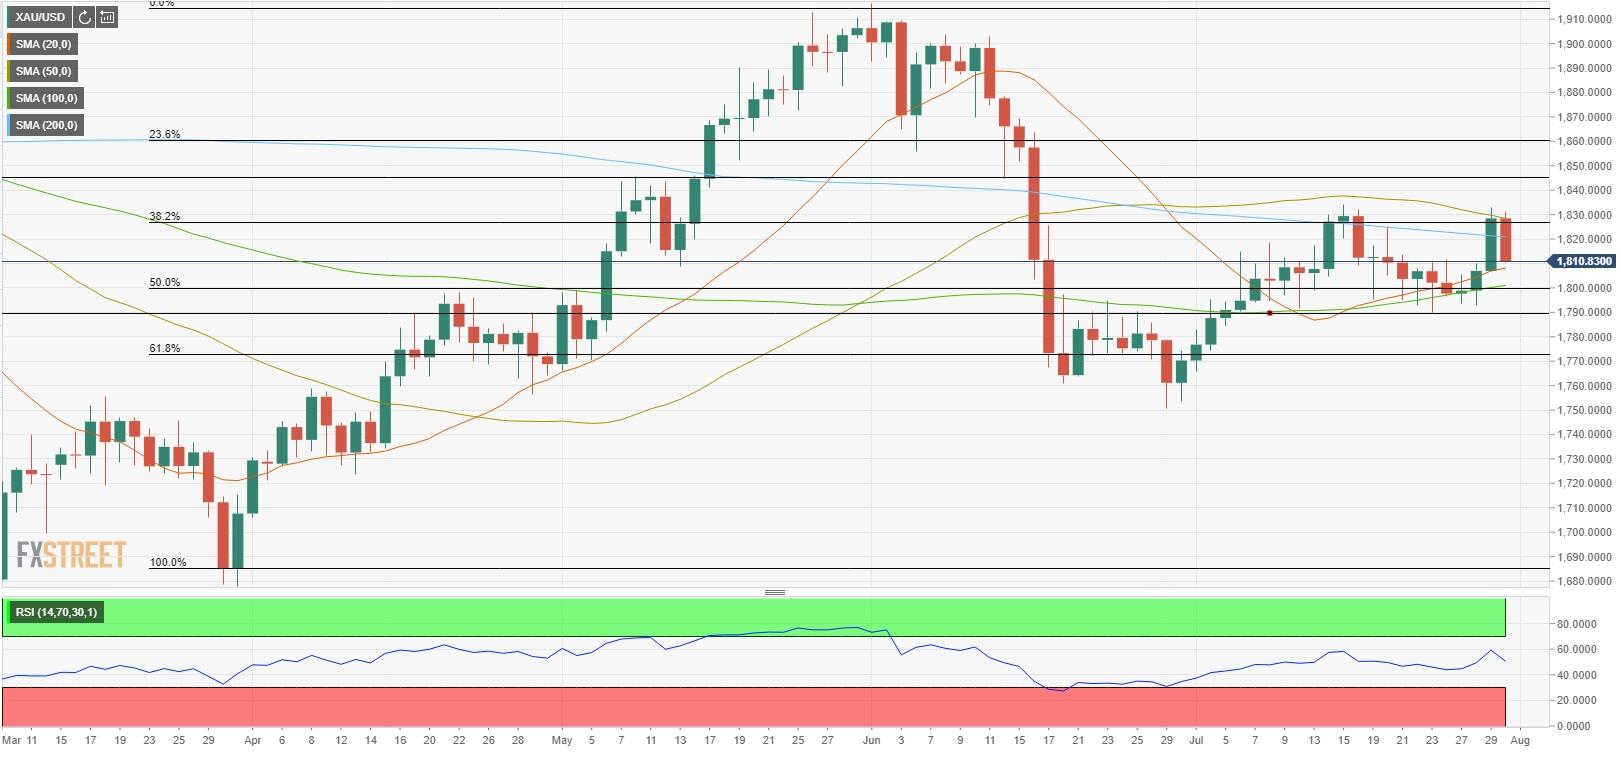
Gold technical outlook
Following Friday’s decline, the Relative Strength Index (RSI) indicator on the daily chart retreated to 50, pointing to a loss of bullish momentum. Additionally, gold closed the week below the critical 200-day SMA after rising above that level on Thursday, suggesting that buyers are struggling to remain in control. In the near term, the pair seems to be poised to move sideways between the 100-day SMA and 200-day SMA but the market reaction to Friday’s US jobs report could cause it to break out of that range.
On the upside, the initial resistance is located at $1,820 (200-day SMA) ahead of $1,830 (50-day SMA) and $1,845 (static level).
Supports, on the other hand, are located at $1,810 (20-day SMA), $1,800 (100-day SMA, psychological level, Fibonacci 50% retracement of the April-June uptrend) and $1,790 (July 23 low).
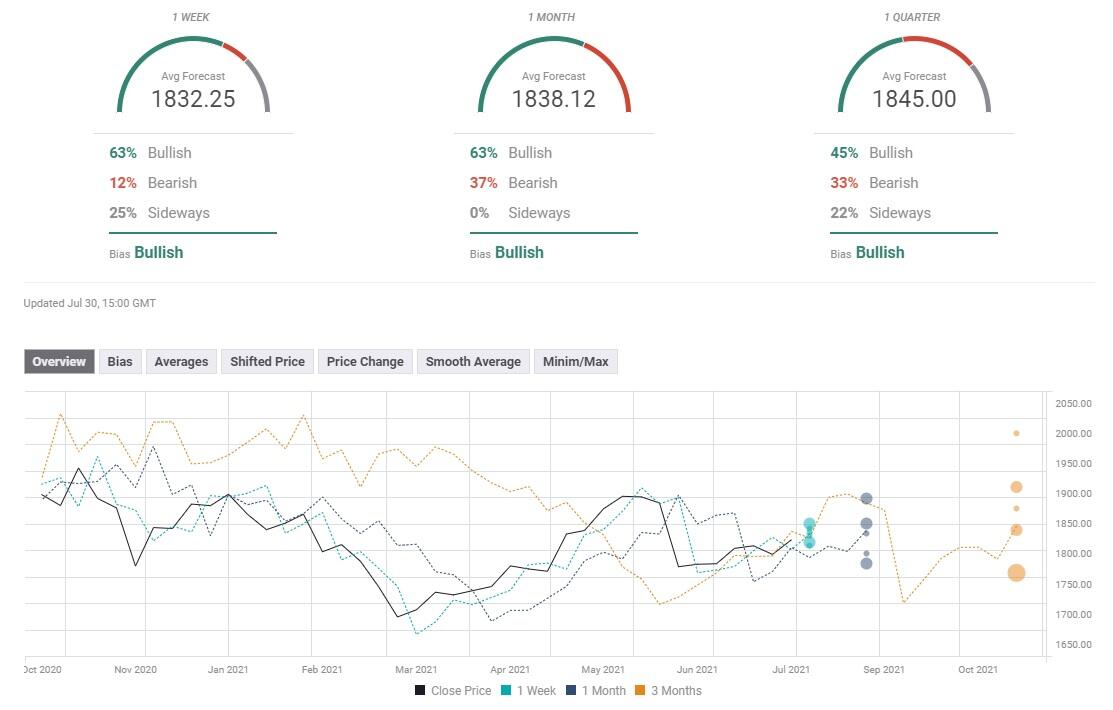
Gold sentiment poll
Gold’s near-term outlook remains bullish according to the FXStreet Forecast Poll with an average target of $1,832 on the one-week view. Similarly, the majority of experts see gold trading above its current level by the end of August.
MATIC Price Prediction: Polygon generates the price energy to test $1.75
157923 July 31, 2021 03:05 FXStreet Market News
- MATIC price curling below the 50-day simple moving average (SMA), logging three consecutive inside days.
- The symmetrical triangle on the four-hour chart realizes a Bollinger Band contraction that signals a sharp move.
- Polygon still carries a -13% loss in July despite the notable rebound from the monthly low.
MATIC price is nearing the resumption of the new advance as the contracting price action in the form of inside days, and a symmetrical triangle has created the price energy for a special breakout above the 50-day SMA at $1.09. Only a daily close below the June 22 low will void the bullish short-term narrative for Polygon.
MATIC price contraction should lead to noteworthy expansion
MATIC price closed the last three days with inside days on the bar charts, positioning Polygon for another attempt to break above the resistance being exerted by the psychologically important $1.00 and the 50-day SMA at $1.09.
One result of the tightening MATIC price is forming a symmetrical triangle pattern on the four-hour chart and compression in the Bollinger Band Width (BBW) to levels that preceded three marked moves in Polygon beginning in early June. Points to the explosiveness that can follow such price contractions.
The measured move of the minor symmetrical triangle is 17.55%, projecting a MATIC price target of $1.25. The target aligns with highs printed in the latter part of June.
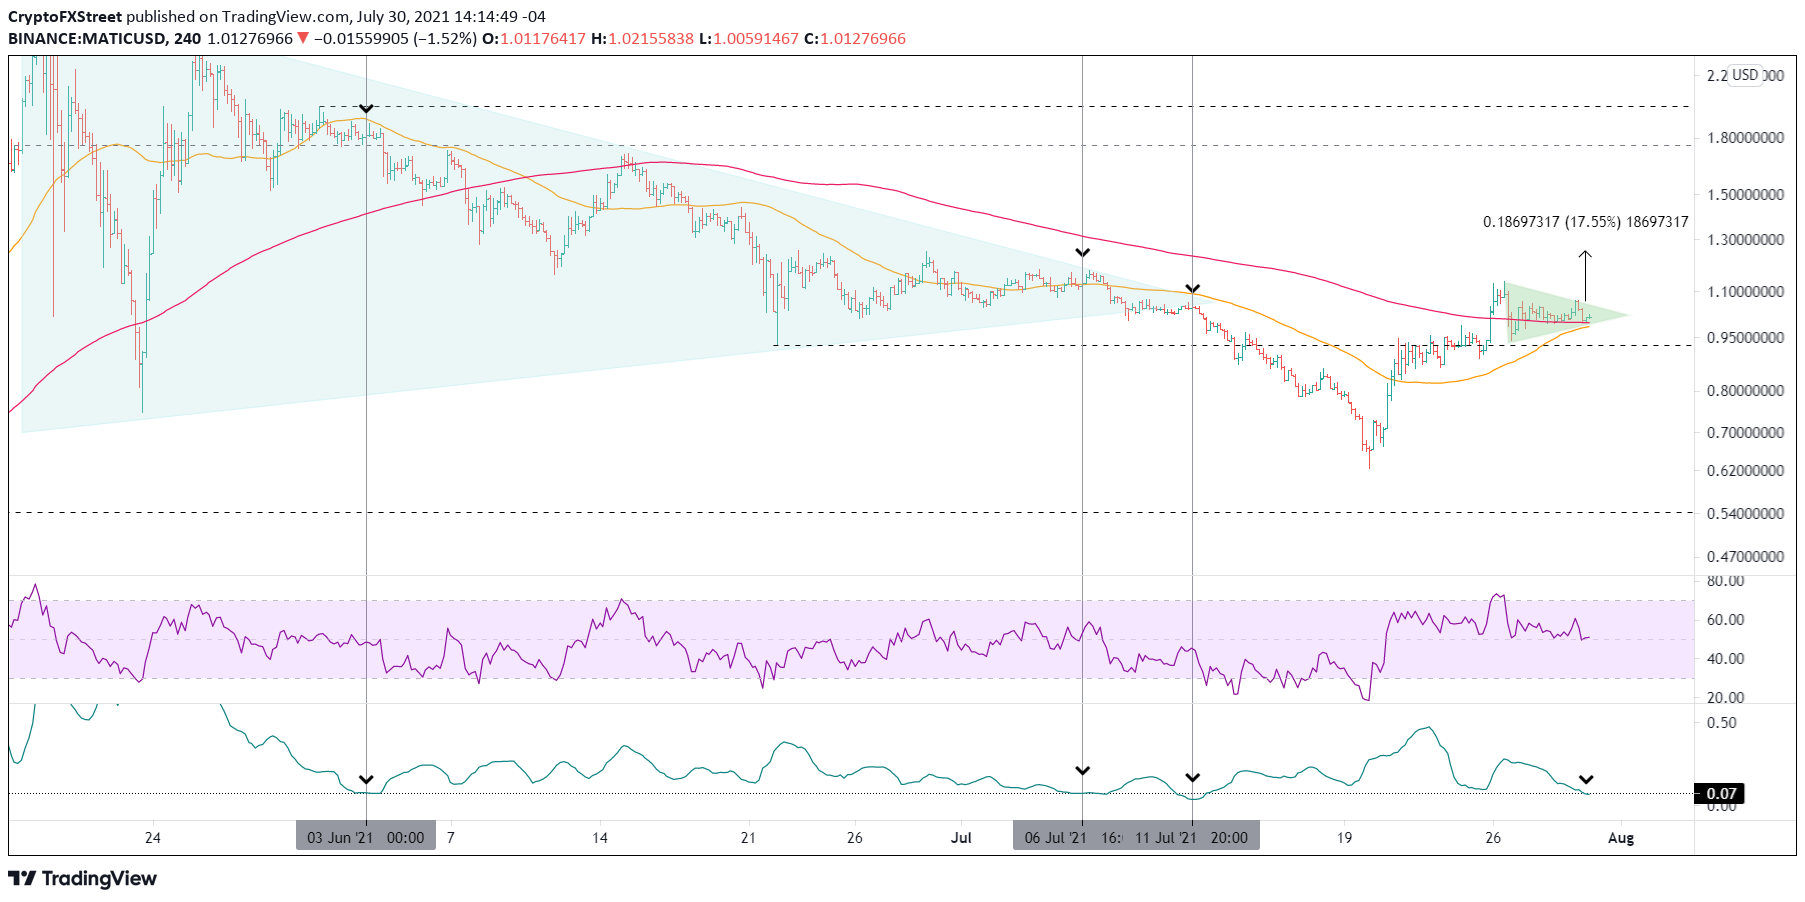
MATIC/USD 4-hour chart
If MATIC price resolves the minor symmetrical triangle to the upside and reaches the measured move target, Polygon will continue to advance to a range of price congestion around $1.75, representing a 70% leap from the current price. A move of that magnitude would shift the 50-day SMA higher, creating a new, important source of support for extending the advance to the all-time high.
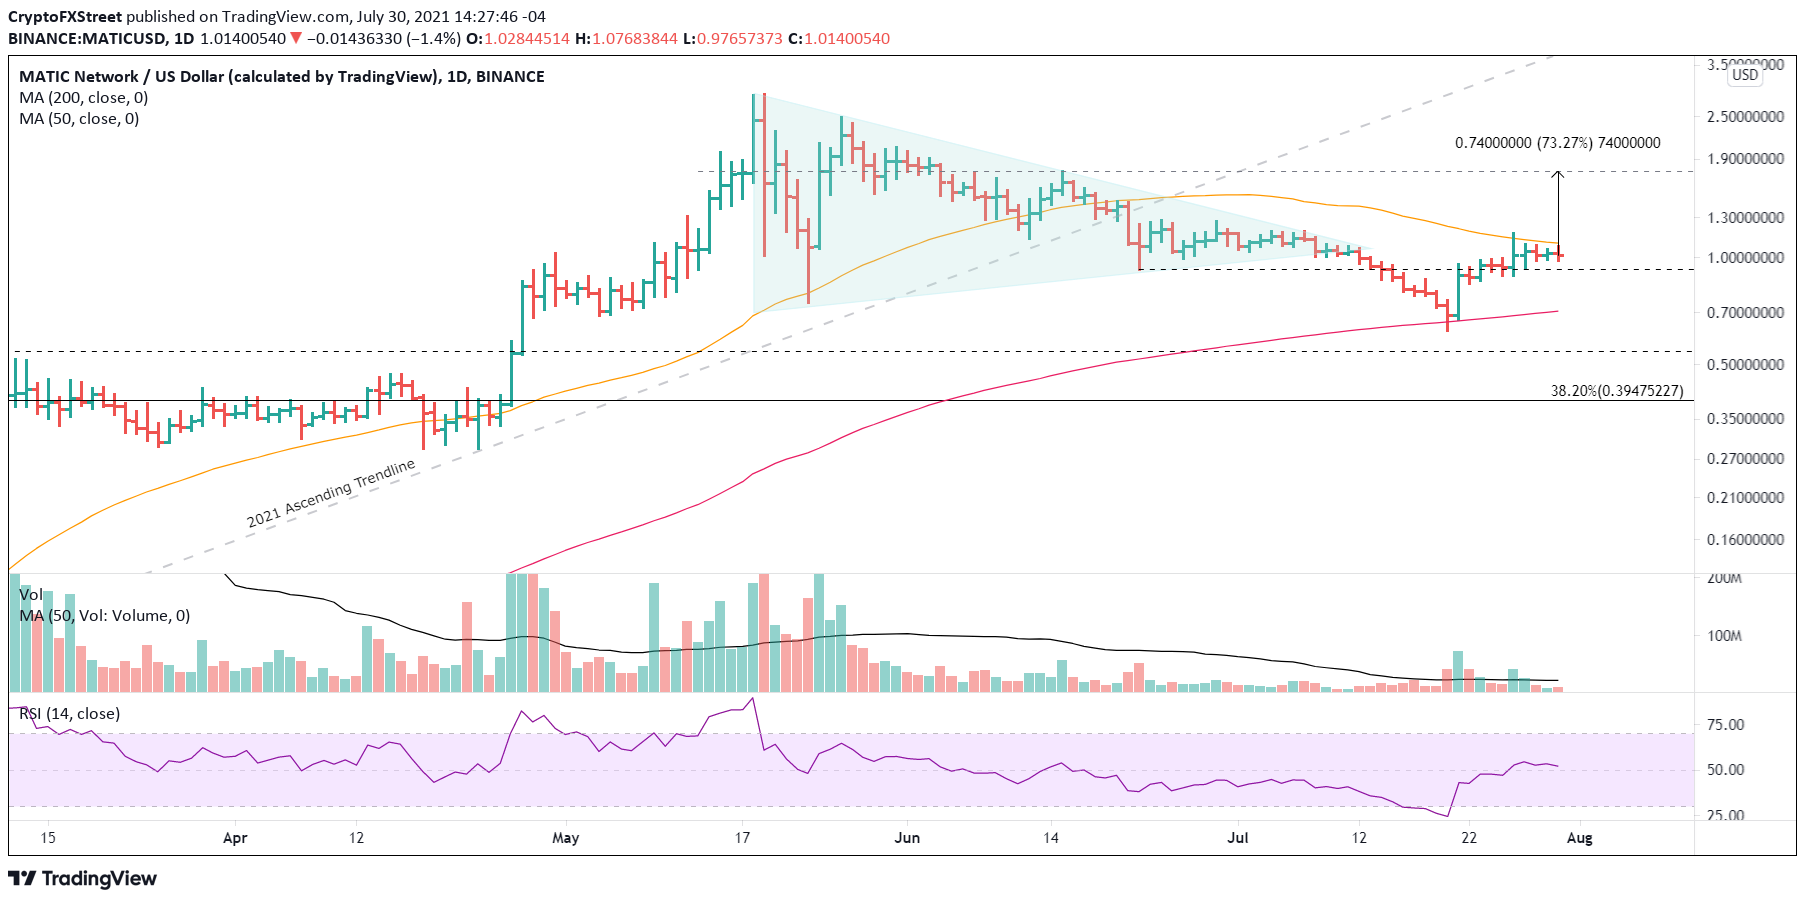
MATIC/USD daily chart
The bullish forecast needs to hold the June 22 low of $0.92 to control any MATIC price weakness that may assert itself. Otherwise, Polygon is at risk of returning to the 200-day SMA at $0.70. It would be a fatal blow to the digital asset and reopen the discussion of a deeper correction.
MATIC price is primed for higher prices, and the significant price contraction indicates that the resolution from the minor symmetrical triangle will be explosive. The question remains if the combined resistance of $1.00 and the 50-day SMA at $1.09 will prove too challenging for Polygon.
Here, FXStreet’s analysts evaluate where Polygon could be heading next as it seems bound for higher highs.
MUFG trade of the week: Sell EUR/GBP
157921 July 31, 2021 02:35 Forexlive Latest News Market News
Trade for the coming week
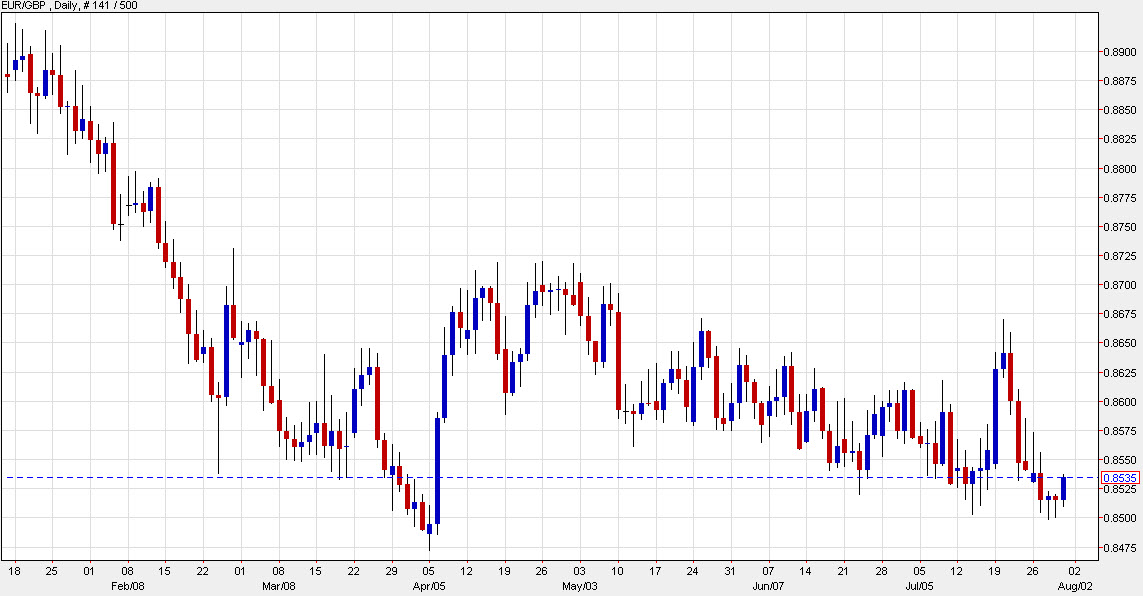
Mitsubishi UFG suggests selling EUR/GBP in its weekly FX pick.
The pair suggests selling it from spot at 0.8520 with a target of 0.8350 and a stop at 0.8670.
“We are recommending a short EUR/GBP trade idea to reflect building confidence in our bullish outlook for GBP,” they write. “We have been encouraged by recent positive covid data from the Uk suggesting that the risk of further pandemic-related disruption to the UK economic recovery has diminished.”
Full Article
Top 3 Price Prediction Bitcoin, Ethereum, Ripple: Crypto majors strike formidable resistance, short-term upside limited
157916 July 31, 2021 01:35 FXStreet Market News
- Bitcoin price has realized the easy money, now faces a myriad of resistance levels.
- Ethereum price tags the upper trend line of the descending triangle, but flashes a bearish momentum divergence on the intra-day charts.
- XRP price reaches inflection point after a 42% rally over nine trading days.
Bitcoin price has spoiled investors during a relentless rebound from the July low. Still, it is time for some form of corrective process to release the price compression generated during the rebound. Ethereum price records a rare rebound of nine consecutive up days, confirming a firm low for the smart contracts giant. XRP price triggers double bottom, raising the probabilities of a test of $1.00.
Bitcoin price prefers a correction in time, not price
Bitcoin price closed yesterday with a rare nine consecutive up days and a gain of over 34% during the streak, marking the best gain nine-day return since February and, more importantly, a definitive break with the corrective price action that dominated BTC since the March crash. Moreover, the rebound lifted the daily Relative Strength Index (RSI) to the first overbought reading since the March high.
The resumption of dominance in the cryptocurrency complex began with a daily close above the upper trend line of a falling wedge pattern on July 22. The pattern indicated that a bullish resolution of the Bitcoin price churn was near as downside momentum continued to wane. The result was a bullish engulfing week on the bar charts last week, establishing the basis for this week’s slingshot higher.
The pace and magnitude of the move pushed Bitcoin price to a quadfecta of resistance that will dictate the intentions of BTC over the next few weeks. The first point of resistance is the Ichimoku Cloud. It has been influencing prices for the last three days. Beyond the Ichimoku Cloud is the June 15 high of $41,322, the 38.2% Fibonacci retracement of the April-June correction at $42,589 and the February 28 low of $43,016. Combined, these levels represent a significant barrier to extending the rally in the coming days, especially when considering an overbought condition on the daily RSI.
An ideal scenario for Bitcoin price is a correction in time, meaning BTC moves sideways with a mild downward drift, releasing the oversold condition. It would be a sign of a strong bid and a reluctance to capture profits.
A correction in price starts with the June 29 high of $36,675, providing credible support. If the level fails to restrict the selling pressure, the rising 50-day simple moving average (SMA) at $34,711 should successfully resist any additional weakness, yielding an almost 11% decline from the current price.
Any weakness below the tactically important 50-day SMA would require a rethink of the bullish narrative.
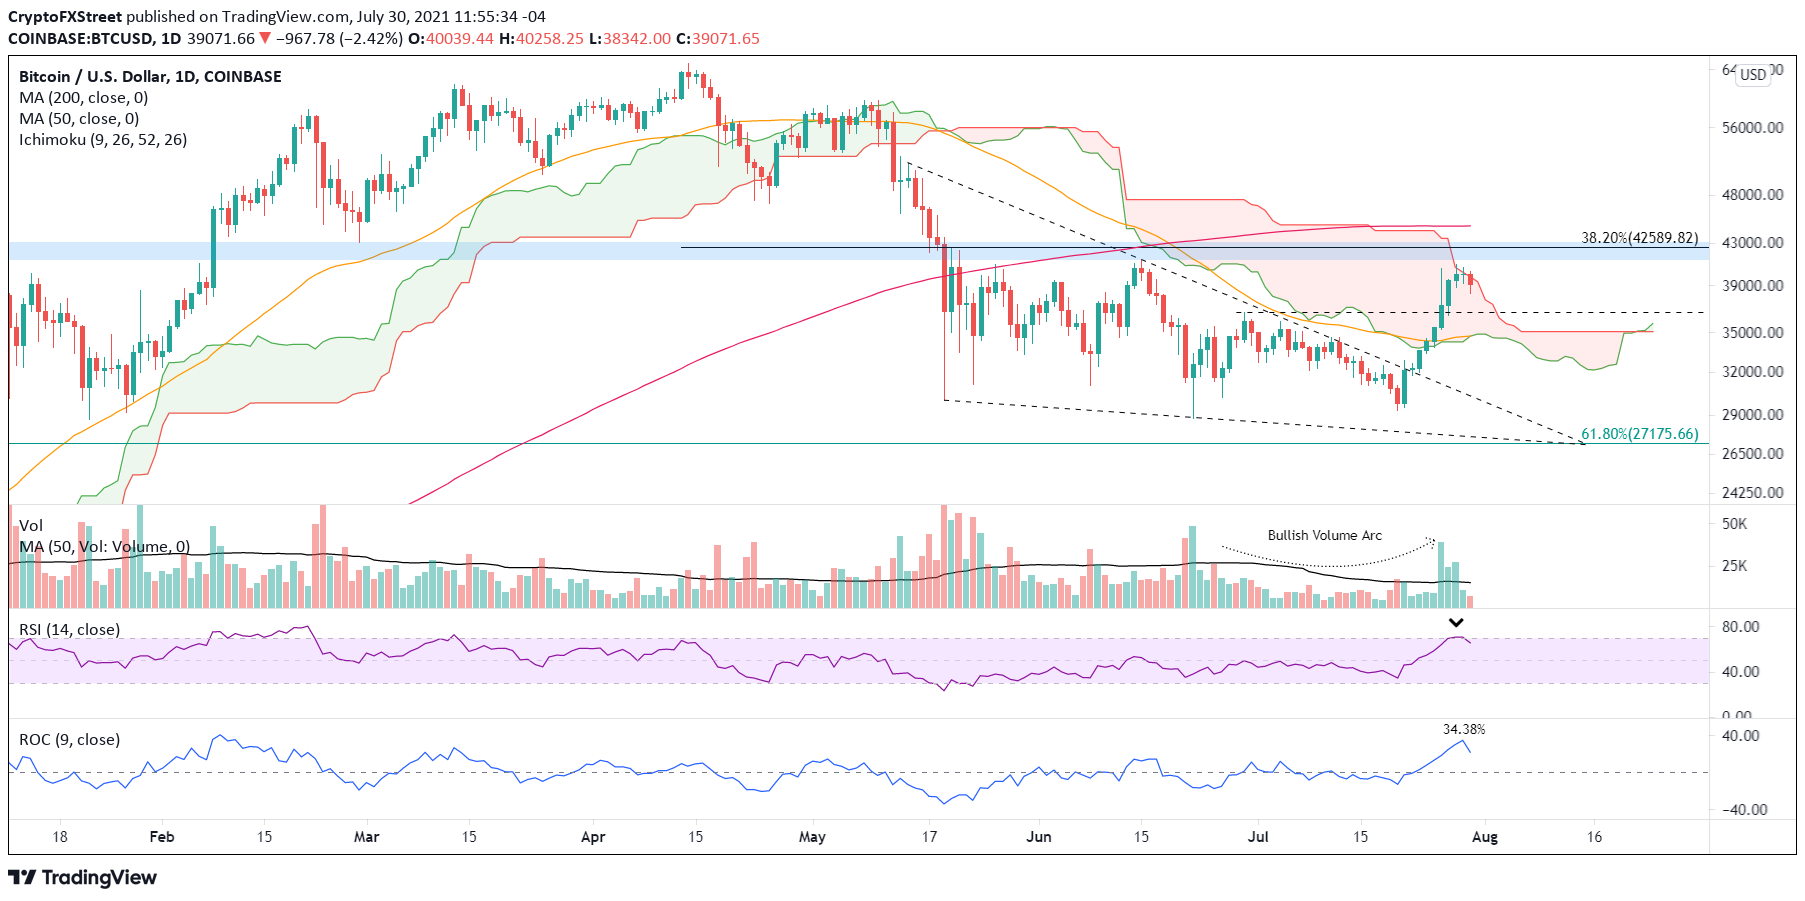
BTC/USD daily chart
Here, FXStreet’s analysts evaluate where BTC could be heading next as it seems bound for a rebound before capitulation.
Ethereum price reaches a secure position
Ethereum price has recorded nine consecutive up days with a total gain of 33% since the July 20 low, representing the best nine-day return since the May high and lifting ETH to the upper trend line of the descending triangle pattern enforcing price action since the March collapse.
Unlike Bitcoin price, ETH is not overbought on the daily RSI, suggesting that Ethereum price could extend the rally beyond the trend line before evolving into a correction. However, there is a bearish momentum divergence on the six-hour chart, providing the technical impetus for a consolidation at this point. The momentum divergence also aligns with a rising wedge pattern on the specified timeframe.
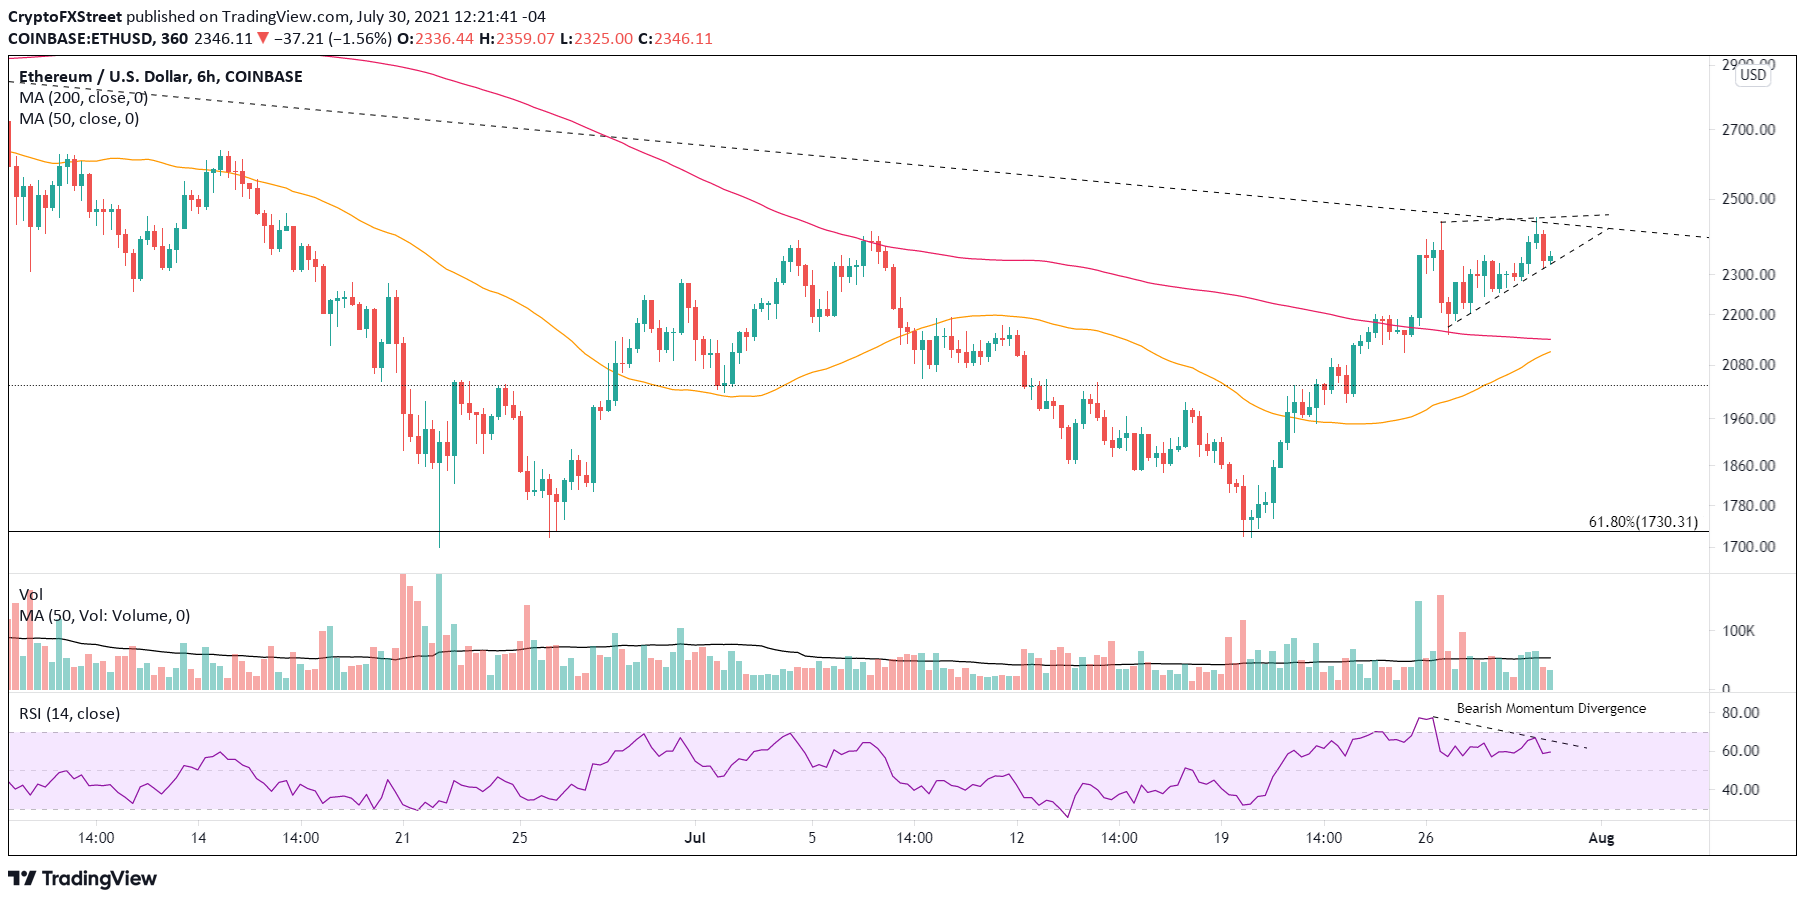
ETH/USD 6-hour chart
Ethereum price is afforded a tremendous layer of support, framed by the 2020 ascending trend line, the 200-day SMA at $2,132 and the 50-day SMA at $2,140. The range is strengthened by the February high of $2,041, providing a secure position for ETH.
Suppose Ethereum price fails to bottom at the February high. In that case, it will raise the probability of a retest of the July low of $1,720 and possibly a breakdown of the triangle’s horizontal support line.
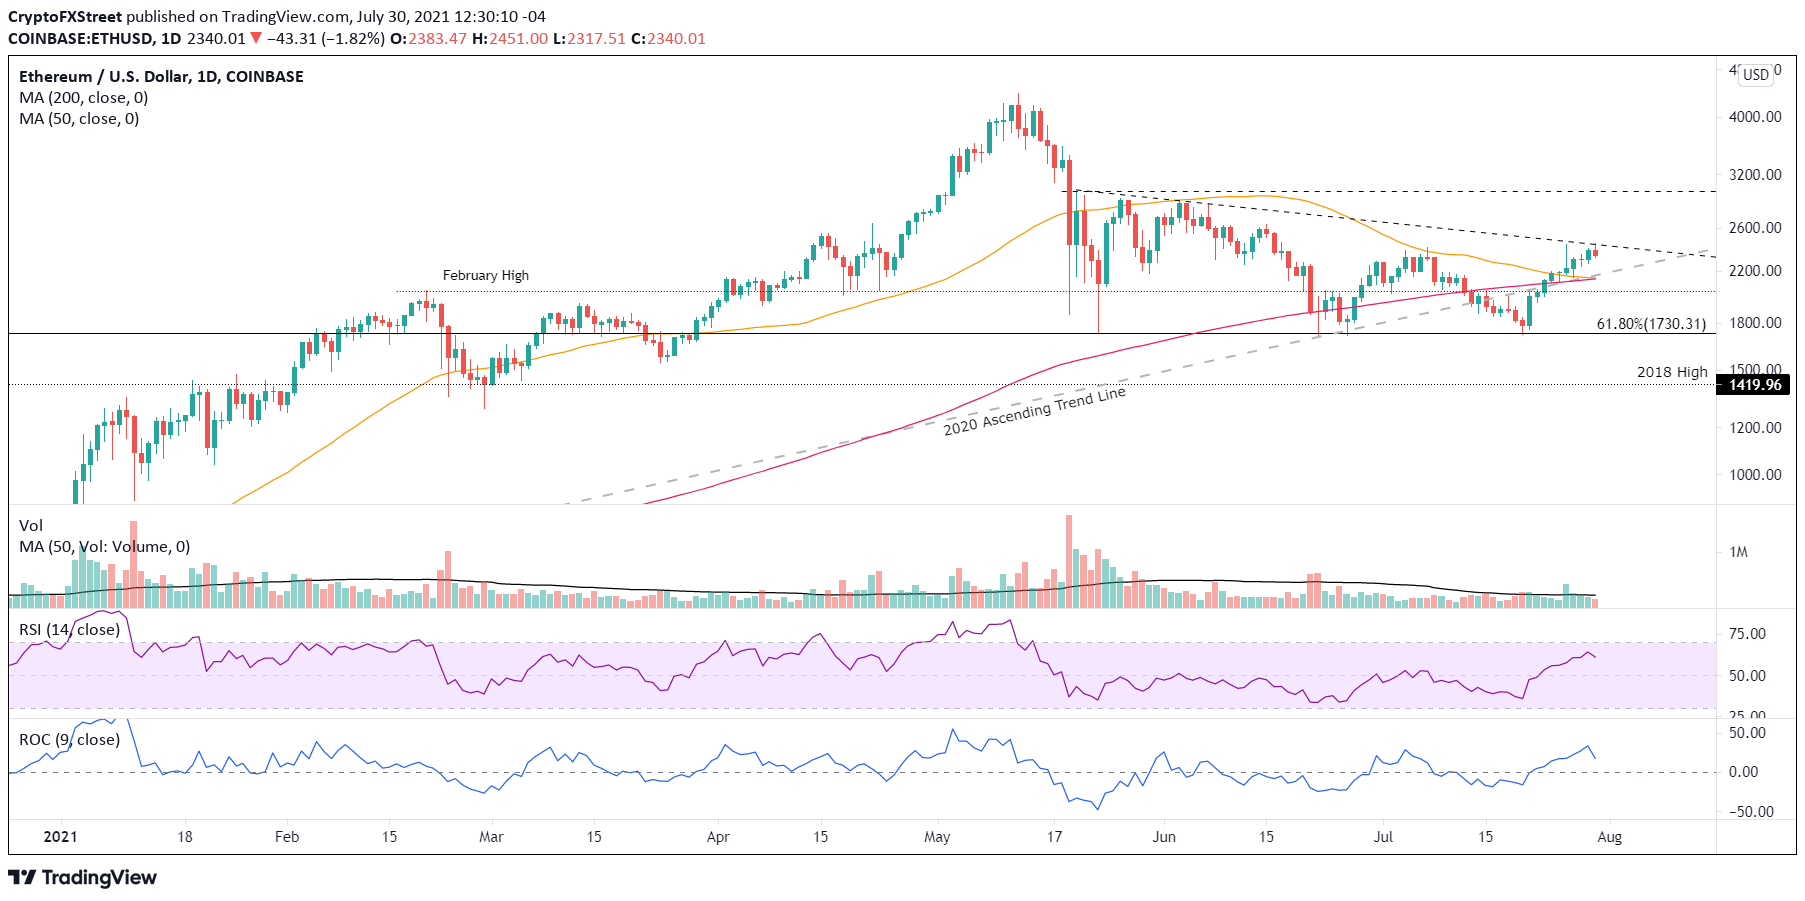
ETH/USD daily chart
A continuation of the rally above the upper trend line of the descending triangle should not face any resistance until a cluster of highs just above $2,900.
Here, FXStreet’s analysts evaluate where ETH could be heading next as it looks primed for higher highs.
XRP price close to shining again
XRP price traveled 42% over the previous nine trading days, placing Ripple at the convergence of the 200-day SMA with the neckline of a multi-year inverse head-and-shoulders pattern at $0.772. In the process, the international settlements token triggered a double bottom pattern established by the June and July lows. The fracturing of several resistance levels leaves XRP price shining again and at the threshold of a big opportunity.
The measured move of the double bottom is nearly 30%, taking XRP price to $0.953 based on the double bottom trigger of $0.733. The target falls short of the imposing $1.00 and the 38.2% retracement level of the April-June correction at $1.06.
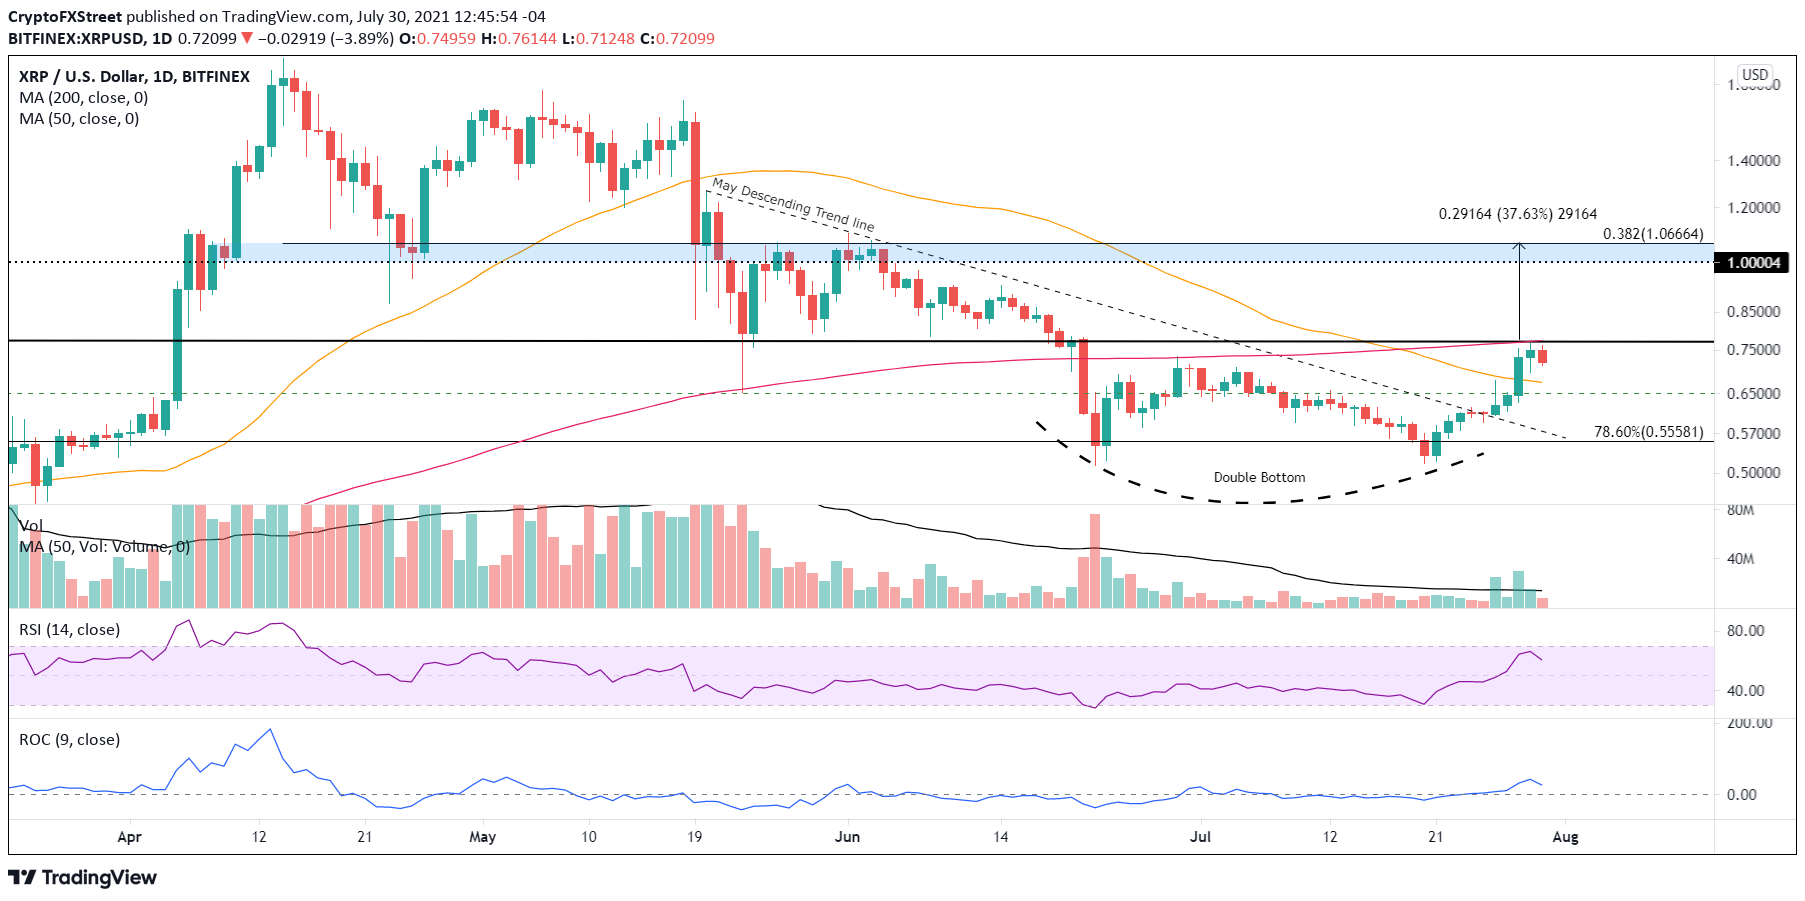
XRP/USD daily chart
To facilitate the continuation of the rally, XRP price should hold the 50-day SMA at $0.673 during consolidation and, at worst, the May 23 low of $0.652. Any weakness below the May 23 low would lead to a quick drop to $0.555 or lower.
After the explosive rally off the July lows, the major cryptocurrencies are well-positioned to continue their advances if the upcoming consolidations are not aggressive. Nevertheless, the easy money has been made, and each cryptocurrency is now confronted with a trend-determining resistance area that will test investors’ resolve moving forward.
Here, FXStreet’s analysts evaluate where Ripple could be heading next as it advances further.