Articles

China October PMIs: Manufacturing 49.2 (prior 49.6) & Services 52.4 (prior 53.2)
180086 October 31, 2021 09:49 Forexlive Latest News Market News
Purchasing Managers’ Index (PMI) data from China’s National Bureaus of Statistics and the China Federation of Logistics and Purchasing (CFLP)
Manufacturing PMI 49.2
- expected 49.7, prior 49.6
- the second month of contraction in a row, energy shortages and high input prices taking a toll
Non-manufacturing PMI 52.4
- expected 52.9, prior 53.2
- this is a reasonable result given ongoing COVID-19 disruptions (much smaller in scale than those mid-2021 and of course in 2020)
Composite 50.8
- prior 51.7
Still to come from China on October PMIS are those from Caixin, these are the privately survey PMIs. Coming up from November 1:
- Monday 0145 GMT brings the Manufacturing PMI, expected 50, prior 50
- Wednesday 0145 GMT brings the Non-manufacturing PMI, prior 53.4


China NBS Manufacturing PMI came in at 49.2 below forecasts (49.7) in October
180085 October 31, 2021 09:21 FXStreet Market News
Information on these pages contains forward-looking statements that involve risks and uncertainties. Markets and instruments profiled on this page are for informational purposes only and should not in any way come across as a recommendation to buy or sell in these assets. You should do your own thorough research before making any investment decisions. FXStreet does not in any way guarantee that this information is free from mistakes, errors, or material misstatements. It also does not guarantee that this information is of a timely nature. Investing in Open Markets involves a great deal of risk, including the loss of all or a portion of your investment, as well as emotional distress. All risks, losses and costs associated with investing, including total loss of principal, are your responsibility. The views and opinions expressed in this article are those of the authors and do not necessarily reflect the official policy or position of FXStreet nor its advertisers. The author will not be held responsible for information that is found at the end of links posted on this page.
If not otherwise explicitly mentioned in the body of the article, at the time of writing, the author has no position in any stock mentioned in this article and no business relationship with any company mentioned. The author has not received compensation for writing this article, other than from FXStreet.
FXStreet and the author do not provide personalized recommendations. The author makes no representations as to the accuracy, completeness, or suitability of this information. FXStreet and the author will not be liable for any errors, omissions or any losses, injuries or damages arising from this information and its display or use. Errors and omissions excepted.
The author and FXStreet are not registered investment advisors and nothing in this article is intended to be investment advice.
China Non-Manufacturing PMI below forecasts (52.9) in October: Actual (52.4)
180084 October 31, 2021 09:21 FXStreet Market News
Information on these pages contains forward-looking statements that involve risks and uncertainties. Markets and instruments profiled on this page are for informational purposes only and should not in any way come across as a recommendation to buy or sell in these assets. You should do your own thorough research before making any investment decisions. FXStreet does not in any way guarantee that this information is free from mistakes, errors, or material misstatements. It also does not guarantee that this information is of a timely nature. Investing in Open Markets involves a great deal of risk, including the loss of all or a portion of your investment, as well as emotional distress. All risks, losses and costs associated with investing, including total loss of principal, are your responsibility. The views and opinions expressed in this article are those of the authors and do not necessarily reflect the official policy or position of FXStreet nor its advertisers. The author will not be held responsible for information that is found at the end of links posted on this page.
If not otherwise explicitly mentioned in the body of the article, at the time of writing, the author has no position in any stock mentioned in this article and no business relationship with any company mentioned. The author has not received compensation for writing this article, other than from FXStreet.
FXStreet and the author do not provide personalized recommendations. The author makes no representations as to the accuracy, completeness, or suitability of this information. FXStreet and the author will not be liable for any errors, omissions or any losses, injuries or damages arising from this information and its display or use. Errors and omissions excepted.
The author and FXStreet are not registered investment advisors and nothing in this article is intended to be investment advice.

November seasonals: Six trends to watch in a month with some strong signals
180082 October 30, 2021 21:45 Forexlive Latest News Market News
November forex seasonals

November is an interesting month for seasonals because there are a few strong trends and some that often interrupted.
Cable is an interesting example. One the face of it, the 0.42% average decline over the past 20 years is unremarkable but when you strip out the past two US Presidential elections (2020 and 2016) there’s a remarkable pattern of GBP weakness. It’s the same with the dollar index overall as it struggled in both 2016 and 2020 but otherwise has risen in every year since 2010.
That speaks to the art of seasonal trading in a month that’s notable for a few reasons.
1) The golden trend
I’ve written about this forever and it’s come through countless times. There’s a very strong seasonal trend of strength for gold in Dec/Jan. Recently, it’s been preceded by weakness in November that’s turned into a buying opportunity. Given the inflationary concerns in markets and sudden volatility in bonds, I don’t see why this year should be any different. Look to buy a dip in mid-to-late November.
2) Stock market strength
One of the most well-known seasonals is that stocks everywhere tend to do well in November. Here are the 20-year averages in various indexes:
- MSCI world +1.71%
- S&P 500 +1.25%
- Nasdaq +2.81%
- Nikkei 225 +2.04%
Of those, I like Japanese stocks the best on a catch up trade. They’re also riding a nine-year winning streak in November and the strength in Tokyo consistently runs through December. Though if you’re long, you might want to hedge the FX exposure.
One exception (sorry UK traders) is the FTSE 100, which averages a 0.19% decline. Though I would also note that last November, the 12.33% gain was the best of any single month over the past 20 years.
3) Yen weakness
November is the worst month for the yen by far, more-than doubling the next worst month (Feb) over the past 20 years. Arguably, the trend started early this year with the yen taking a beating. By the same token, the trend in every yen cross is now decidedly higher and we’ve seen some late-month consolidation. The technicals, seasonals and fundamentals are nicely aligned in this trade (which of course means it will blow up in the other direction).
4) Last gasp for US natural gas
There’s some minor seasonal strength in natural gas but I would be wary because it’s also a volatile month. The Dec-Feb period is decidedly negative for gas so any further rise will be time to get out of the way. There was a huge gain in September but October was actually lower so some of the air is out already. Last week alone European benchmark gas prices fell 30%. My preferred strategy is to wait for the first blast of cold weather in New York and sell that pop. A long, cold winter could lead to a super-spike in prices this year but whether that happens is anyone’s guess.
5) Oil weakness
G20 leaders and the US are badgering OPEC+ to do more to bring down prices. November is also the worst month for WTI crude. The OPEC meeting is on Thursday and adding more than 400Kbpd could certainly upend the sizzling run in crude and spark a retracement. Even without that, oil might be due for a pullback. But oil bulls don’t despair, the Jan-April period is extremely strong.
6) CAD struggles
The oil trade was probably a clue. Not surprisingly, November is the worst month for the Canadian dollar. Friday’s GDP report was surprisingly weak and the market is already pricing in four hikes in 2022. I’m a loonie bull but it hasn’t been able to make headway on a hawkish BOC and 10-week rally in oil so maybe it’s time to head to the sidelines.

G20 leaders to endorse global minimum tax deal, want it in place in 2023
180080 October 30, 2021 21:02 Forexlive Latest News Market News
Reuters, citing a draft

The global minimum tax has been in the works for awhile so it’s not a surprise. I could see it impacting capital flows over time but it’s tough to see it in any tradable way, especially with so much of the implementation (and loopholes) still unknown.
Other headlines from the draft:
- Leaders will ensure ‘stable and uninterrupted supply of energy’
- Will end international public finance for newly built unabated coal power generation abroad by the end of 2021
- Will do their ‘utmost’ to stop building new unabated coal power generation ‘in the 2030s’
- Commit to phasing out inefficient fossil fuels ‘over the medium term’
- Acknowledge ‘key relevance of achieving global net zero greenhouse gas emissions by mid-century’
The irony of Biden and others pushing for more oil and gas pumping at the same time shouldn’t be lost on anyone.
Full Article
Brexit News: French Pres. Macron questions UK credibility amid fishing row
180079 October 30, 2021 18:29 FXStreet Market News
Amidst the last-ditch talks held between the UK and France to resolve the dispute over the fishing licenses and checks, French President Emmanuel Macron, who will meet the UK Prime Minister Johnson at the G20 meeting in Rome on Sunday, said the row was “a test” of the UK’s “credibility”, in a Financial Times (FT) interview.
On the other hand, PM Johnson urged the British fishermen to “be confident about going about their lawful business” as he promised action against any infringements on their right to fish.
Meanwhile, the head of the French ports of Calais and Boulogne, Jean-Marc Puissesseau warned, “It will be a drama, it will be a disaster. It will be chaos in your country because the trucks will not cross, it will be chaos at the ports. It has reached a ridiculous point, I would say.”
FX implications
Amid renewed Brexit concerns and pre-BOE caution trading, a potential recovery in GBP/USD from Friday’s massive sell-off is likely to remain shallow.
The cable tumbled 0.80% on the day to hit two-week lows of 1.3668 last Friday, settling the week at 1.3678. The steep drop could be attributed to the month-end flows into the US dollar, lifting the buck from four-week troughs.
Read: GBP/USD Weekly Forecast: Duo of central banks and Nonfarm Payrolls promise wild action
Full Article
Fed: Set to hike rates in July 2022 amid looming inflation risks – Goldman Sachs
180078 October 30, 2021 18:29 FXStreet Market News
The US Federal Reserve (Fed) is expected to raise its benchmark interest rates in July 2022 to counter the risks of rising inflationary pressures, Bloomberg reports, citing comments from Goldman Sachs economists led by Jan Hatzius.
Key quotes
“The Fed will raise its benchmark from a range of zero to 0.25% soon after it stops tapering its massive asset-purchase program.”
“A second increase will follow in November 2022 and the central bank will then raise rates two times a year after that.”
“The main reason for their new forecast was they now expect inflation to prove more stubborn than they previously thought.”
“Expect consumer price inflation outside of food and energy costs to still be above 4% when the taper ends.”
“We think this will make a seamless move from tapering to rate hikes the path of least resistance.”
“With inflation far above target and job availability high, officials will likely conclude most of any remaining labor force weakness is structural or voluntary.”
Related reads
Full Article
Dogecoin price remains poised to test $0.45 as dip-buying to lift DOGE
180076 October 30, 2021 18:02 FXStreet Market News
- Dogecoin price clings to 200-DMA as DOGE bulls gather strength.
- Falling channel breakout on the 1D chart calls for a test of $0.45.
- RSI turns south but holds well above 50.00, supporting DOGE buyers.
With the rotation of investors’ capital from Bitcoin, Ethereum and Ripple into the canine-themed coins over the past week, Dogecoin wasn’t left behind, as it is looking to end the week with 16% gains.
Despite this week’s solid performance, DOGE bulls seem to have taken a breather over the last 36 hours, as the price enters an upside consolidative mode after Thursday’s massive surge to four-month tops of $0.3556.
In doing so, DOGE price surpassed the mid-August highs of $0.3552, from where the preceding downtrend had kicked in.
The tenth most widely is trading marginally lower on the day, unable to find footing above the $0.29 mark for the second straight day this Saturday.
Dogecoin price eyes additional upside despite the recent pullback
As observed in Dogecoin’s daily chart, DOGE price is trying hard to defend the critical 200-Daily Moving Average (DMA) at $0.2861, as it extends the corrective pullback from two-month highs on Saturday.
However, DOGE price continues to waver within Friday’s trading range, as the bulls bide time before a convincing extension of the renewed upswing.
On Thursday, the canine-inspired coin soared 27%, extending the upside breakout from a two-month-long falling channel confirmed last Sunday. The channel breakout materialized after DOGE price closed above the falling trendline resistance, then at $0.272.
DOGE bulls recaptured the upward-pointing 200-DMA on the massive upswing and have managed to close above the latter, thus far.
The latest move lower in Dogecoin can be attributed to the sharp downtick in the Relative Strength Index (RSI) indicator. The pullback appears shallow and could be seen as a good dip-buying opportunity for DOGE optimists, as the RSI continues to hold above the midline.
If the bulls fight back control, then DOGE price could swing back towards the multi-month highs above $0.3550.
The next upside barrier for DOGE bull is placed at pattern target measured at $0.4432.
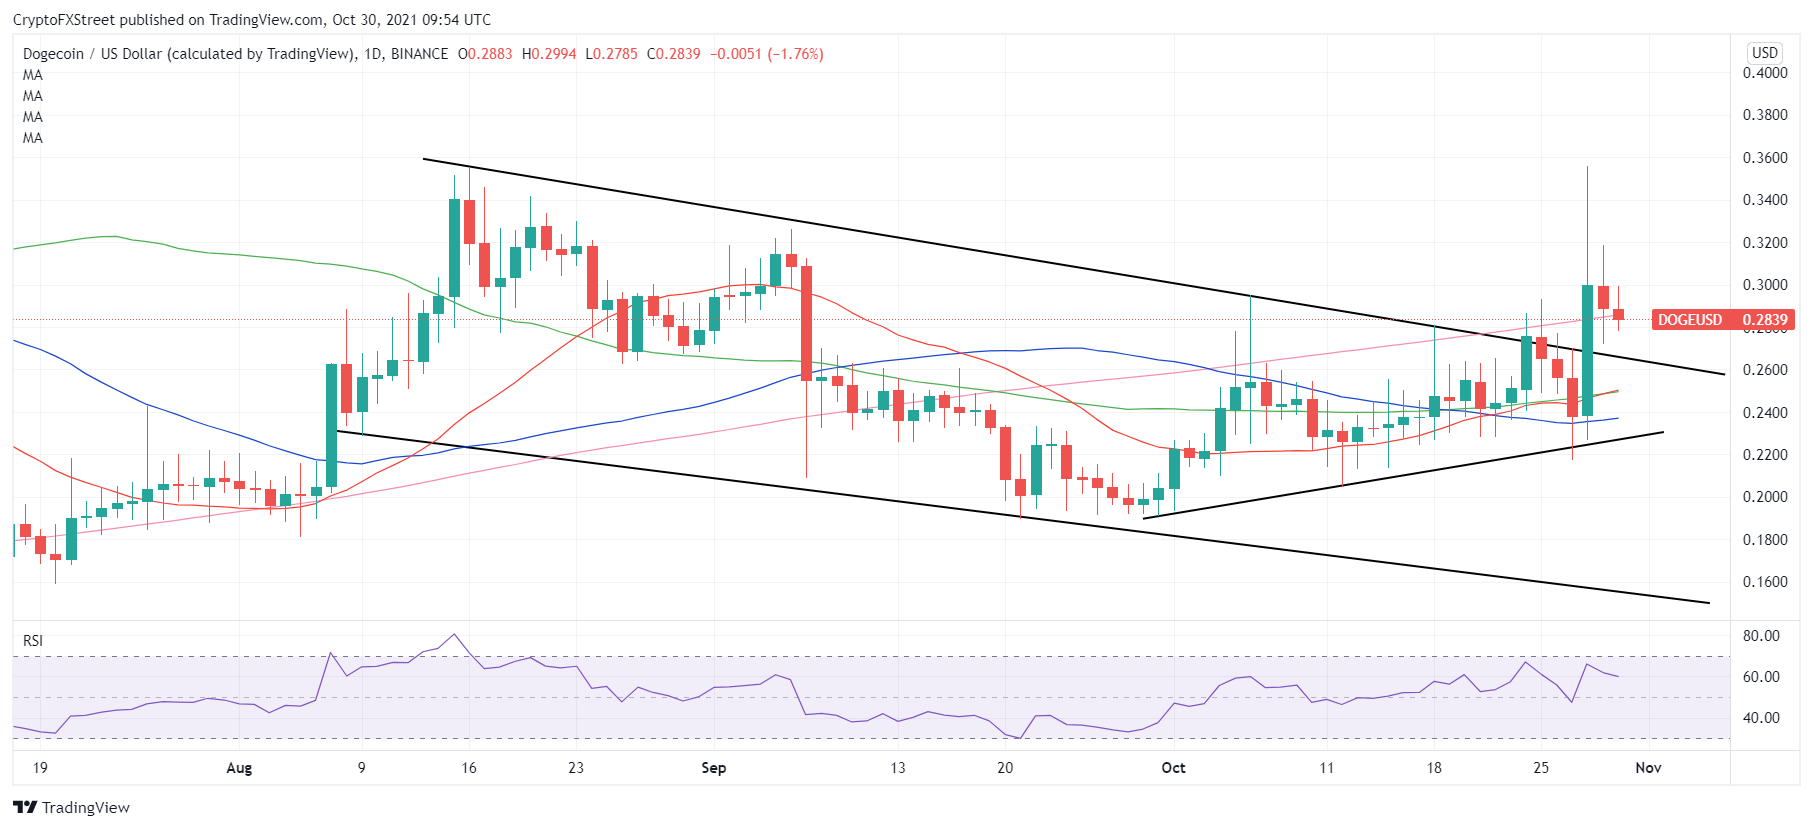
DOGE/USD: Daily chart
On the downside, DOGE price could meet initial demand at the channel resistance now support at $0.2649 should the correction picks up steam and knocks down the 200-DMA on a daily closing basis.
Further south, $0.2490 will limit additional losses in Dogecoin. At that level, the 21-DMA meets the 100-DMA.
Cardano price to retest 200-DMA at $1.80 as ADA bulls lose conviction
180074 October 30, 2021 16:51 FXStreet Market News
- Cardano’s path of least resistance appears to the downside.
- ADA price eyes $1.80 again, as $2 offers stiff resistance to the bulls.
- Symmetrical triangle breakdown remains in play amid bearish RSI.
In an attempt to flip rival Ethereum, Cardano Foundation partnered with governments globally, working on blockchain solutions to solve real-world problems. The new partnerships make ADA blockchain one of the greenest in the crypto ecosystem.
These positive developments, however, have failed to impress ADA bulls, as Cardano price remains in a downside consolidative mode for the third straight day on Saturday.
ADA price licks its wounds after hitting the lowest levels in two months at $1.82 on Wednesday. Sellers continue to guard the upside at the $2 threshold, capping the recovery attempts in the fifth most favorite crypto coin.
The altcoin is feeling the pull of gravity once again, shedding over 1% on the day, currently trading just shy of the $2 level.
Cardano price remains exposed to downside risks amid bearish technicals
Cardano’s daily chart paints a bearish picture for ADA bulls, especially after the price confirmed a symmetrical triangle breakdown below the key $2 support on Wednesday.
The two-day rebound, thereafter, lost legs amid a persistently bearish 14-day Relative Strength Index (RSI). The leading indicator is seeing a fresh downtick while keeping its range below the midline, pointing to the looming downside risks.
ADA sellers look to retest the upwards-loping 200-Daily Moving Average (DMA) support at $1.80 to initiate a sustained downtrend.
The next line of defense for ADA bulls is aligned at the $1.50 psychological level, below which the pattern target measured at $1.39 could get challenged.
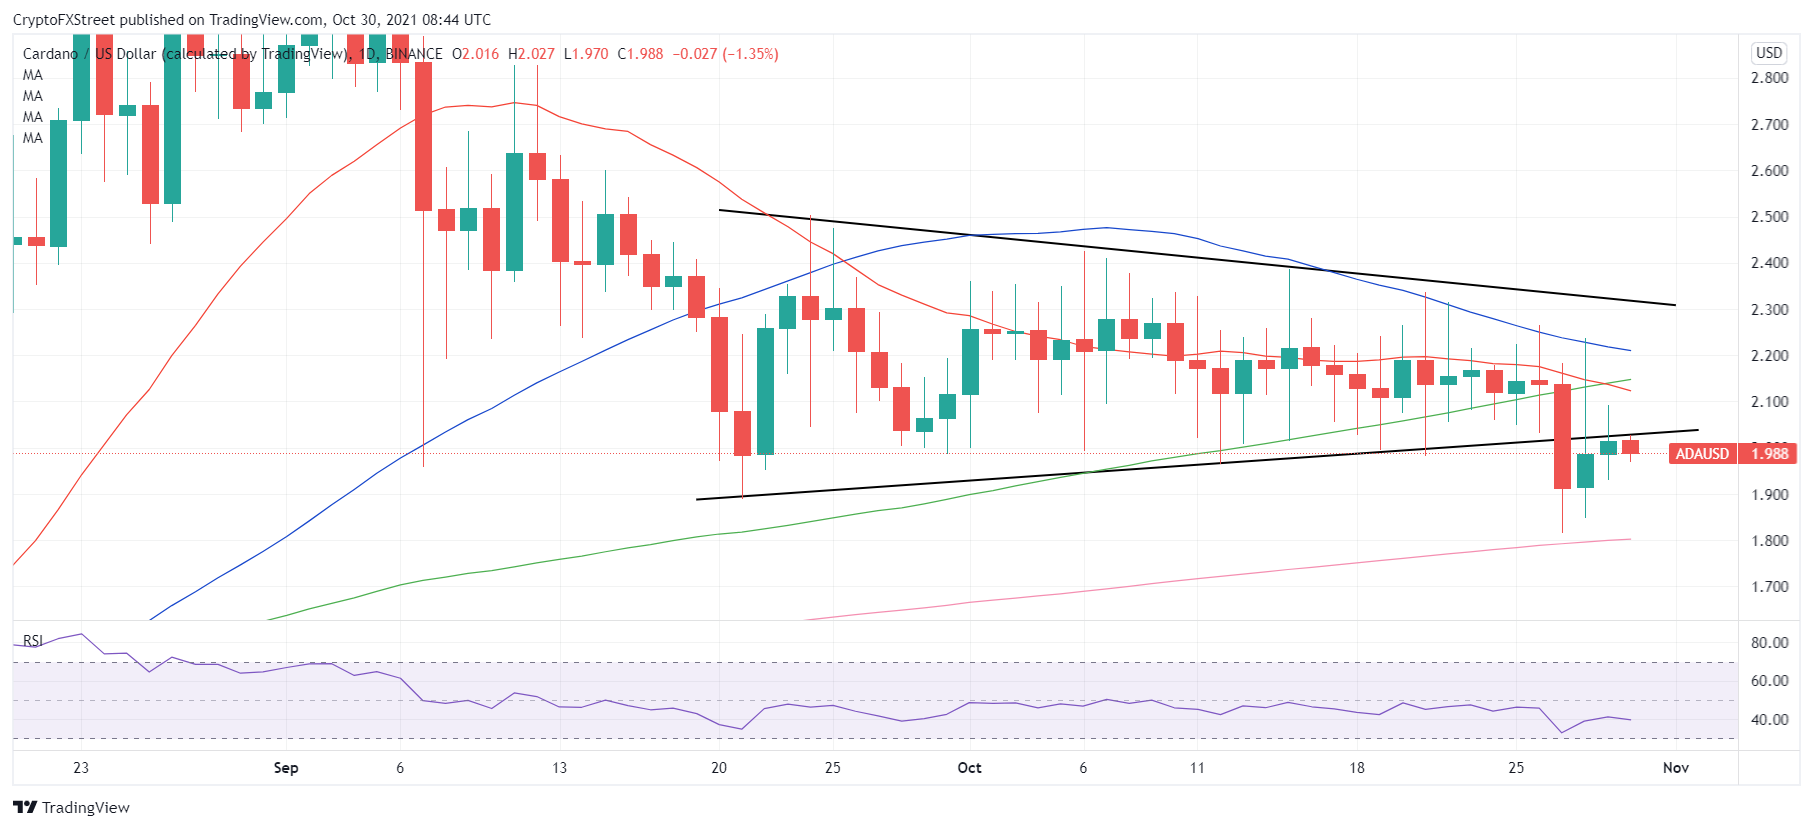
ADA/USD: Daily chart
Alternatively, ADA buyers need to find a strong foothold above the triangle support now resistance at $2.03 for the recovery to gain any meaningful traction.
The next stop for ADA bulls will be then seen at $2.13, where the 21 and 100-DMAs converge.
Powerful resistance at the downward-sloping 50-DMA at $2.21 will challenge the bearish commitments. Note that ADA price last closed above the 50-DMA barrier on September 18.
XRP price eyes a 25% rally if Ripple bulls storm through this key hurdle
180072 October 30, 2021 14:45 FXStreet Market News
- Ripple bulls extend a three-day uptrend above the $1 mark.
- XRP price preps up for a falling wedge breakout on the daily sticks.
- RSI stays firmer above 50.00 amid encouraging fundamental factors.
The XRP price is trading on the right foot stepping into the weekend, extending its three-day recovery momentum from four-week lows of $0.9543
Ripple bulls stand resilient despite the downbeat mood seen across the crypto market, as the no.3 coin’s fundamental news remain supportive of the ongoing uptrend.
Among the encouraging factors, the Japanese online financial group, SBI Holdings Inc., revealed that it uses XRP, as a bridge currency, for international remittances to the Philippines in collaboration with SBI VC Trade and SBI Ripple Asia.
Further, “analysts predict a 324% rally for XRP price based on Ripple’s latest partnerships and proceedings in SEC vs. Ripple case,” FXStreet’s Crypto Editor, Ekta Mourya, notes.
How is XRP price positioned on the daily chart?
On its road to recovery from monthly troughs, XRP price has recaptured all the major Daily Moving Averages (DMA), now looking to challenge the last key resistance level to extend the bullish reversal.
The abovementioned barrier is the falling trendline resistance at $1.1415, a daily closing above which will confirm an upside breakout from the month-long falling wedge formation.
The bullish technical breakout will open doors for a fresh rally towards the pattern target measured at $1.4075.
Ahead of that, XRP bulls will face stiff resistance at the October highs of $1.2291. Further up, the $1.30 round figure will come into play,
The 14-day Relative Strength Index (RSI) is edging higher within the positive territory, suggesting that there is scope for additional upside in XRP price. 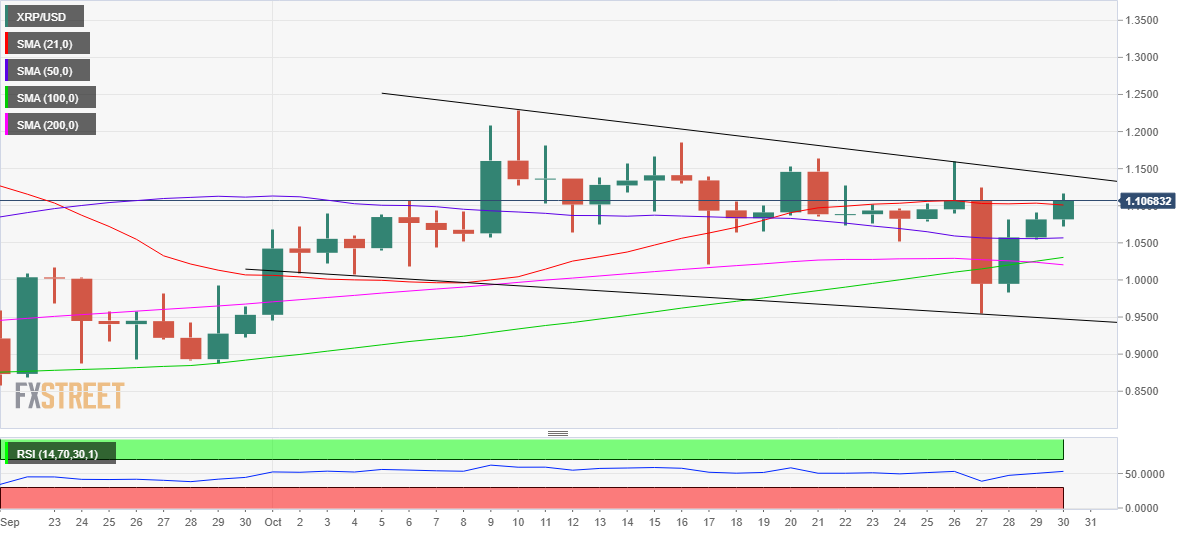
XRP/USD: Daily chart
On the flip side, a rejection at the falling trendline resistance could recall the sellers, dragging XRP price lower to test the resistance-turned-support of the 21-DMA at $1.10.
The next significant support is envisioned at the horizontal 50-DMA of $1.0567.
Sustained weakness in XRP price could prompt the bears to test the bids around $1.0250, where the 100 and 200-DMAs hover.
Sellers will seek fresh entries below the latter, triggering a fresh sell-off towards the multi-week lows, followed by the next cap seen at the falling trendline support of $0.9472.
Shiba Inu price looks north towards $0.0001 while above 61.8% Fibo level
180070 October 30, 2021 13:17 FXStreet Market News
- Shiba Inu bulls gear up for another record rally, as $0.0001 beckons.
- About 71% of SHIB’s circulation is controlled by eight whale accounts.
- SHIB bulls remain hopeful so long as the price holds above 61.8% Fibo level.
Shiba Inu is looking to revive the record rally, as the bulls snap the corrective pullback and gear up for a fresh leg higher.
SHIB price is posting modest gains on Saturday, building onto Friday’s upswing, as it enjoys 110% so far this week.
Over the past week, Shiba Inu’s market capitalization has surpassed that of its rival, Dogecoin, having secured the eight positions amongst the most widely traded digital assets.
Crypto research firm Into the Block reported that a whopping 70.52% of SHIB’s circulation is concentrated in the hands of eight whale accounts, of which one whale holds 41%.
At the press time, SHIB/USDT is trading just below the $0.0000750 level, up 0.60% on the day, wavering within a tight range.
Shiba Inu price needs to clear this key resistance to take on $0.0001
Bargain hunters are taking advantage of the retreat in SHIB price, as they believe that there is more room to rise for the meme-coin.
From a short-term technical perspective, SHIB price has bounced off key support at $0.0000578 after the sharp correction from all-time highs of $0.0000885 reached on Thursday. That level is the 50% Fibonacci Retracement (Fibo) level of the recent upsurge from the October 21 lows of $0.00000270 to the record high.
Over the past two trading sessions, SHIB bulls have managed to defend the 61.8% Fibo level of the same ascent at $0.0000650 on a daily closing basis, underpinning the buyers’ sentiment.
The 14-day Relative Strength Index (RSI) is looking north once again, having eased from extremely overbought conditions, adding credence to a potential advance in SHIB price.
Currently, SHIB price is battling the 78.6% Fibo level at $0.0000752, awaiting acceptance above it to retest the lifetime highs.
A sustained move above the record highs could initiate a fresh upswing towards the $0.00010 level, above which the 127.2% Fibo level at $0.000105 will come into play.
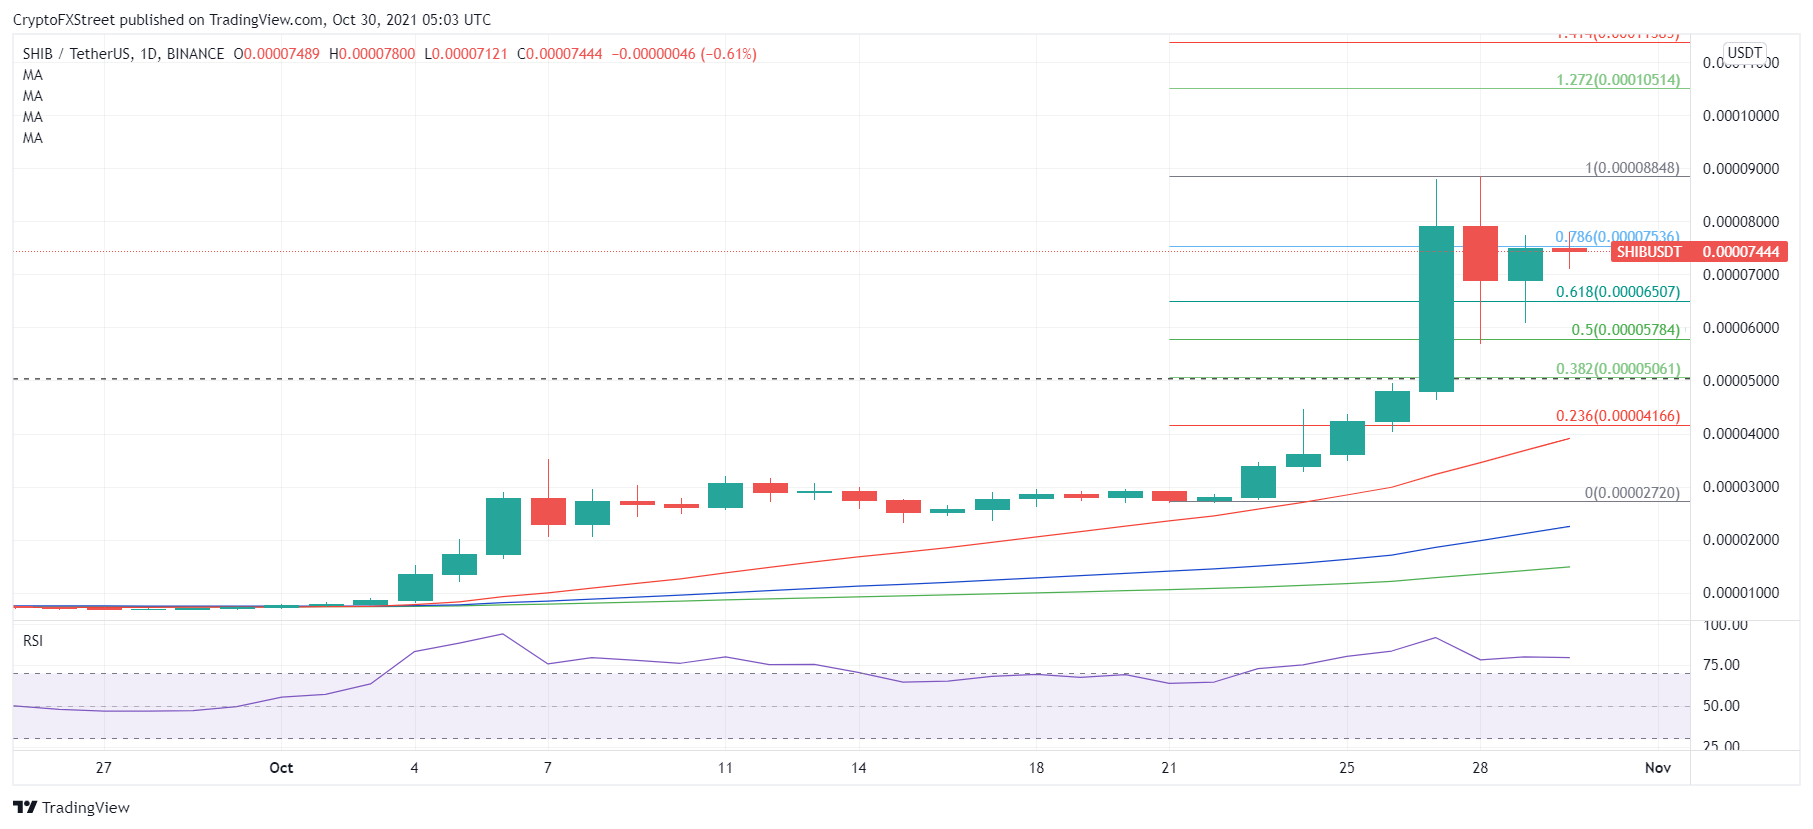
SHIB/USDT: Daily chart
Alternatively, the abovementioned 61.8% Fibo support could continue limiting the corrective declines in SHIB price.
The 50% Fibo level at $0.0000578 will be the level to beat for SHIB bears should the downside pressure mount. However, $0.000050-$0.0000460 will emerge as powerful support, which is the confluence of Wednesday’s low and 38.2% Fibo level.
XLM buyers frustrated as Stellar fizzles out
180068 October 30, 2021 08:45 FXStreet Market News
- XLM price faces another rejection against the $0.41 value area.
- Despite multiple bullish attempts to break out above $0.41, sellers slap XLM lower.
- Hidden bullish development on the Point and Figure chart may destroy short sellers.
XLM price has been a frustrating instrument for any long-term investor or short-term speculator. It’s hard to believe and even harder to remember, but XLM has not made a new all-time high since 2018! Psychologically, bulls have been trolled throughout October – but the joke may soon be on the bears.
XLM price action may play a trick on the bears this Halloween, bringing treats for the bulls
XLM price may trick any bears that believe XLM is ready for another bearish breakdown lower. While the candlestick chart and Ichimoku system show continued rejection higher, the $0.01/3-box Reversal Point and Figure chart shows a sort of hidden bullish setup that isn’t seen on a candlestick chart.
The red diagonal line on the Point and Figure chart below is the previous bear market trendline. Quick note: In Point and Figure charts and analysis, an instrument is always in a bull market or bear market. That bear market trendline was broken when the most recent X-column broke above it at $0.41. However, bears then took over and pushed XLM lower to create a double bottom and then a sell entry one box below at $0.32 – but that’s where XLM price stopped.

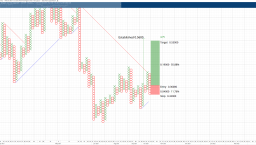
XLM/USD $0.01/3-box Reversal Point and Figure Chart
Because XLM price broke the bear trend angle, the market has converted into a bull market. The hypothetical long trade setup is a buy stop at the 3-box reversal ($0.36 at the time of publishing) with a 4-box stop loss and an optional 3-box trailing stop. The projected profit target from that entry is $0.55.
The current long setup can only be invalidated if a new low below $0.20 develops in the current O-column.