Articles
S&P 500 reclaims the 4000 mark, as US equities record its best month since 2020
246277 July 30, 2022 06:33 FXStreet Market News
- The three major US equity indices advanced between 0.97% and 1.88%.
- A risk-on impulse since last Wednesday underpinned US equities, lifted by US corporate earnings of Amazon and Apple.
- The US Dollar Index fell below 106.000, while the US 10-year T-note yield finished around 2.654%.
US equities finished the week on a higher note, as Amazon and Apple soared as earnings from both companies exceeded analysts’ estimates after the US Federal Reserve hiked rates 75 bps in the week, spurring a rally that carried on until the end of the week/month.
The S&P 500 closed the week gaining 1.42%, at 4,130.28, while the tech-heavy Nasdaq rose 1.88%, up to 12,390.69. Additionally, the Dow Jones Industrial followed suit and climbed 0.97%, finishing at 32,845.13.
Sector-wise, the leading sectors are Energy, up by 4.51 %, followed by Consumer Discretionary and Industrials, each recording gains of 4.27% and 2%, respectively. The biggest losers were Consumer Staples and Health, diving 0.72% and 0.35% each.
Shares fell due to Walmart cutting its earnings forecast, complaining about double-digit food prices and elevated energy prices. Additionally, the US Federal Reserve monetary policy decision is looming, and Europe’s escalating energy crisis re-ignited recession fears amongst traders, which turned to safe-haven assets, namely the greenback.
Global equities remain to trade positively, reflecting an upbeat sentiment. Data-wise, the US Department of Commerce revealed that June’s Personal Consumption Expenditure rose 1% MoM, higher than 0.9% estimations. Annually based, edged higher by 6.8%, vs. 6.7% foreseen by analysts.
Late, the University of Michigan reported that Consumer Sentiment on its final reading for July beat expectations and rose 51.5. In the same survey, inflation expectations for a 5-year horizon, from 2.8% (preliminary) to 2.9%, though less than June’s readings.
In the meantime, Fed speakers began to cross wires. The first one was Atlanta’s Fed President Raphael Bostic, who said that the Fed is “going to have to do more in terms of interest-rate moves” and added that he does not think the country is in a recession. In the meantime, Christopher Waller said that “a soft landing is a plausible outcome for the labor market going forward.”
Elsewhere, the US Dollar Index (DXY), a measurement of the greenback’s value against some currencies, fell 0.67% to 105.828, while the 10-year US Treasury yield dropped two bps, yielding 2.654%.
In the commodities complex, WTI gained 1.95%, exchanging hands at $98.30 BPD. Meanwhile, precious metals like gold (XAU/USD) increased by 0.78%, trading at $1764.00 a troy ounce.
SP 500 Chart
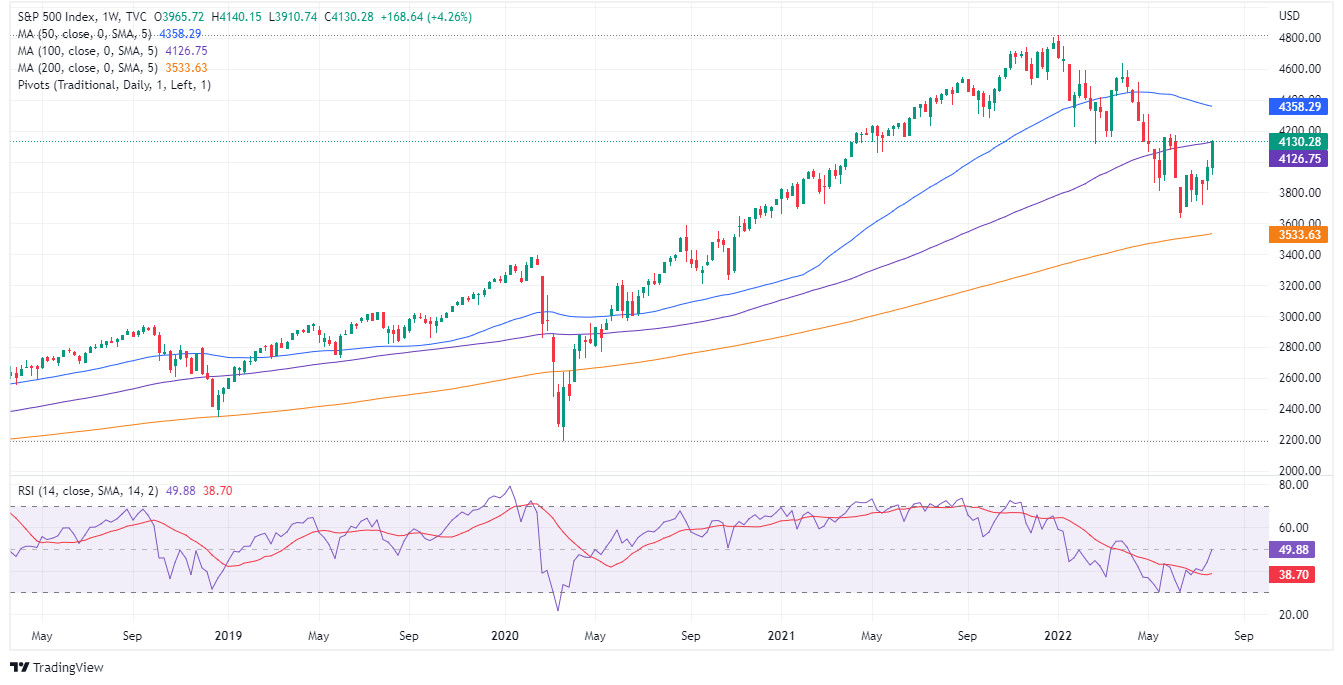
Key Technical Levels
Full Article
GBP/USD Price Analysis: Stills bearish on buyers failure at 1.2220
246275 July 30, 2022 05:33 FXStreet Market News
- GBP/USD extends its gains to two straight weeks, gains some 1.49%.
- From a daily chart perspective, the GBP/USD is still downward biased, facing solid resistance around 1.2200.
- GBP/USD Price Analysis: Unless buyers reclaim 1.2245, the pair remains tilted downwards.
The British pound finished the week on the right foot and recorded its second consecutive week in the green; it printed solid gains of 1.49%, amidst an upbeat market mood, portrayed by US equities closing higher on Friday. In the FX space, the GBP/USD is trading at 1.2170, 0.05% down, during the North American session.
GBP/USD Price Analysis: Technical outlook
The GBP/USD is still neutral-to-downward biased, trapped within the 50 and 20-day EMAs, as depicted by the daily chart. Worth noting that earlier in the European session, GBP/USD buyers broke above the 50-day EMA but could not hold the fort, and the pound tumbled towards and hit its daily low at 1.2062 before rebounding towards current price levels.
If GBP/USD buyers want to regain control, they must reclaim 1.2300; otherwise, sellers remain in charge.
GBP/USD 1-hour chart
In the near term, the GBP/USD is neutral-upwards biased. Since July 14, after reaching a daily low at 1.1759, the major began trending higher, within a 200-pip width ascending channel, which put a lid on Friday’s rally around 1.2245, right at the top of the channel. Even though the GBP/USD plunged towards 1.2065, the S1 pivot point cable recovered some ground and is trading above the confluence of all the hourly EMAs and the daily pivot.
Therefore, the GBP/USD first resistance would be the R1 daily pivot at 1.2210. Break above will expose the top-trendline of the ascending channel around 1.2245, followed by the 1.2300 figure. On the flip side, if the GBP/USD falls below the ascending channel mid-line around 1.2150, it will send the pair sliding towards the bottom-trendline of the channel at around 1.2050-60.

GBP/USD Key Technical Levels
Full Article
Forexlive Americas FX news wrap: The month ends with dollar moving lower
246274 July 30, 2022 05:21 Forexlive Latest News Market News
The USD is closing the day lower despite some higher than expected inflation measures at the start of the day. The Core PCE came in at 4.8% trend higher than the 4.7% expected. The employment cost index rose by 1.3% for the quarter which was also higher than the 1.2% expectations. University of Michigan consumer sentiment did rise from the preliminary tumble but was still scraping along historic low levels.
For the US dollar, although the greenback is ending the day as the weakest of the major currencies, initially move higher in the New York session before reversing lower as London/European traders look to exit for the day. Blame it on the month end trading. Overall for the. Month, the dollar was higher vs. the EUR but lower vs. all the other major currencies (the greenback was unchanged vs. the GBP).
So while the dollar was mostly lower this month, the US stock market was mostly higher with the major indices having their best month in 2022 and the S&P and NASDAQ having their best month since 2020.
For the day, the Dow industrial average rose 0.97%, the S&P increased by 1.42% and the NASDAQ index rose by 1.88% for the trading month, those indices had oversized gains of 6.73% for the Dow, 9.12% for the S&P, and 12.35% for the NASDAQ. Admittedly all 3 indices are still lower on the year by quite a bit (Dow down -9.3%, S&P -13.55%, NASDAQ down -20.91%), but the gains are easier on the way higher (off a low base).
In the US debt market, the yields today are ending with mixed results.
- 2 year yield 2.888%, +2.2 basis points
- 5 year yield 2.681%, -2.0 basis points
- 10 year yield 2.656%, -2.4 basis points
- 30 year yield 3.013%, -1.3 basis points
However, for the month yields are lower despite the Fed hiking by 75 basis points.
- 2 year yield closed the end of June at 2.957%. The current yield is 2.888%, down -6.9 basis points
- 5 year yield closed June at 3.040% and is trading at 2.681%, down -36 basis points
- 10 year yield closed June at 3.017% and is trading at 2.654%, down -37 basis points
- 30 year yield closed June at 3.183% and is trading at 3.01% for a decline of -17 basis point
In other markets:
- Gold is ending the day at $1765.34. That’s up $9.14 or 0.52%. Gold fell near -$42 this month but that is up from a low that took the price down $-126 at the July 21 low for the month
- Silver rose $0.32 or 1.6% to $20.32. That’s near unchanged on the month after declining to a low of $18.14 mid month
- Crude oil is ending up $1.88 or 1.95% at $98.30. For the month, the price is down $7.70 or -7.27%.
- Bitcoin is ending it’s Friday near $24,000 at $23,935. Although bitcoin still has 2 days of trading over the weekend, it is currently up around $4000 or 20.10% from its end of June closing level of $19,924
Thank you for your support and have a great weekend.
Full Article
United Kingdom CFTC GBP NC Net Positions: £-54K vs £-57.3K
246273 July 30, 2022 05:02 FXStreet Market News
Information on these pages contains forward-looking statements that involve risks and uncertainties. Markets and instruments profiled on this page are for informational purposes only and should not in any way come across as a recommendation to buy or sell in these assets. You should do your own thorough research before making any investment decisions. FXStreet does not in any way guarantee that this information is free from mistakes, errors, or material misstatements. It also does not guarantee that this information is of a timely nature. Investing in Open Markets involves a great deal of risk, including the loss of all or a portion of your investment, as well as emotional distress. All risks, losses and costs associated with investing, including total loss of principal, are your responsibility. The views and opinions expressed in this article are those of the authors and do not necessarily reflect the official policy or position of FXStreet nor its advertisers. The author will not be held responsible for information that is found at the end of links posted on this page.
If not otherwise explicitly mentioned in the body of the article, at the time of writing, the author has no position in any stock mentioned in this article and no business relationship with any company mentioned. The author has not received compensation for writing this article, other than from FXStreet.
FXStreet and the author do not provide personalized recommendations. The author makes no representations as to the accuracy, completeness, or suitability of this information. FXStreet and the author will not be liable for any errors, omissions or any losses, injuries or damages arising from this information and its display or use. Errors and omissions excepted.
The author and FXStreet are not registered investment advisors and nothing in this article is intended to be investment advice.
European Monetary Union CFTC EUR NC Net Positions up to €-41.6K from previous €-42.7K
246272 July 30, 2022 04:56 FXStreet Market News
Information on these pages contains forward-looking statements that involve risks and uncertainties. Markets and instruments profiled on this page are for informational purposes only and should not in any way come across as a recommendation to buy or sell in these assets. You should do your own thorough research before making any investment decisions. FXStreet does not in any way guarantee that this information is free from mistakes, errors, or material misstatements. It also does not guarantee that this information is of a timely nature. Investing in Open Markets involves a great deal of risk, including the loss of all or a portion of your investment, as well as emotional distress. All risks, losses and costs associated with investing, including total loss of principal, are your responsibility. The views and opinions expressed in this article are those of the authors and do not necessarily reflect the official policy or position of FXStreet nor its advertisers. The author will not be held responsible for information that is found at the end of links posted on this page.
If not otherwise explicitly mentioned in the body of the article, at the time of writing, the author has no position in any stock mentioned in this article and no business relationship with any company mentioned. The author has not received compensation for writing this article, other than from FXStreet.
FXStreet and the author do not provide personalized recommendations. The author makes no representations as to the accuracy, completeness, or suitability of this information. FXStreet and the author will not be liable for any errors, omissions or any losses, injuries or damages arising from this information and its display or use. Errors and omissions excepted.
The author and FXStreet are not registered investment advisors and nothing in this article is intended to be investment advice.
United States CFTC Gold NC Net Positions down to $92.7K from previous $95K
246271 July 30, 2022 04:56 FXStreet Market News
Information on these pages contains forward-looking statements that involve risks and uncertainties. Markets and instruments profiled on this page are for informational purposes only and should not in any way come across as a recommendation to buy or sell in these assets. You should do your own thorough research before making any investment decisions. FXStreet does not in any way guarantee that this information is free from mistakes, errors, or material misstatements. It also does not guarantee that this information is of a timely nature. Investing in Open Markets involves a great deal of risk, including the loss of all or a portion of your investment, as well as emotional distress. All risks, losses and costs associated with investing, including total loss of principal, are your responsibility. The views and opinions expressed in this article are those of the authors and do not necessarily reflect the official policy or position of FXStreet nor its advertisers. The author will not be held responsible for information that is found at the end of links posted on this page.
If not otherwise explicitly mentioned in the body of the article, at the time of writing, the author has no position in any stock mentioned in this article and no business relationship with any company mentioned. The author has not received compensation for writing this article, other than from FXStreet.
FXStreet and the author do not provide personalized recommendations. The author makes no representations as to the accuracy, completeness, or suitability of this information. FXStreet and the author will not be liable for any errors, omissions or any losses, injuries or damages arising from this information and its display or use. Errors and omissions excepted.
The author and FXStreet are not registered investment advisors and nothing in this article is intended to be investment advice.
Japan CFTC JPY NC Net Positions fell from previous ¥-59.2K to ¥-61.5K
246270 July 30, 2022 04:51 FXStreet Market News
Information on these pages contains forward-looking statements that involve risks and uncertainties. Markets and instruments profiled on this page are for informational purposes only and should not in any way come across as a recommendation to buy or sell in these assets. You should do your own thorough research before making any investment decisions. FXStreet does not in any way guarantee that this information is free from mistakes, errors, or material misstatements. It also does not guarantee that this information is of a timely nature. Investing in Open Markets involves a great deal of risk, including the loss of all or a portion of your investment, as well as emotional distress. All risks, losses and costs associated with investing, including total loss of principal, are your responsibility. The views and opinions expressed in this article are those of the authors and do not necessarily reflect the official policy or position of FXStreet nor its advertisers. The author will not be held responsible for information that is found at the end of links posted on this page.
If not otherwise explicitly mentioned in the body of the article, at the time of writing, the author has no position in any stock mentioned in this article and no business relationship with any company mentioned. The author has not received compensation for writing this article, other than from FXStreet.
FXStreet and the author do not provide personalized recommendations. The author makes no representations as to the accuracy, completeness, or suitability of this information. FXStreet and the author will not be liable for any errors, omissions or any losses, injuries or damages arising from this information and its display or use. Errors and omissions excepted.
The author and FXStreet are not registered investment advisors and nothing in this article is intended to be investment advice.
Australia CFTC AUD NC Net Positions dipped from previous $-43.1K to $-47.4K
246269 July 30, 2022 04:51 FXStreet Market News
Information on these pages contains forward-looking statements that involve risks and uncertainties. Markets and instruments profiled on this page are for informational purposes only and should not in any way come across as a recommendation to buy or sell in these assets. You should do your own thorough research before making any investment decisions. FXStreet does not in any way guarantee that this information is free from mistakes, errors, or material misstatements. It also does not guarantee that this information is of a timely nature. Investing in Open Markets involves a great deal of risk, including the loss of all or a portion of your investment, as well as emotional distress. All risks, losses and costs associated with investing, including total loss of principal, are your responsibility. The views and opinions expressed in this article are those of the authors and do not necessarily reflect the official policy or position of FXStreet nor its advertisers. The author will not be held responsible for information that is found at the end of links posted on this page.
If not otherwise explicitly mentioned in the body of the article, at the time of writing, the author has no position in any stock mentioned in this article and no business relationship with any company mentioned. The author has not received compensation for writing this article, other than from FXStreet.
FXStreet and the author do not provide personalized recommendations. The author makes no representations as to the accuracy, completeness, or suitability of this information. FXStreet and the author will not be liable for any errors, omissions or any losses, injuries or damages arising from this information and its display or use. Errors and omissions excepted.
The author and FXStreet are not registered investment advisors and nothing in this article is intended to be investment advice.
United States CFTC Oil NC Net Positions declined to 259.3K from previous 271.1K
246268 July 30, 2022 04:45 FXStreet Market News
Information on these pages contains forward-looking statements that involve risks and uncertainties. Markets and instruments profiled on this page are for informational purposes only and should not in any way come across as a recommendation to buy or sell in these assets. You should do your own thorough research before making any investment decisions. FXStreet does not in any way guarantee that this information is free from mistakes, errors, or material misstatements. It also does not guarantee that this information is of a timely nature. Investing in Open Markets involves a great deal of risk, including the loss of all or a portion of your investment, as well as emotional distress. All risks, losses and costs associated with investing, including total loss of principal, are your responsibility. The views and opinions expressed in this article are those of the authors and do not necessarily reflect the official policy or position of FXStreet nor its advertisers. The author will not be held responsible for information that is found at the end of links posted on this page.
If not otherwise explicitly mentioned in the body of the article, at the time of writing, the author has no position in any stock mentioned in this article and no business relationship with any company mentioned. The author has not received compensation for writing this article, other than from FXStreet.
FXStreet and the author do not provide personalized recommendations. The author makes no representations as to the accuracy, completeness, or suitability of this information. FXStreet and the author will not be liable for any errors, omissions or any losses, injuries or damages arising from this information and its display or use. Errors and omissions excepted.
The author and FXStreet are not registered investment advisors and nothing in this article is intended to be investment advice.
United States CFTC S&P 500 NC Net Positions down to $-237.6K from previous $-208.1K
246267 July 30, 2022 04:45 FXStreet Market News
Information on these pages contains forward-looking statements that involve risks and uncertainties. Markets and instruments profiled on this page are for informational purposes only and should not in any way come across as a recommendation to buy or sell in these assets. You should do your own thorough research before making any investment decisions. FXStreet does not in any way guarantee that this information is free from mistakes, errors, or material misstatements. It also does not guarantee that this information is of a timely nature. Investing in Open Markets involves a great deal of risk, including the loss of all or a portion of your investment, as well as emotional distress. All risks, losses and costs associated with investing, including total loss of principal, are your responsibility. The views and opinions expressed in this article are those of the authors and do not necessarily reflect the official policy or position of FXStreet nor its advertisers. The author will not be held responsible for information that is found at the end of links posted on this page.
If not otherwise explicitly mentioned in the body of the article, at the time of writing, the author has no position in any stock mentioned in this article and no business relationship with any company mentioned. The author has not received compensation for writing this article, other than from FXStreet.
FXStreet and the author do not provide personalized recommendations. The author makes no representations as to the accuracy, completeness, or suitability of this information. FXStreet and the author will not be liable for any errors, omissions or any losses, injuries or damages arising from this information and its display or use. Errors and omissions excepted.
The author and FXStreet are not registered investment advisors and nothing in this article is intended to be investment advice.
US stocks close the month with strong gains
246266 July 30, 2022 04:17 Forexlive Latest News Market News
The major stock indices are ending with solid gains for the day:
- Dow industrial average rose 315.50 points or 0.97% at 32845.14
- S&P index rose 57.86 points or 1.42% at 4130.28
- NASDAQ index rose 228.10 points or 1.8% at 12390.70. That’s a largest increase cents April 2020
- Russell 2000 rose 12.20 points or 0.65% at 1885.23
For the trading month the average had their best month of the year:
- Dow industrial average rose 6.73%
- S&P index rose 9.12% which was the best month since November 2020
- NASDAQ index rose 12.35%.
For the trading week.
- Dow industrial average rose by 2.97%
- S&P index rose 4.26%
- NASDAQ index rose 4.7%
Some pretty good numbers for the day, week and month for the major indices. Moreover, the gains were made despite a 75 basis point hike and the earnings calendar.
Full Article
AUD/USD recovers towards 0.6970s post US PCE, but remains down
246265 July 30, 2022 04:05 FXStreet Market News
- AUD/USD fell from multi-week highs around 0.7031 and tumbled on risk-off impulse in the FX markets.
-
Fed’s Bostic: FOMC needs to do more in terms of interest rates, the US is not in a recession.
- The Fed’s favorite inflation gauge gives the green light for another rate hike.
The Australian dollar slides vs. the greenback, after hitting a daily high at 0.7031 but higher than estimated US inflation figures, triggered a U-turn in the FX space, with safe-haven peers leading the pack. At the time of writing, the AUD/USD is trading at 0.6976.
AUD/USD falls on risk-off impulse in the FX markets after a high US PCE reading
The AUD/USD is trading below its opening price as investors reassess the Fed decision. On Wednesday, bulls were everywhere, with global equities rallying as if the Federal Reserve paused or cut rates. The Fed indeed acknowledged that production and spending “softened” but did not signal that they would pause.
In fact, on Friday, the Atlanta Fed President Raphael Bostic said that he is convinced that the Fed is “going to have to do more in terms of interest-rate moves.” Bostic said he does not think the country is in a recession after Thursday’s weaker-than-estimated Advanced GDP for the second quarter came at -0.9%.
In the meantime, US inflation figures reported earlier reinforced what Bostic said. The Personal Consumption Expenditure (PCE), the Fed’s favorite gauge for inflation, rose 1% MoM and is up 6.8% YoY vs. estimations of 6.7%. The so-called core PCE, which extracts volatile items, increased from 4.7% foreseen to 4.8% YoY.
Therefore, the AUD/USD reaction to the headline pushed the pair downwards towards its daily low at 0.6911, 100 pips from its highs, though it has bounced back and is approaching its opening price. In the meantime, the US Dollar Index remains negative in the day, down 0.13%, sitting at 106.074.
Elsewhere, US President Joe Biden and his counterpart, Chinese President Xi Jinping, had a face-to-face meeting and directed teams to follow up. The lifting of tariffs on China’s products was not discussed, as they focused on Taiwan.
Another reason that would cap the AUD/USD gains is that China’s foreign trade is facing higher risks, according to China’s Commerce Minister. He added that the second-half trade growth is not optimistic.
Earlier in the Asian session, the Australian docket featured the Producer Price Index for the Q2 on its annual reading, which increased by 5.6%, more than the 4.9% estimated, giving enough ammunition to the Reserve Bank of Australia to continue hiking rates.
What to watch
Next week, the US economic docket will feature S&P Global and ISM Manufacturing PMIs for July on its final reading. The Australian calendar will unveil the Reserve Bank of Australia (RBA), Interest Rate Decision, where the bank is expected to hike 50 bps from 1.35% to 1.85%.