Articles
Cardano development activity could help the Ethereum killer navigate crypto winter
281069 December 31, 2022 19:40 FXStreet Market News
- Cardano ranks first among top blockchain protocols in 2022 in terms of development activity.
- The Ethereum killer outperformed Polkadot, Cosmos, Elrond, Optimism and others to top the development activity chart.
- Total value locked on the Cardano network has declined consistently throughout crypto winter.
Cardano, a smart contract network considered an Ethereum alternative, witnessed the highest development activity when compared to other altcoins in the crypto ecosystem. Spike in development activity could fuel a bullish sentiment among ADA holders as the altcoin struggles to wipe out losses from crypto winter.
Also read: XRP price forecast 2023
Cardano development activity leaves competitors to bite the dust
Cardano is a smart contract blockchain network developed by blockchain engineering firm Input Output Global and headed by Charles Hoskinson. Throughout 2022, Cardano ecosystem topped the charts in developmental activity on its blockchain.
Based on data from crypto intelligence tracker Santiment, the Ethereum alternative ranks first in the list of top 10 networks by development activity.
When the assets ranked in the top 10 list are ranked by their Return on Investment (ROI) since it’s token sale in USD terms, it is as follows.
ICP – 1.01
FLOW – 6.84
DOT – 14.9
EGLD – 51.0
ATOM – 93.5
ADA – 102
MATIC – 301
ETH – 385
Cardano ranks eighth in the list with an ROI of 102. It’s important to note that despite hitting developmental milestones and the massive ROI for holders the altcoin lags behind in total value locked. This metric is the DeFi equivalent of total market capitalisation.
Cardano lags behind in Total Value Locked
Based on data from DeFi tracker DappRadar, multiple decentralised applications in the network were unable to invite users to their platforms. Cardano’a popular frappe Miniswap and SundaeSwap lost 10% and 16.42% of active wallet addresses respectively.
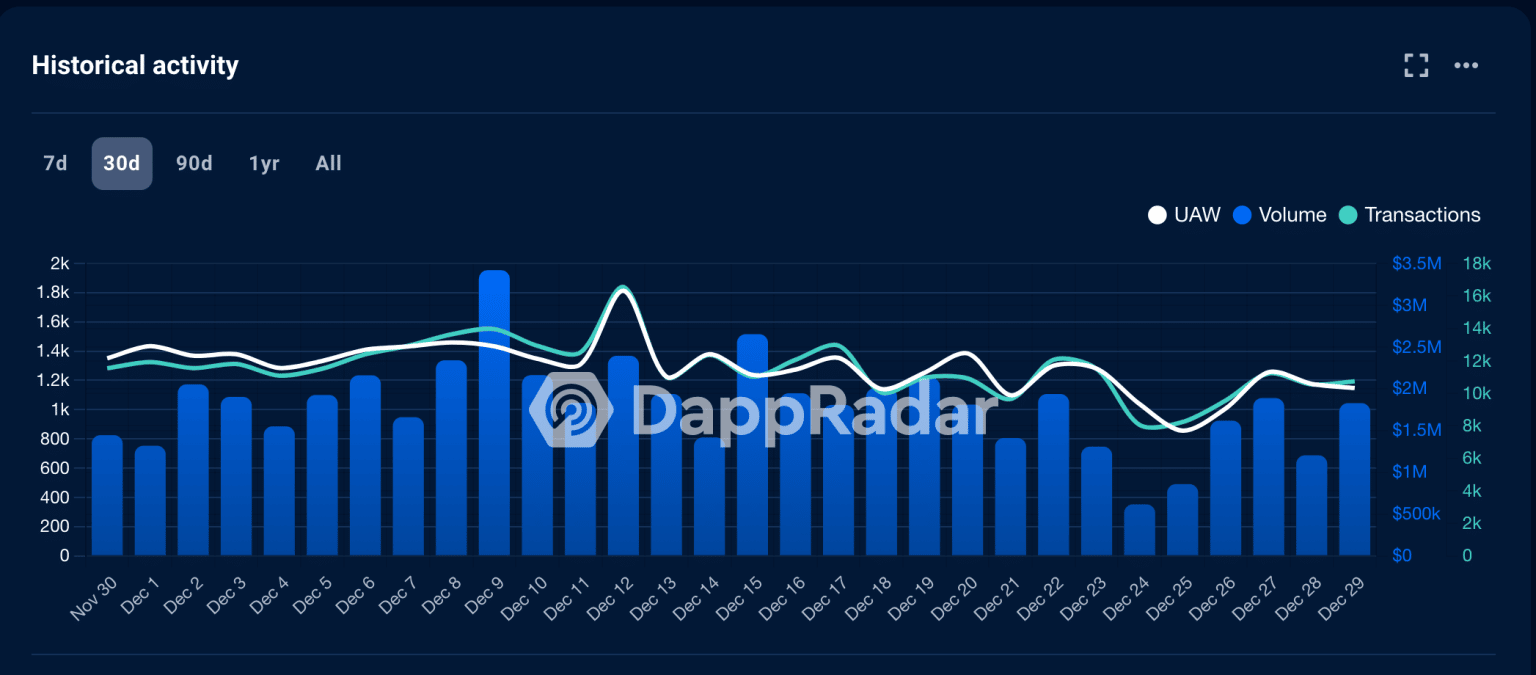 dApp activity on Cardano
Declining dApp activity has hampered Cardano’s total value locked.
DefiLlama, a DeFi data aggregator revealed that Cardano’s TVL had declined significantly. Within the last few months of 2022, the overall TVL generated by Cardano fell from $58 million to $50 million.
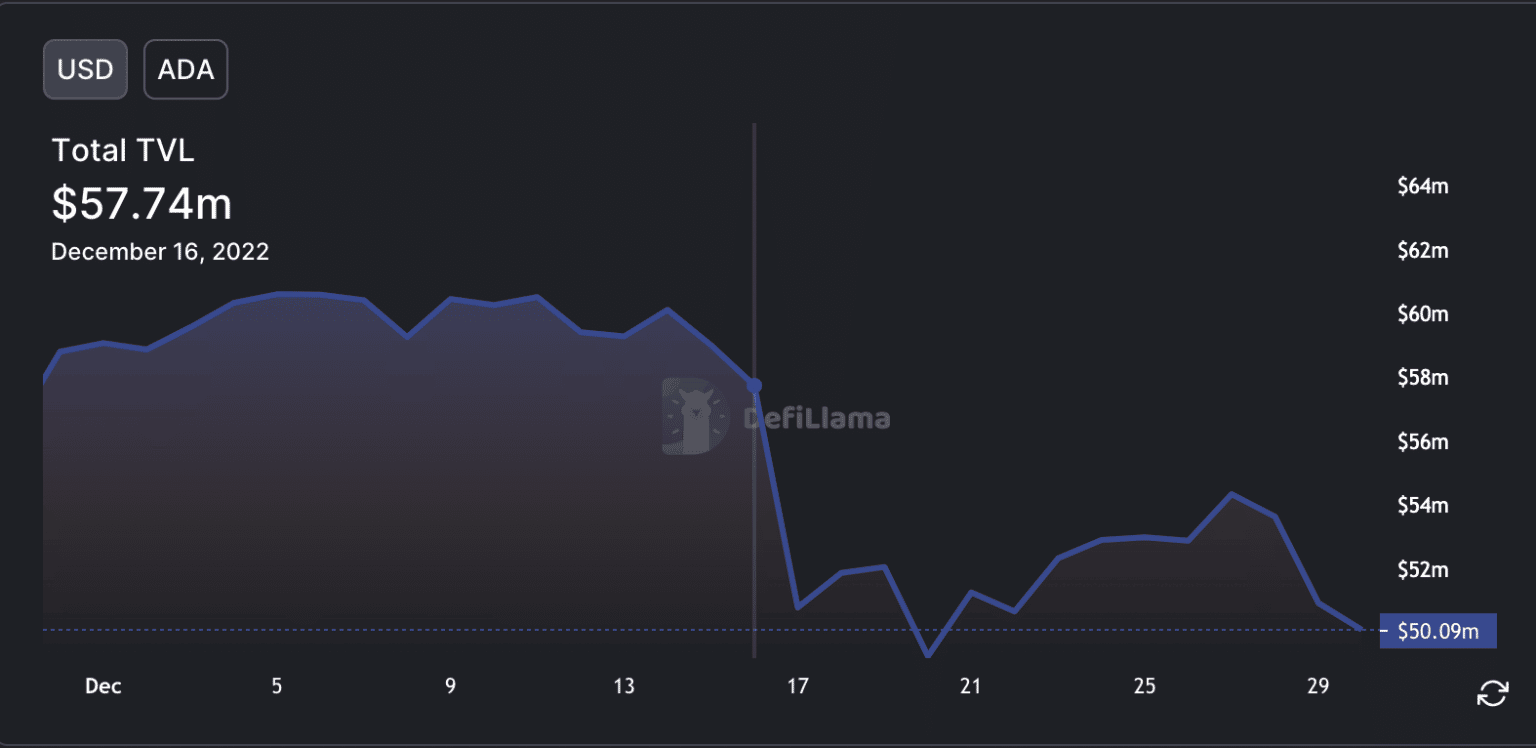 Cardano TVL
It remains to be seen whether fast paced development activity on the Cardano network will help the Ethereum killer wipe out losses from crypto winter. Cardano price is largely unchanged over the past 24 hours.
Full Article
Bitcoin on track to be undervalued as stablecoin reserves drop to pre-2021 bull run levels
281065 December 31, 2022 18:17 FXStreet Market News
- Bitcoin is not undervalued as on-chain profit and loss indicators predict BTC bottom is approaching.
- Unspent transaction output in profit and loss provides clear BTC buy signals when a cross is generated, the indicator is yet to show a cross in this cycle.
- Experts believe Bitcoin price is on track for a massive trend reversal as exchange stablecoin reserves drop to pre-2021 bull run levels.
Bitcoin is on track to hit a cycle bottom and begin its recovery as stablecoin reserves across exchanges arrive at pre-bull run levels. Experts are closely watching Unsoent Transaction Output (UTXOs) in profit and loss for a cross, a buy signal that times when BTC is undervalued.
Bitcoin is not undervalued yet despite stablecoin reserves hit pre-bull run levels
Bitcoin on-chain indicators currently signal that the asset has reached the undervalued area. However, unlike most cycle indicators like Puell Multiple and SOPR, Unspent Transaction Output Profit and Loss (UTXOs) is key in identifying when Bitcoin is undervalued.
A cross in UTXOs profit and loss generates a buy signal for Bitcoin and affirms that BTC is undervalued. While other on-chain data helps understand the overall BTC phase, it is difficult to ascertain the buying time. When UTXOs in the profit and loss indicators were crossed, BTC price hit a floor, three halvings in a row.
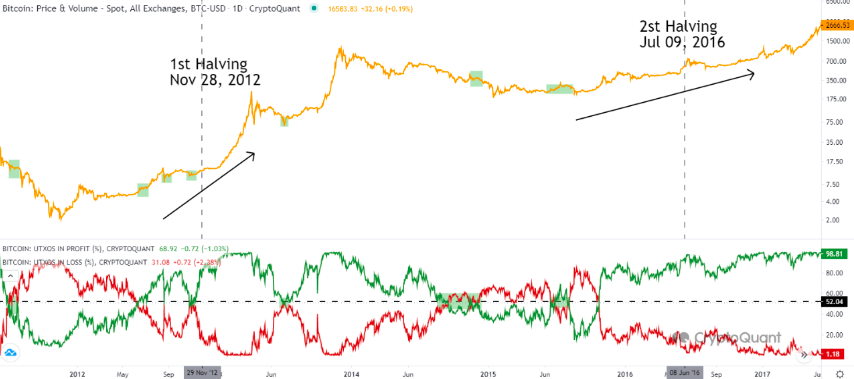
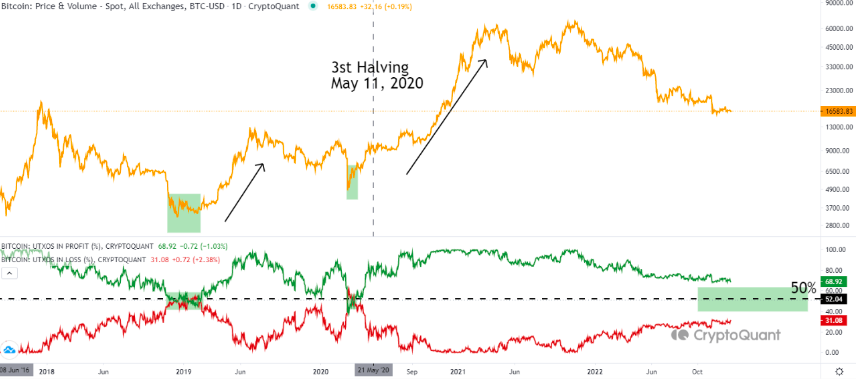
Bitcoin UTXOs in profit and loss
Once a cross is generated in the chart above, Bitcoin could nosedive. Another key indicator of upcoming Bitcoin trend reversal is stablecoin reserves on exchanges.
Stablecoin reserves on exchanges hit pre-bull run levels
Stablecoins like USD Tether (USDT) and USDC play a key role in Bitcoin price rallies. Since stablecoins are the point of entry, conversion of fiat to crypto, the flow of USDT and other stablecoins in the ecosystem has an impact on BTC price. Spot exchange stablecoin reserves have dropped to their pre-2021 bull run levels. At the same time, volatility in stablecoin inflows has hit an all-time high.
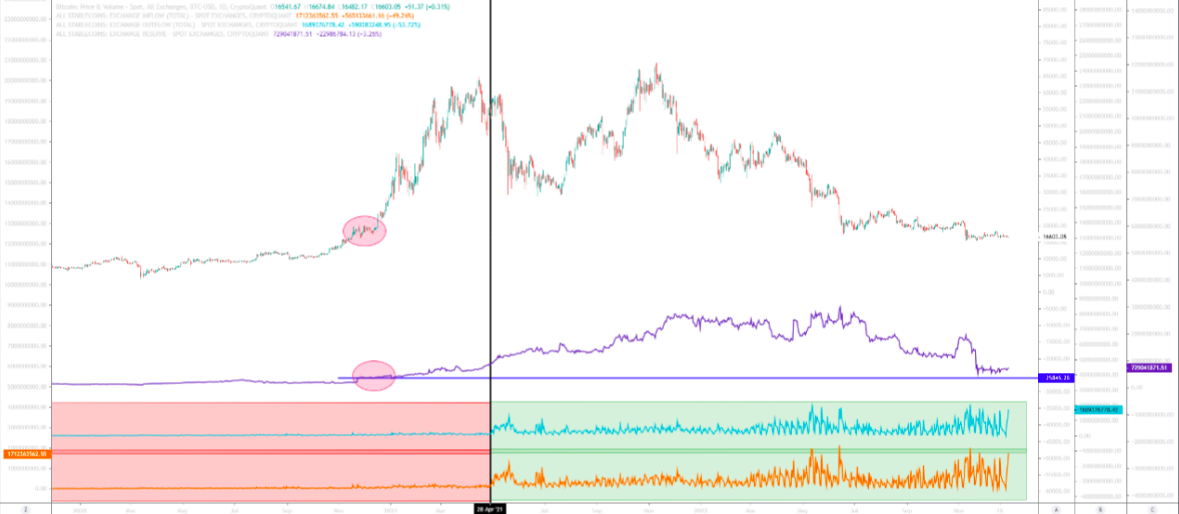
Stablecoin reserves on spot exchanges
An increase of stablecoin inflow to the exchange is considered rising demand for assets like Bitcoin. Holders of large volumes of stablecoins increase their transfer to exchanges before a trend reversal and rally in BTC. With rising demand and higher volatility in stablecoin inflows, Bitcoin price is preparing for the next bull run.
Full Article
Dogecoin developer announces no plan to move to proof-of-stake, DOGE slips 12% in a week
281064 December 31, 2022 16:05 FXStreet Market News
- Dogecoin core developer Michi Lumin reveals the meme coin has no plans to move to the proof-of-stake consensus mechanism.
- The plan is to share a proposal with the DOGE community, to move to a chain different from a traditional proof-of-stake.
- DOGE price plummeted 12% in the past week as the developer assures holders that there will be deliberation on the upcoming proposal.
Dogecoin, a dog-themed meme coin has no plans to change its consensus mechanism to proof-of-stake. DOGE core developer announces that the community will be presented with a proposal for a consensus mechanism, different from traditional proof-of-stake. DOGE continues to bleed through crypto winter.
Also read: Samuel Bankman-Fried reportedly cashed $684,000 using Seychelles-based crypto exchange
Dogecoin developer says DOGE is not moving to proof-of-stake
Dogecoin, the largest meme coin in the crypto ecosystem, is not moving to the proof-of-stake ecosystem. Post Ethereum’s Merge, influencers on crypto Twitter told the DOGE community that the meme coin is prepared to switch its consensus mechanism.
Ethereum’s successful Merge, according to these experts, paved the way for Dogecoin’s transition to proof-of-stake. Michi Lumin, a core Dogecoin developer, told the community that decisions are made by the DOGE community. No influencer can take charge and change the consensus mechanism of Shiba Inu’s competitor.
The developer assured DOGE holders that a proposal will be shared with the community. The technical expert proposes that Dogecoin should adopt a consensus mechanism, with few similarities to traditional proof-of-stake.
Lumin reminded the DOGE community that Dogecoin blockchain is similar to old Bitcoin technology, not ERC-20 tokens. Therefore no individual or organization can move the chain to proof-of-stake.
Dogecoin’s new consensus mechanism will focus on community participation
Dogecoin’s primary guiding factor for the new proposal for consensus mechanism change is the ability of community members to participate. This would prevent large organizations from taking control of the DOGE network.
The proposal will need approval from the community to move forward with the consensus mechanism change. If and when the proposal is put forward, Lumin believes there will be community deliberation before a shift in consensus.
Dogecoin plummeted nearly 12% over the past week. Meme coins like DOGE and SHIB are struggling to wipe out losses
Full Article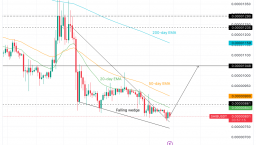
Shiba Inu developers are finalizing Shibarium launch, bulls target $0.00001048 for SHIB
281062 December 31, 2022 14:29 FXStreet Market News
- Shiba Inu lead Shytoshi Kusama announced that the layer-2 scaling solution Shibarium launch is close.
- A major developer of the SHIB network stated that following the recent website redesign there will be Shibarium docs and then beta.
- Shiba Inu price broke out of its falling wedge and bulls target the $0.00001048 level.
Shiba Inu layer-2 scaling solution Shibarium’s development is underway. Shytoshi Kusama, the lead of the project, confirmed that Shibarium will launch soon and it is being “finalized.” Shiba Inu price outlook remains bullish after breaking out of the falling wedge.
Also read: Samuel Bankman-Fried reportedly cashed $684,000 using Seychelles-based crypto exchange
Shiba Inu lead says Shibarium launch is finalized
Shiba Inu is Dogecoin’s competitor and the second largest meme coin in the crypto ecosystem. Lead of the project, Shytoshi Kusama announced that the much awaited layer-2 scaling solution Shibarium will be launched soon.
The scaling solution project is currently under development and according to a recent tweet by Kusama, developers are “Aligning. Onboarding. Finalizing. Soon. Very soon.”
The layer-2 blockchain’s objective is to help the Shiba Inu network scale on its host chain Ethereum. Developers are building Shibarium with custom features for the Shiba Inu ecosystem. The upgrade marks a milestone in the Dogecoin-killer’s ecosystem and Kusama expects 2023 to be a big year for the project.
The Doge-killer token’s community is looking forward to Shibarium’s beta version release. Shiba Inu price remained largely unchanged over the last 24 hours.
Shiba Inu bulls target the $0.00001048 level
Shiba Inu price is on track to wipe out its losses from the past month. The launch of Shibarium, a long-awaited event in the SHIB ecosystem, could trigger a rally in the token. SHIB broke out of its falling wedge, A and B represent the two key levels, $0.00001235 and $0.00000861.
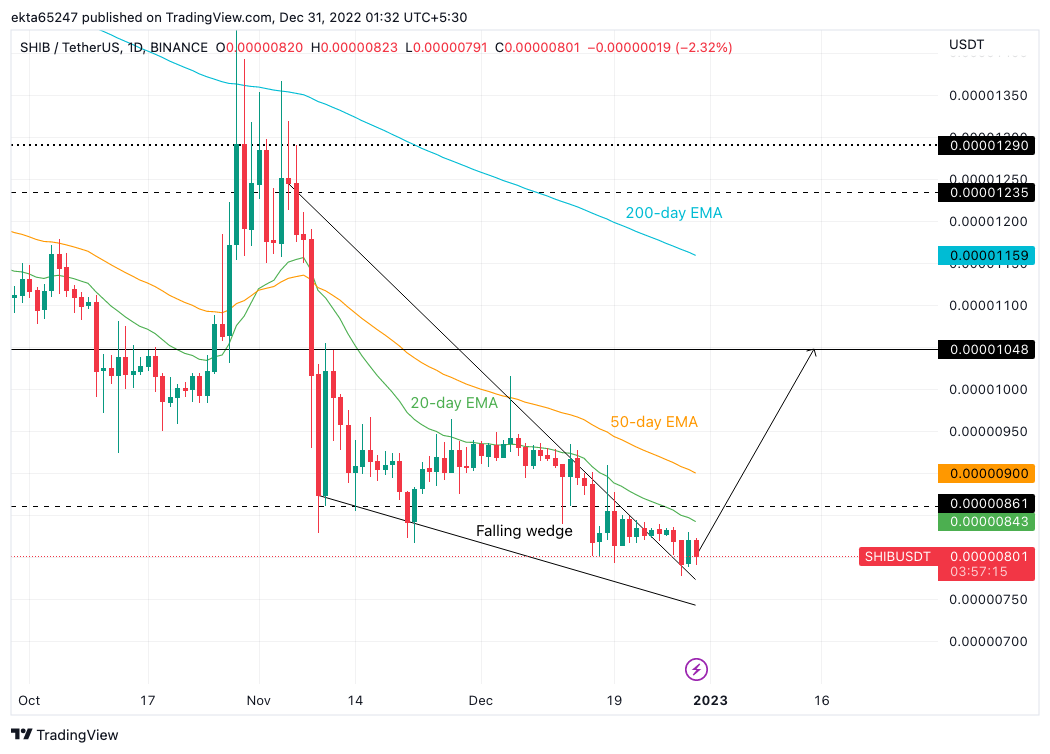
SHIB/USDT price chart
The point between levels A and B is represented by the target of $0.00001048. The target of the bullish breakout from the falling wedge is the $0.00001048 level. Since Shiba Inu price closed outside the upper trendline, the breakout is validated.
A decline below the $0.00000750 level could invalidate the bullish thesis for the Dogecoin-killer’s price.
Full Article
China NBS Manufacturing PMI came in at 47, below expectations (49.2) in December
281061 December 31, 2022 09:35 FXStreet Market News
Information on these pages contains forward-looking statements that involve risks and uncertainties. Markets and instruments profiled on this page are for informational purposes only and should not in any way come across as a recommendation to buy or sell in these assets. You should do your own thorough research before making any investment decisions. FXStreet does not in any way guarantee that this information is free from mistakes, errors, or material misstatements. It also does not guarantee that this information is of a timely nature. Investing in Open Markets involves a great deal of risk, including the loss of all or a portion of your investment, as well as emotional distress. All risks, losses and costs associated with investing, including total loss of principal, are your responsibility. The views and opinions expressed in this article are those of the authors and do not necessarily reflect the official policy or position of FXStreet nor its advertisers. The author will not be held responsible for information that is found at the end of links posted on this page.
If not otherwise explicitly mentioned in the body of the article, at the time of writing, the author has no position in any stock mentioned in this article and no business relationship with any company mentioned. The author has not received compensation for writing this article, other than from FXStreet.
FXStreet and the author do not provide personalized recommendations. The author makes no representations as to the accuracy, completeness, or suitability of this information. FXStreet and the author will not be liable for any errors, omissions or any losses, injuries or damages arising from this information and its display or use. Errors and omissions excepted.
The author and FXStreet are not registered investment advisors and nothing in this article is intended to be investment advice.
China official PMIs: Manufacturing 47.0 (vs. prior 48.0) & Services 41.6 (prior 46.7)
281060 December 31, 2022 09:33 Forexlive Latest News Market News
December PMIs from China’s National Bureau of Statistics (NBS) and the China Federation of Logistics and Purchasing (CFLP).
Languishing with the renewed COVID-19 outbreak as China moved rapidly towards reopening. While widespread lockdowns are a thing of the past self-imposed isolation and illness have seen impacts on the Chinese economy as workers stay home and others (at the margin) avoid going out and about. Check out the Services PMI, 41.6 is deeply contractionary. Eating out, shopping, personal services, and more – all suffering.
–
As a note, major forex centres in Asia will all be closed on Monday.
- Japan, Singapore, Hong Kong, Australia and New Zealand markets are all closed.
China is also out on Monday.
Full Article
China Non-Manufacturing PMI came in at 41.6 below forecasts (51.4) in December
281059 December 31, 2022 09:29 FXStreet Market News
Information on these pages contains forward-looking statements that involve risks and uncertainties. Markets and instruments profiled on this page are for informational purposes only and should not in any way come across as a recommendation to buy or sell in these assets. You should do your own thorough research before making any investment decisions. FXStreet does not in any way guarantee that this information is free from mistakes, errors, or material misstatements. It also does not guarantee that this information is of a timely nature. Investing in Open Markets involves a great deal of risk, including the loss of all or a portion of your investment, as well as emotional distress. All risks, losses and costs associated with investing, including total loss of principal, are your responsibility. The views and opinions expressed in this article are those of the authors and do not necessarily reflect the official policy or position of FXStreet nor its advertisers. The author will not be held responsible for information that is found at the end of links posted on this page.
If not otherwise explicitly mentioned in the body of the article, at the time of writing, the author has no position in any stock mentioned in this article and no business relationship with any company mentioned. The author has not received compensation for writing this article, other than from FXStreet.
FXStreet and the author do not provide personalized recommendations. The author makes no representations as to the accuracy, completeness, or suitability of this information. FXStreet and the author will not be liable for any errors, omissions or any losses, injuries or damages arising from this information and its display or use. Errors and omissions excepted.
The author and FXStreet are not registered investment advisors and nothing in this article is intended to be investment advice.
The strongest to the weakest major currency and cross currency pairs in 2022
281058 December 31, 2022 07:51 Forexlive Latest News Market News
The 2022 year is in the books and the final rankings of the strongest to the weakest of the major currencies is showing the USD as the strongest and the JPY as the weakest.
The strongest to the weakest of the major currencies
The central bank fundamentals drove both the USD and the JPY to their respective positions.
The Federal Reserve hiked rates the fastest and the most of all the major countries. Overall, the Federal Reserve hiked rates by 4.25% from 0.25% at the end of 2021 to 4.5% (high target) at the end of 2022.
The Bank of Japan did not hike once in 2022, choosing instead to maintain their steady rate policy in the face of a tick up in inflation. As a result, their currency was hit hard for most of the year with the USDJPY reaching the highest level going back to July 1990 at it’s peak on October 21, 2022.
At the high the USDJPY had move up 32.02% for the year. The last 2+ months did see the USDJPY pair correct more than 50% of the years trading range, with the USDJPY ending the year still up 13.91% but well off the highs.
Catalysts for the decline in the USDJPY (rise in the JPY) other than overbought technical conditions and some technical tilts including a break below the 100 and 200 day MAs, include:
- Softening of US inflation,
- More restrictive Fed policy which shifted the bias for the economy lower going into 2023 (at least from the market traders),
- Lower US stocks
The Bank of Japan did their part, by hiking the ceiling yield for the 10 year bond to 0.5% from 0.25% in December (a small but meaningful gesture and shift).
Overall, the respective central banks did the following in 2022:
- Federal Reserve +4.25%
- Bank of Canada, +4.00%
- Reserve Bank of New Zealand 3.25%
- Bank of England 3.25%
- Reserve Bank of Australia 3.00%
- ECB 2.5%
- SNB +1.75%
- Bank of Japan 0.0%
The next strongest currency behind the US was the CHF. Although the SNB raised rates by 1.75% – less than all but the Bank of Japan, they tended to benefit from safe haven flows in 2022 (and not being part of the EU or GBP). They had a bit of the best of the rest.
On the weak side, the next weakest of the majors was the GBP. The GBP suffered from the impact of the Ukraine War and its proximity to the EU nations (and trade reliance). They also suffered from political uncertainty with 3 separate PMs in 2022. Fiscal blunders from Liz Truss’s 40 or so day’s as Prime Minister also led to sharp selling in September.
The combination had investors shunning the pound.
The GBPUSD move to a low of 1.0352 on September 26th before retracing 61.8% into December helped by a settling of the government issues, and a calming from the anxiety from gas/oil. A weaker USD into year end also helped the GBPUSD recover.
The GBPUSD settled the year right around the 50% midpoint of the 2022 trading range at 1.20499. Nevertheless, the USD gained 10.7% vs the GBP in 2022.
The EUR was the next strongest behind the CHF despite the trouble from bordering Ukraine. A relatively mild winter and stockpiling of natural gas helped the EURUSD into year end. The ECB increased their hawkish tilt at the December meeting which has helped to keep the gains from the November run higher.
The AUD, CAD and the NZD had gains and losses vs the major currencies in 2022. Some ups and some downs vs the majors earns the distinction of being “mixed” in 2022.
Below are the gainers and the losers of the major pairs. NOTE if the USDJPY was up 13.91%, I simply inversed the JPYUSD for simplicity purposes.
The strongest to the weakest of the major pairs in 2022
Major 2Y & 10Y yields (w/ Japan the exception) moved higher in 2022 as CB shifted policy
281057 December 31, 2022 06:26 Forexlive Latest News Market News
Both 10 and 2 year yields moved higher in 2022, pushed by much tighter central bank policy.
10 year yields moved sharply higher in 2022
The chart above shows the 2021 end of year 10 year yields, the end of year 2022 10 year yields, along with the changes for the year in those yields for major global countries.
The largest gains in 10 year yields for the year were in EU as the markets started to discount higher yields in 2023 to fight inflation due to a more hawkish ECB going into 2023. The German 10 year is up 2.753%, the France 10 year is up 2.82%, Spain 10 year is up 3.066% and Italy rose the most by 3.535% from end of 2021 levels.
Japan is the expectation to the run higher as the Bank of Japan maintained a ceiling on 10 year yields at 0.25% for most of the year before raising that cap to 0.50% in December. The end of year yield closed at 0.41%.
In the US, the 10 year yield moved up 2.365% from end of 2021 levels (or 236 basis points). From the high in yield that was reached on October 21 at 4.335%, the 10 year yield has moved lower and is closing 2022 at 3.879%. The low for the year was on the 1st trading day of the year at 1.529%.
Technically, the 10 year remains above its 100 day MA at 3.637% (blue line in the chart below) after dipping below in early December. Those dips in early December found support near the 50% of the move up from the August low. Remember as well the Fed was more hawkish at their December 14 meeting raising the terminal rate to 5.1% from 4.6% in September.
US 10 year yield is off highs but above 100 day MA
Although the 10 year yield is off highs for the year, it will take a move below the 100 day MA (blue line) to give the downside more of a shot in 2023. That level is also where the 38.2% of the move up August low. Below that the 50% level at 3.426% will be eyed and below that is the rising 200 day MA at 3.257%
Those targets should be some tough downside hurdles, however, without the Fed shifting policy in 2023. Putting it another way, they are yield support levels into 2023.
Overall, since August when the last low yield level was reached at 2.516%, the Fed has tightened an additional 200 basis points with increases of 75 basis points in September and November and an additional 50 basis points in December. That pushed the Fed Funds target to 4.5% currently (with expectations for more in early 2023).
The current yield at 3.88% is 62 basis points below that Fed Funds target level and with the potential for another 75 basis points from the Fed in 2023, hopes to the downside are limited, barring a shift in Fed expectations. However, judging from the Fed comments in December, that shift is not likely soon which should make the 100 day MA a tough nut to crack going into 2023.
Taking a look at the 2 year yield changes, the European yield changes (in bps) is near the US change of 3.69% (or 369 basis points) in 2022. The German 2 year yield is up 3.40%, and Spain is up 3.62% with France and Italy between those changes. Of note is the Euro 2 year yields were negative at the end of 2021. As a result, with Italy 2 year at 3.34% and German current 2 year yield at 2.76%, they are well below the comparable US 2 year at 4.427%.
A contributor to that spread is that the ECB hiked rates by 2.5% or 250 basis points in 2022 vs 4.25% in the US.
2 year yield comparisons vs major countries
Looking at the chart below, it shows the change in the 2 year yields in respective countries vs the change in the target rates by the respective central banks.
IN the US, the fed hiked rates 4.25% (from 0.25% to 4.5%) in 2022. The 2 year yield is up 3.69% or 369 basis points in 2022 (the rate is 4.427%). The negative spread between the change in central bank rate to the current 2 year yield is saying the Fed is ahead of the curve. Their policy is restrictive.
In comparison, the European yields are above the the change in ECB policy. For Spain, the 2 year yield is up 3.62% or 262 basis points vs only 250 basis points of tightening in 2022.
Clearly, the market is saying the ECB is behind in their tightening and indeed that was supported by the more hawkish ECB statement and presser by Lagarde in December.
Looking at the other countries, Canada with 4.0% or 400 basis points of tightening in 2022, has seen their 2 year move up by 3.10% (or 310 basis points), indicative of the markets belief that the tightening cycle may also be more near an end in that country going into 2023. New Zealand, Australia and UK have seen near equal changes in 2 year yields to changes in policy rates in 2022 (all with 27 basis points).
2 year yield change vs central bank policy change in 2022
Looking at the 2 year yield on the daily chart, the current 2 year yields is at 4.427% vs a Fed funds target at 4.5%. Once again the expectations are for the Fed to continue to tighten into 2023 (up to 75 basis points from them), but the market is not so sure with the 2 year below the current Fed funds target of 4.5%.
If the market sentiment gets even more bearish on the economy with expectations for inflation to tumble, a break below the rising 100 day MA at 4.127% will be eyed as a technical clue. Get and stay below that level would tilt the bias more to the downside. with the 200 day MA at 3.465% (and rising) another target. Ahead of that, watch 3.80% which is the 50% of the move up from the July corrective low.
Those levels would need to be broken and if so, would be indicative of an economy that is rolling over with inflation coming back toward the 2% target area.
Absent that, and the market is continuing to spar with the Fed and the economic data, and waiting for either a more hawking winner (more inflation/continued strong employment) or bearish winner (lower inflation/higher unemployment)
The US 2 year yield is above the 100 day MA
Heads up for Chinese data to be published over the weekend – official PMIs for December
281056 December 31, 2022 05:51 Forexlive Latest News Market News
Coming up on Saturday, 31 December 2022 are the December PMIs from China’s National Bureau of Statistics (NBS) and the China Federation of Logistics and Purchasing (CFLP).
The December results are likely to show the ill-effects of surging COVID-19 cases in China as the country embraced reopening.
On those ‘expected’ results, it’s a small sample survey only. I expect both results will remain in contraction.
Also, while you are here, Asian trading this coming Monday, January 2, will be neglibile. It’s the New Year observance holiday in all major forex centres and China.
- Japan, Singapore, Hong Kong, Australia and New Zealand markets are all closed.
EUR/GBP reaches fresh three-month highs above 0.8860 as the pound loses ground
281055 December 31, 2022 05:12 FXStreet Market News
- The Euro appreciates for the second consecutive day to reach fresh three-month highs at 0.8875.
- The Pound losses ground weighed by grim UK economic perspectives and hopes of a slower BoE tightening.
- EUR/GBP appreciates about 5.5% in 2022 with the Sterling hit by the UK’s political drama.
The Euro finally managed to pierce the 0.8860 resistance area on Friday, extending its rebound from session lows at 0.8820 to fresh three-month highs at 0.8870 so far. The common currency is taking advantage of a moderately weak Sterling on a sluggish pre-holiday session.
The pair has shrugged off the mild risk aversion on the back of concerns about the consequences of the strong COVID-19 outbreak in China and the escalating tensions in Ukraine, to appreciate for the second consecutive day.
On the other hand, the Pound remains offered across the board, weighed by the grim economic perspectives in the UK and hopes that the Bank of England will slow down its monetary tightening path over the coming months.
The Sterling is about to close its worst year since 2016
The EUR/GBP is set to end the year with a 5.5% appreciation, favored by the broad-based pound weakness in 2022. The Sterling was hit hard by the political uncertainty during the last months of Boris Johnson’s mandate and Liz Truss’ tax reform fiasco.
Johnson’s successor’s Downing Street tax cut plan caused a historical Pound crash in October and prompted an intervention by the Bank of England to avert a credit crunch.
The Pound has firmed up somewhat in the fourth quarter, as the election of Rishi Sunak calmed the markets although the negative economic outlook coupled with soaring inflation is keeping GBP buyers at bay.
Technical levels to watch
Full Article
United Kingdom CFTC GBP NC Net Positions fell from previous £-5.6K to £-10.9K
281054 December 31, 2022 05:09 FXStreet Market News
Information on these pages contains forward-looking statements that involve risks and uncertainties. Markets and instruments profiled on this page are for informational purposes only and should not in any way come across as a recommendation to buy or sell in these assets. You should do your own thorough research before making any investment decisions. FXStreet does not in any way guarantee that this information is free from mistakes, errors, or material misstatements. It also does not guarantee that this information is of a timely nature. Investing in Open Markets involves a great deal of risk, including the loss of all or a portion of your investment, as well as emotional distress. All risks, losses and costs associated with investing, including total loss of principal, are your responsibility. The views and opinions expressed in this article are those of the authors and do not necessarily reflect the official policy or position of FXStreet nor its advertisers. The author will not be held responsible for information that is found at the end of links posted on this page.
If not otherwise explicitly mentioned in the body of the article, at the time of writing, the author has no position in any stock mentioned in this article and no business relationship with any company mentioned. The author has not received compensation for writing this article, other than from FXStreet.
FXStreet and the author do not provide personalized recommendations. The author makes no representations as to the accuracy, completeness, or suitability of this information. FXStreet and the author will not be liable for any errors, omissions or any losses, injuries or damages arising from this information and its display or use. Errors and omissions excepted.
The author and FXStreet are not registered investment advisors and nothing in this article is intended to be investment advice.