Articles

PNC bank the frontrunner in First Republic auction – report
308926 April 30, 2023 23:49 Forexlive Latest News Market News
The bidding deadline for First Republic Bank is at noon ET and Fox Business’ Charles Gasparino reports that people inside BofA and JPM think PNC Bank “has the inside track” in bidding.
He notes that steering FRC to PNC wouldn’t lead to the same concentration problems as if it went to a bigger bank. PNC would also be expanding to new regions, potentially improving competition.
Everyone is expecting a First Republic announcement before Asian markets open.
Full Article
Where the Ethereum price will close on Sunday night will be vital to avoid a 25% price correction in ETH
308924 April 30, 2023 22:33 FXStreet Market News
- Ethereum price is eking out small gains near closing out this week.
- ETH needs to keep its price action above $1,930.
- If by Sunday night, ETH closes below $1,930, expect to see a selloff in May that could bring Ethereum price to $1,400.
Ethereum (ETH) price is at a crucial level as it could mean either more upside or downside to come for the month of May. This a very binary view or outlook, thus, as it makes total sense to look for where the Ethereum price is currently trading at. A weekly close below $1,930 means that bulls have lost the power to push ETH towards $2,000 and instead could see bulls vacating the premises with Ethereum price tanking to $1,400.
Ethereum price on a very binary moment that could predict May’s end result
Ethereum price is having traders scratching their heads on what to do next as price action is at a crossroads to go either substantially higher or lower with on middle ground. The close by Sunday night will never have been so important to determine what May will bring for Ethereum. Should ETH close below $1,930, expect mayhem and nearly four red candles for May as bulls will start to escape.
ETH would tank near 25% for the month as bulls have lost their control over the price action as clearly they were unable to reclaim ground above $1,930. More profit-taking would get underway, and first, see ETH to try and find support near $1,690. Once that fails, a broad slide toward $1,404 looks inevitable, although it is not yet the low of the year.
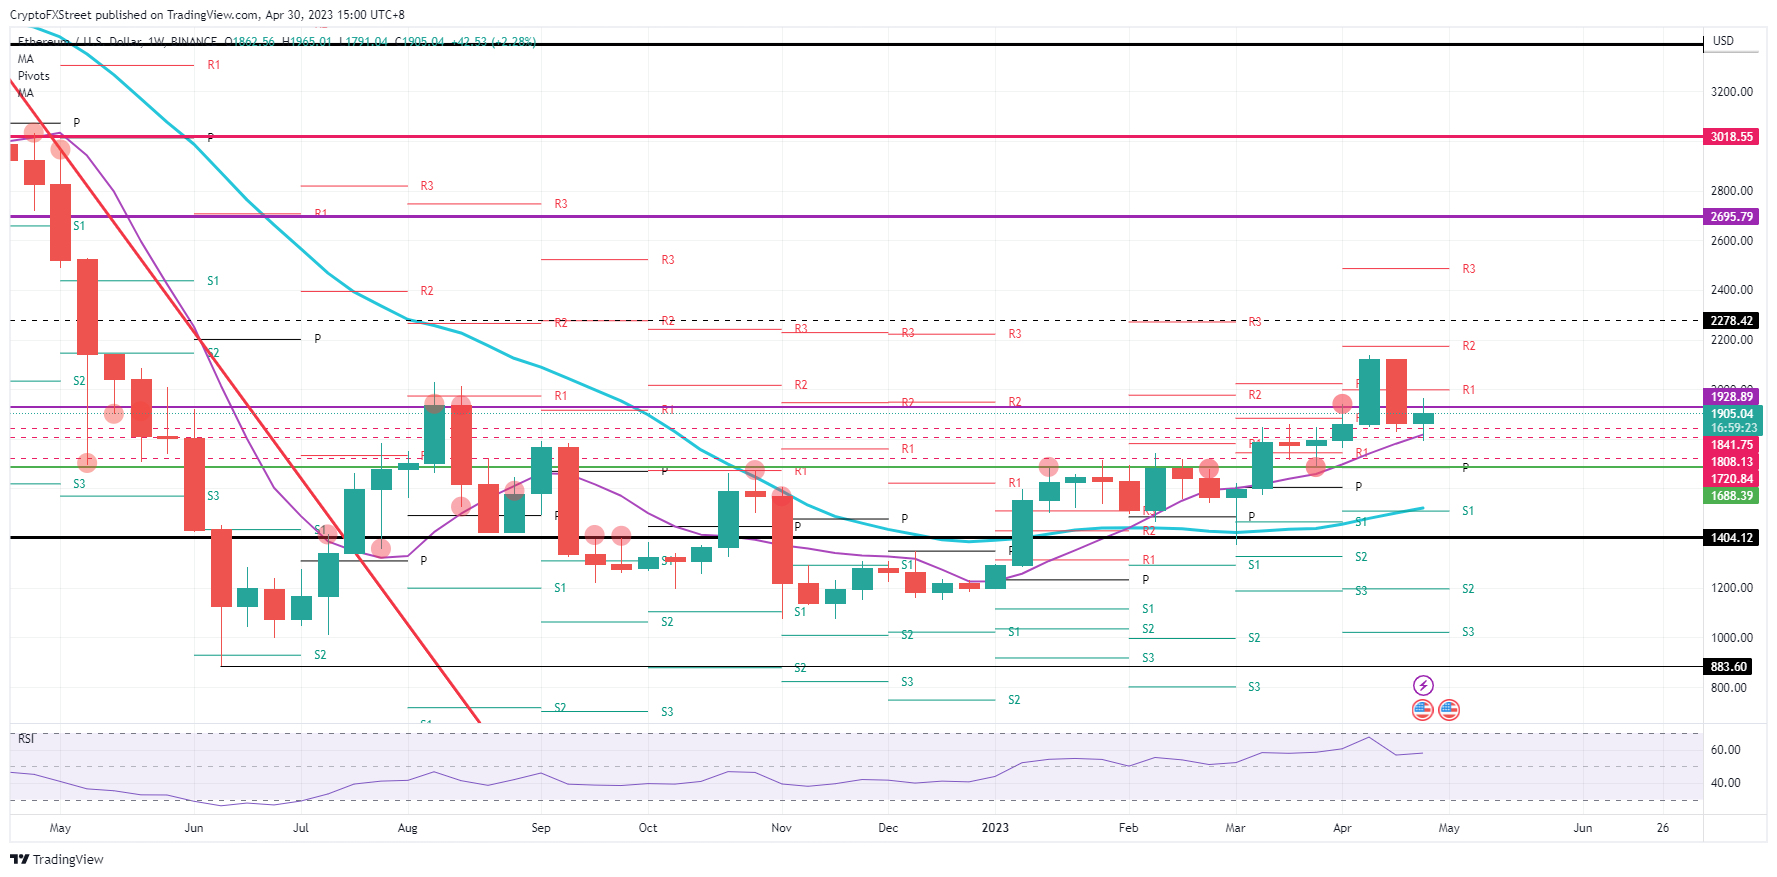
ETH/USD weekly chart
Not all is lost when bulls can still push price action up and book that weekly close above $1,928. From there, Ethereum price could start building a rally that would become quite substantial after breaking first the double top near $2,120. From there, ETH could jump 10% and head to $2,280, making it a 20% profitable jump.
Full Article
Dogecoin price rejection means trouble for next week where DOGE could tank 30%
308922 April 30, 2023 20:29 FXStreet Market News
- Dogecoin price tries to hold its slim gains over the weekend.
- DOGE, though, has broken below substantial support, which now has turned into resistance.
- Expect DOGE to see a violent decline for May, bearing nearly 30%.
Dogecoin (DOGE) price is in dire need of some help, although it is questionable which company Elon Musk could buy to place the Dogecoin logo on it. All things aside, the performance of this week was a straight F, as the Bulls were unable to reclaim a vital support element. By giving up on the 200-day Simple Moving Average (SMA), bulls settled for some small profit this week, while things could get ugly as of next week with 30% losses as the end result.
Dogecoin price could get a hangover from May’s performance
Dogecoin price is continuing its decline after peaking above $0.1 in early April and has been unable to make it back up there since. Although it briefly looked that April would be becoming its best-performing month, it starts to look that April will have been the pivotal month that has started an excruciating decline. Since last week DOGE had to give up on the always-important support of the 200-day SMA and is currently even at risk of getting a rejection on its topside from it.
DOGE could tank quite substantially next week, with a decline below the monthly pivot bearing 10% of losses. The week after that could be the pain trade with 25% losses to bear as the price is set to drop like a stone. DOGE would get valued near $0.56 and revisit the low of October of last year and erasing all profit on its yearly performance for 2023.
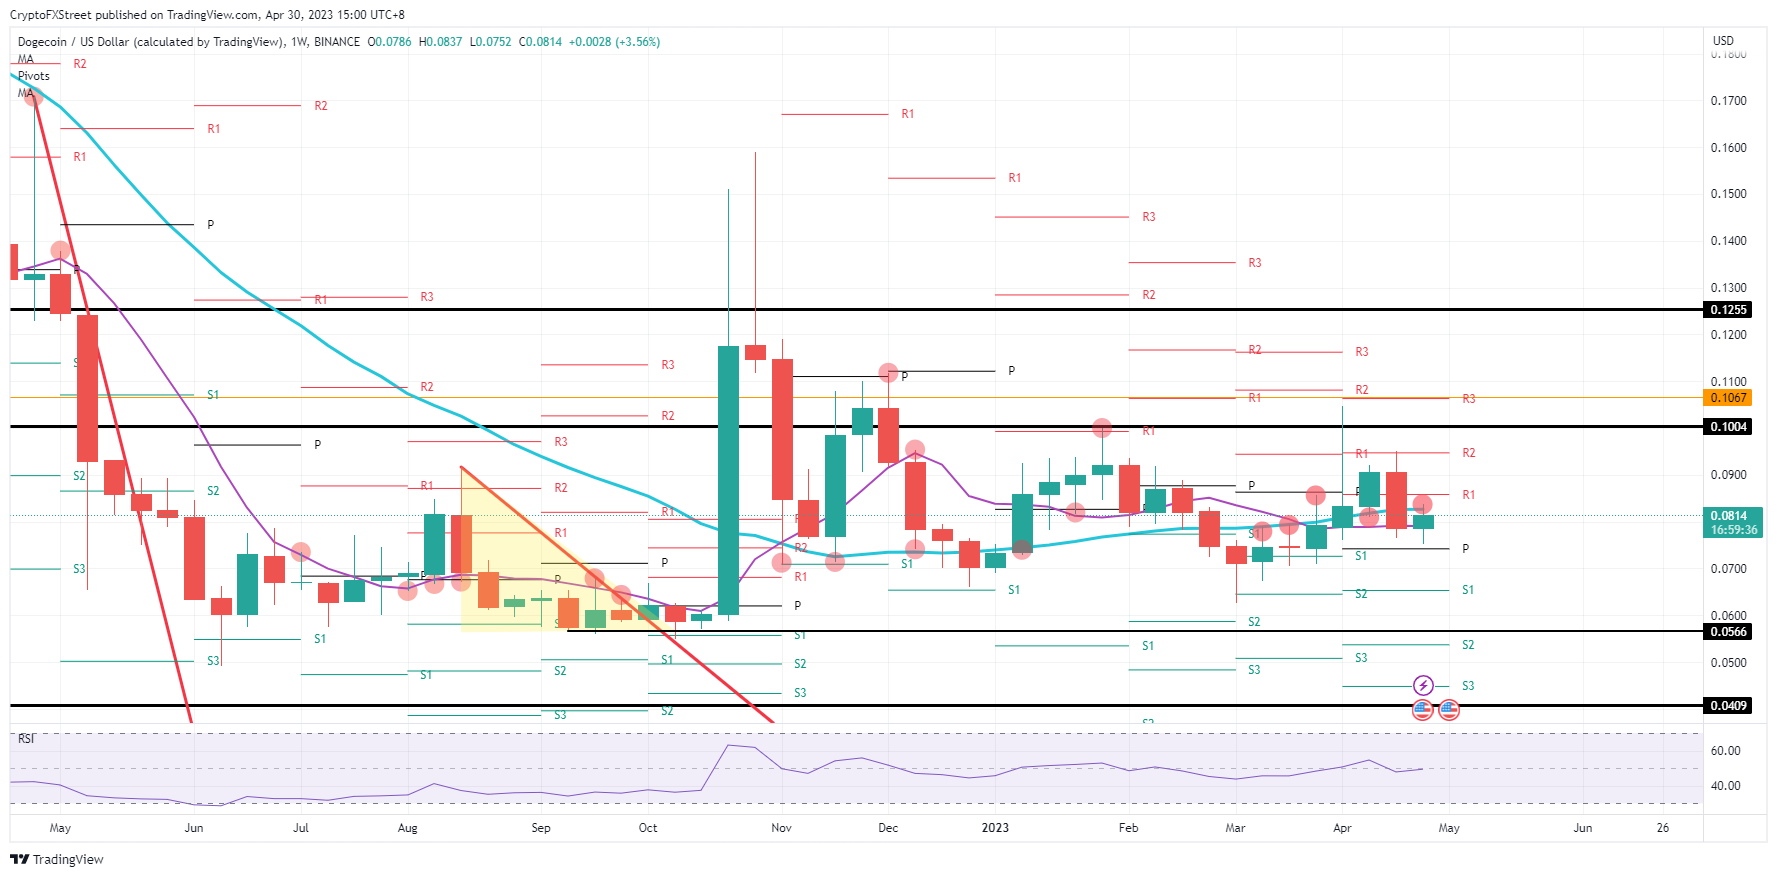
DOGE/USD weekly chart
Bulls could still save the day, or the week for that matter, by erasing that rejection that is currently happening on that topside. A break back above the 200-day SMA at $0.84 would be enough to set the record straight and put bulls in pole position for next week. With 20% gains projected and DOGE hitting $0.10 again, all risk of a decline will be long forgotten.
Full Article
Ripple price to crash 40% as bulls do not respect handles
308920 April 30, 2023 18:33 FXStreet Market News
- Ripple price has continued its decline since the end of March.
- XRP, though, might eke out gains for this week.
- The descent is still ongoing, and we could see acceleration as support this week got broken again.
Ripple (XRP) price is starting to become an example of ‘the faster they grow, the harder they fall.’ The slide of last week with already 10% losses should have been a warning for bulls that sentiment is starting to change across the board. This week looks to be no different, as support got broken again and is showing signs of weaker buying on dips.
Ripple price starts to make no sense in terms of trade management
Ripple price is starting to show cracks as the descent is not yet showing signs of being done just yet. Although XRP might be printing a green candle for this week, from a trade management perspective, it does not make sense as the 55-day Simple Moving Average (SMA) has been broken to the downside. Bulls who entered below are fully exposed and are set up for a bull trap as they have no concrete pivotal level or any technical element to hide their stop behind from being hit.
XRP thus sees quite a few bulls being sitting ducks with the largely exposed positions that will get stopped once bears push price action back below the 55-day SMA. Expect to see a quick drop towards $0.40, which means $0.36 is in reach. Should even $0.36 break down, expect the panic mode to arise with heavy selling, and a falling knife toward $0.29 could be the possible armageddon scenario.
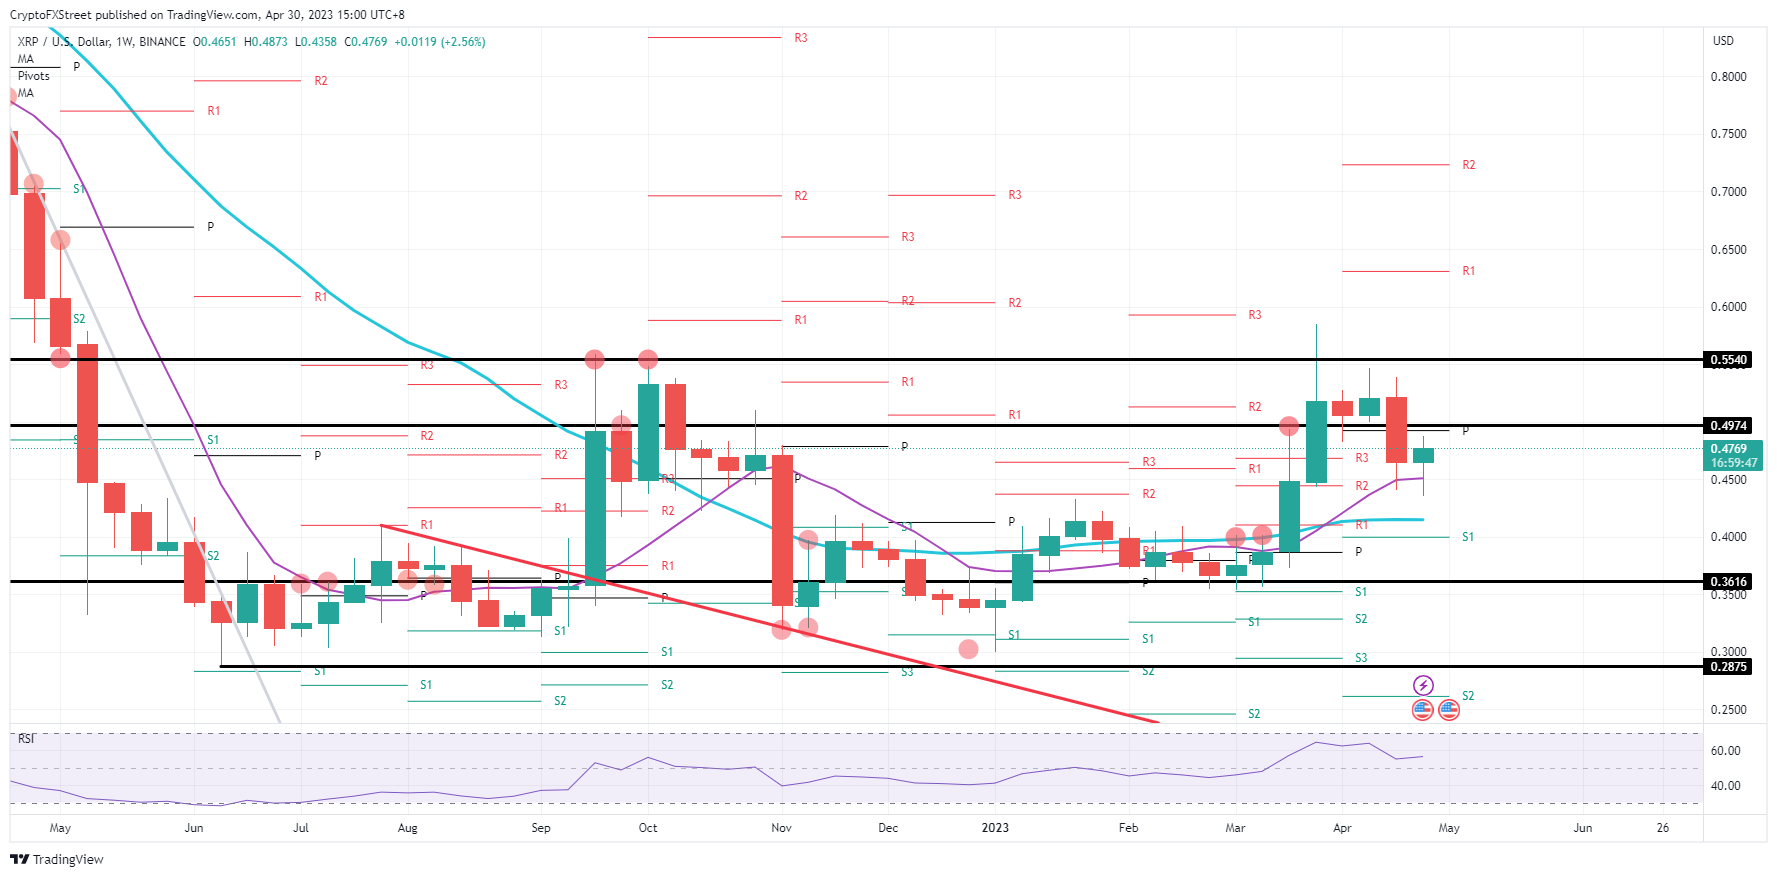
XRP/USD weekly chart
To confirm a recovery that is viable and could be the turnaround after the small correction, XRP needs to head above $0.50 again. That would signal to the markets that bulls have taken over the steering wheel again and that a rejection against $0.50 was avoided. Next week $0.55 would get under pressure for a break higher and might see briefly $0.60 when peaking.
Full Article
Unbearable selling pressure could see Binance Coin tank between 10% and 20% next week
308918 April 30, 2023 16:29 FXStreet Market News
- Binance Coin’s price to close this week is in the red, making it the second week in a row with a loss.
- BNB sees consolidation unfolding with a lower high and higher low.
- Expect to see a slide between 10% and 20% once support breaks down next week.
Binance Coin (BNB) price sees its longer-term rally starting to roll over as, for a third week in a row, the support element pushing price action needs to step in. This indicates more pressure building on the 55-day Simple Moving Average (SMA), which could soon snap under selling pressure. Expect, when that happens next week, to see the drop halt either near 10% or 20%, depending on the severity of the selloff.
Binance Coin price first consolidation, then the slide
Binance Coin price is set to tank into next week as this week is pointing to a consolidation phase. Buyers and sellers are being pushed toward one another as from both sides, pressure is building. With lower highs and higher lows, a breakout moment is set to unfold, and in this case, it could break the support at the 55-day SMA near $318.
BNB will see this scenario unfold because the trend is starting to shift, and in the past few weeks, two red candles were always followed with a sharp selloff. This means that once the 55-day SMA has been broken, another leg lower would mean that BNB trades near $300 at the 200-day SMA. In case that same 200-day SMA snaps, an accelerated selloff could be seen toward $257 as a pivotal level that was well respected in the fall of 2022.
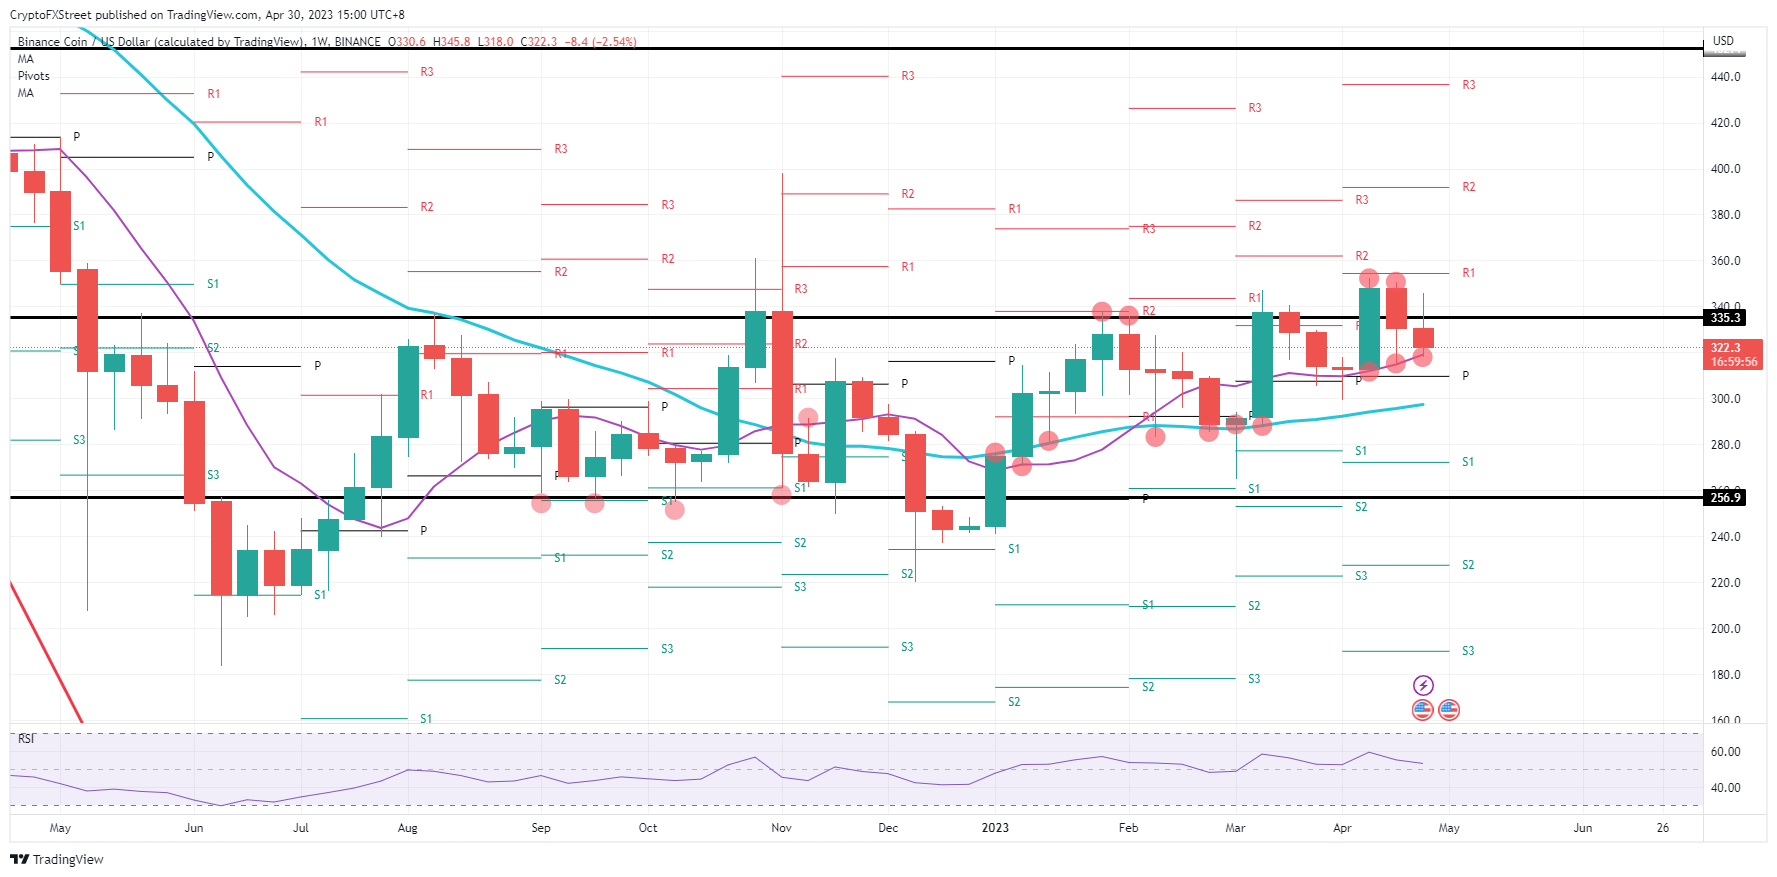
BNB/USD weekly chart
The 55-day SMA could still simply underpin price action and catalyze a bounce higher quickly. In order to do so, at least the high of last week needs to be broken. This means that Binance Coin price will test the peak of early April near $353 and could be set to pop higher.
Full Article
China NBS Manufacturing PMI came in at 49.2 below forecasts (51.4) in April
308917 April 30, 2023 09:33 FXStreet Market News
Information on these pages contains forward-looking statements that involve risks and uncertainties. Markets and instruments profiled on this page are for informational purposes only and should not in any way come across as a recommendation to buy or sell in these assets. You should do your own thorough research before making any investment decisions. FXStreet does not in any way guarantee that this information is free from mistakes, errors, or material misstatements. It also does not guarantee that this information is of a timely nature. Investing in Open Markets involves a great deal of risk, including the loss of all or a portion of your investment, as well as emotional distress. All risks, losses and costs associated with investing, including total loss of principal, are your responsibility. The views and opinions expressed in this article are those of the authors and do not necessarily reflect the official policy or position of FXStreet nor its advertisers. The author will not be held responsible for information that is found at the end of links posted on this page.
If not otherwise explicitly mentioned in the body of the article, at the time of writing, the author has no position in any stock mentioned in this article and no business relationship with any company mentioned. The author has not received compensation for writing this article, other than from FXStreet.
FXStreet and the author do not provide personalized recommendations. The author makes no representations as to the accuracy, completeness, or suitability of this information. FXStreet and the author will not be liable for any errors, omissions or any losses, injuries or damages arising from this information and its display or use. Errors and omissions excepted.
The author and FXStreet are not registered investment advisors and nothing in this article is intended to be investment advice.
Full Article
China Non-Manufacturing PMI came in at 56.4, above forecasts (50.4) in April
308916 April 30, 2023 09:33 FXStreet Market News
Information on these pages contains forward-looking statements that involve risks and uncertainties. Markets and instruments profiled on this page are for informational purposes only and should not in any way come across as a recommendation to buy or sell in these assets. You should do your own thorough research before making any investment decisions. FXStreet does not in any way guarantee that this information is free from mistakes, errors, or material misstatements. It also does not guarantee that this information is of a timely nature. Investing in Open Markets involves a great deal of risk, including the loss of all or a portion of your investment, as well as emotional distress. All risks, losses and costs associated with investing, including total loss of principal, are your responsibility. The views and opinions expressed in this article are those of the authors and do not necessarily reflect the official policy or position of FXStreet nor its advertisers. The author will not be held responsible for information that is found at the end of links posted on this page.
If not otherwise explicitly mentioned in the body of the article, at the time of writing, the author has no position in any stock mentioned in this article and no business relationship with any company mentioned. The author has not received compensation for writing this article, other than from FXStreet.
FXStreet and the author do not provide personalized recommendations. The author makes no representations as to the accuracy, completeness, or suitability of this information. FXStreet and the author will not be liable for any errors, omissions or any losses, injuries or damages arising from this information and its display or use. Errors and omissions excepted.
The author and FXStreet are not registered investment advisors and nothing in this article is intended to be investment advice.
Full Article
First Republic auction underway. Deal seen before markets reopen
308915 April 30, 2023 03:26 Forexlive Latest News Market News
The US FDIC is holding a auction of the assets of First Republic Bank this weekend, according to a Reuters report. There are roughly six bidders for the assets, including a bid from JPMorgan.
The report says bidders were asked for non-binding bids Friday and will be studying FRC’s books over the weekend.
A deal is expected before Asian markets open.
In all likelihood a wind down of the bank will allow markets to move on but there’s also the risk that it sparks fears elsewhere or triggers trouble at another bank.
Full Article
Do not be fooled by Bitcoin price as the weekly chart shows signs of descent with still 25% to go
308913 April 29, 2023 23:21 FXStreet Market News
- Bitcoin price to close out the week in the green.
- BTC however saw bulls unable to hold $30,000 and is fading further into the weekend.
- With a declining pattern on the chart, next week will be vital as a sharp drop of 25% could be in the prospect for May.
Bitcoin (BTC) price could become proof of the general wisdom rule in financial markets that is known as the proverb “Sell in May and walk away.” Looking at the candle stick formation from the past two weeks and adding this week’s performance, it could spell trouble ahead. With lower highs and lower lows, the peak of April is fading and might see Bitcoin selling off in May towards $22,000.
Bitcoin price to embody the financial proverb “sell in May and walk away”
Bitcoin price must have had bulls all excited earlier this week as BTC popped back above $30,000. Unfortunately, that good news quickly got forgotten as later in the week, BTC faded and started to say goodbye to the level by nearing the lower end of $29,000. As such still nothing to worry about, except that the weekly chart reveals a clear bearish trend with lower lows and lower highs, confirming that bears are at work here.
BTC has one element that could be crucial going forward: the 55-day Simple Moving Average (SMA) that caught the decline during the week near$27,060. Once Bitcoin price starts to make lower lows next week, it will be clear that the 55-day SMA support was short-lived, and the decline is set to continue. Traders must brace themselves for a selloff that could go as far as $22,000 to find support near the 200-day SMA and drag Bitcoin price 25% for the month of May.
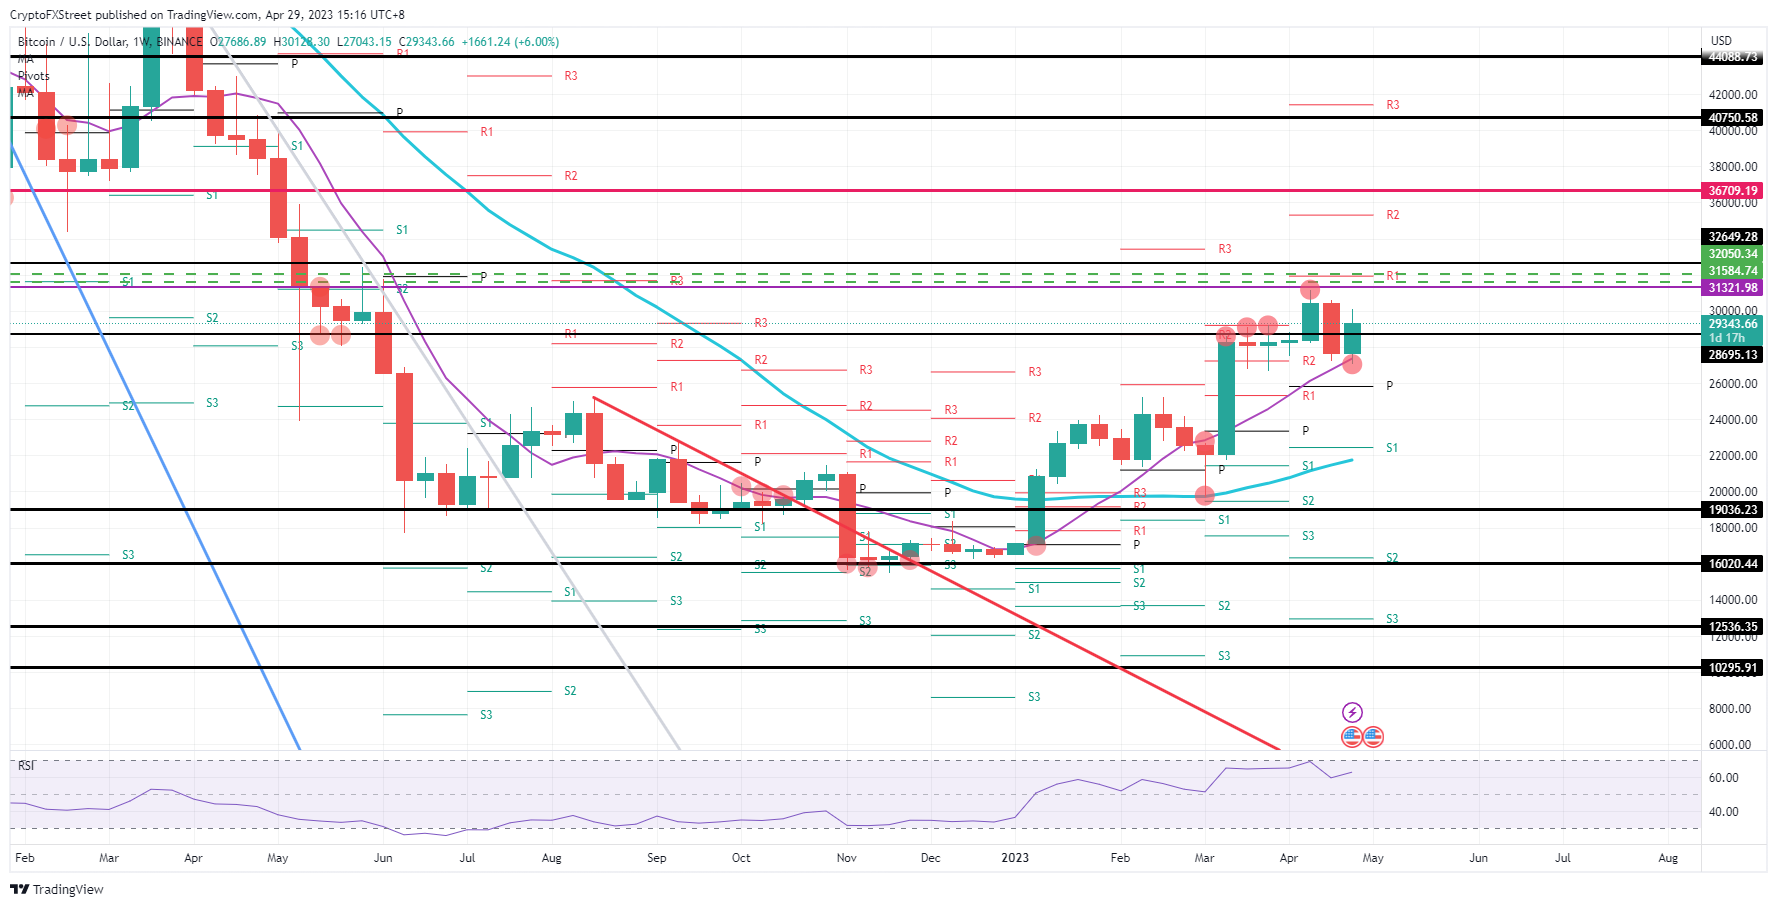
BTC/USD weekly chart
The simple three-week pattern could still get broken or erased when bulls can break back above $30,000. Ideally, the high of last week, near $30,580, needs to get broken to the upside in order to break this pattern and avoid a double-top formation. From there, it is only a sigh to head to $31,321 and enter a distribution zone that might alleviate Bitcoin price towards $33,000 by the summer.
Full Article
Solana price to add 25% value as bulls are buying every dip in sight
308911 April 29, 2023 20:51 FXStreet Market News
- Solana price paints a bullish picture after this week’s performance.
- SOL rallies 25% as bulls are overshadowing bears in the price action.
- Expect to see a test and possible break higher in May above $27.
Solana (SOL) price is bound to head higher as its liftoff this week was a huge success as three rocket engines fuel the move higher. Those rocket engines come in the form of three technical levels that have seen substantial buying and are fueling the current uprising with more to come. Expect to see at least a test near $27 in May and add 25% of value to the current SOL price action.
Solana price shows great technical respect for levels
Solana price has seen this week three key levels that are massively important to have this rally ending successfully near $27 as profit level. The first and second support comes from the monthly pivot together with the 200-day Simple Moving Average (SMA) near $20.50. Both underpinned the price action so firmly that bulls had a massive amount of orders around that level to get filled and go all-in for that long position in SOL.
SOL offered a window of opportunity even for bulls that were late to the party with great respect for the 55-day SMA near $21.50. All added up, bulls had three firm reasons why price action in SOL would only go one way, which is up. Expect from here a firm rally towards $27 for next week and revalue Solana 25% higher.
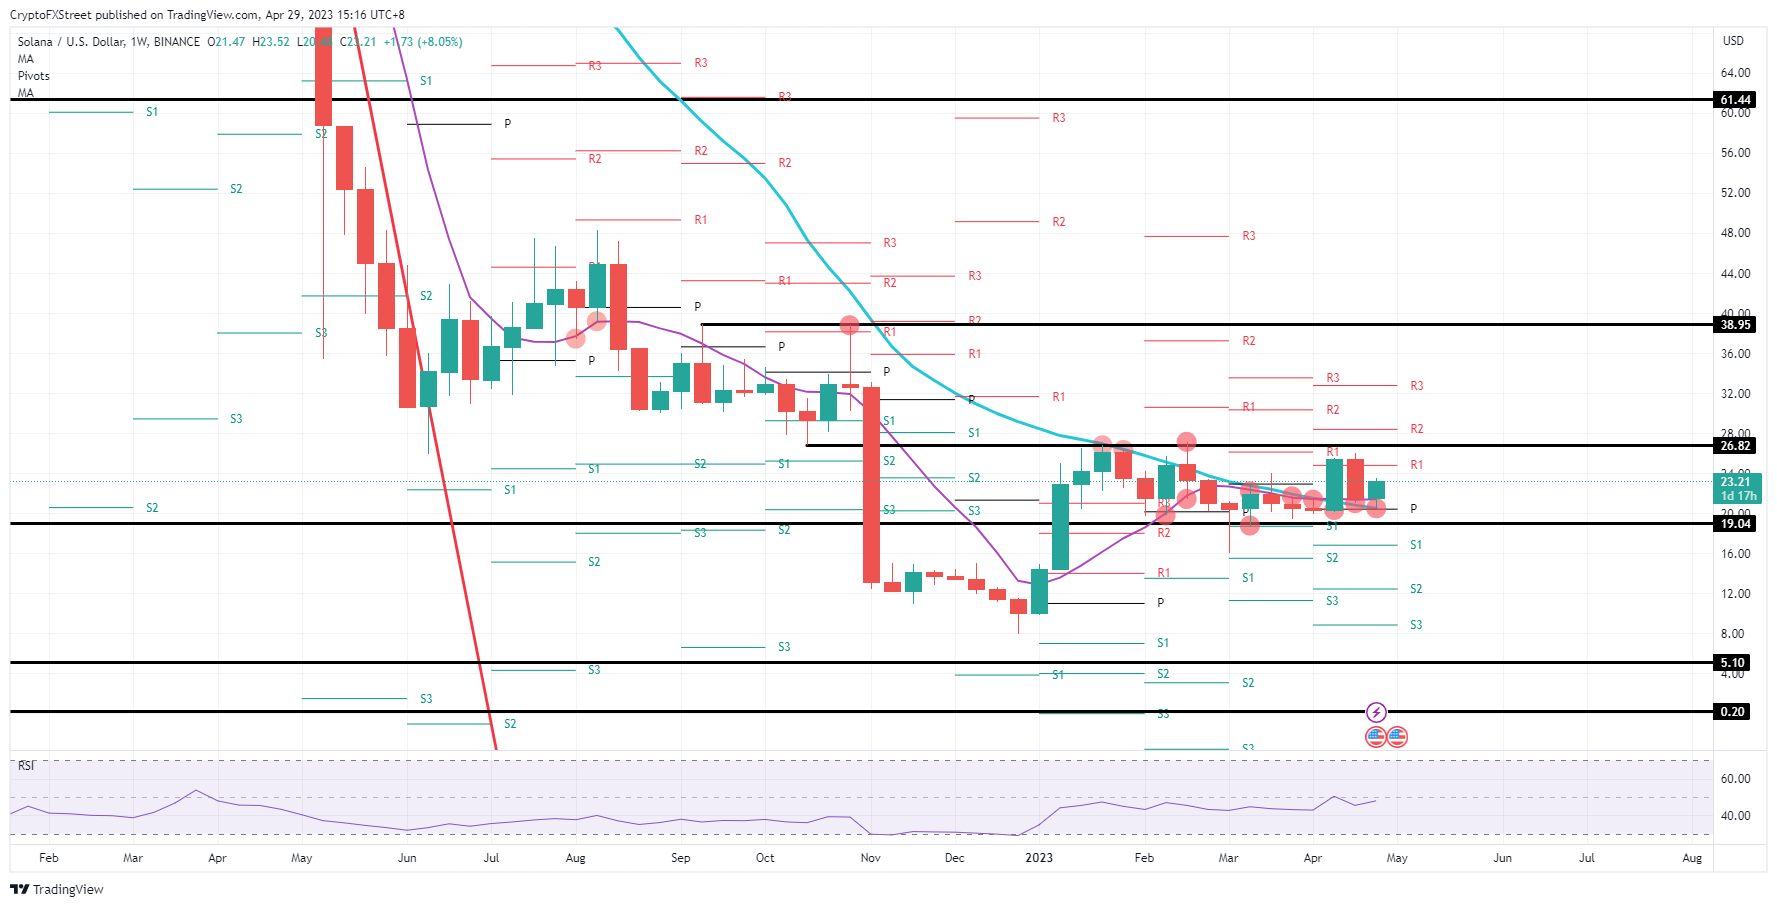
SOL/USD weekly chart
Solana price could start to crack as bulls have clearly defined and aligned where they have entered. This makes those levels a target for bears to price action underneath. Certainly, when that monthly pivot and the 55-day SMA start to crack with prices printing below $20.50, that means a lot of traders from bulls are starting to turn into red numbers. Once the mass hysteria starts, SOL will get swamped with sell orders and could even see a breach below $19 and a leg lower to $16.
Full Article
Shiba Inu price likely to trap investors with false breakouts, 20% plummet on the horizon
308909 April 29, 2023 18:45 FXStreet Market News
- Shiba Inu price is torn up between bears and bulls.
- SHIB triggered a false break lower and a false break higher with nearly a firm topside rejection.
- Expect to see another leg lower once bulls start to vacate the premises, as SHIB is not projecting a stable rally higher anytime soon.
Shiba Inu (SHIB) price is not painting a pretty picture as clearly investors and traders are looking for some guidance in terms of direction. This week alone, traders had to withstand a false break to the downside, and a false break to the upside and see bulls barely holding support near the crucial $0.00001000 pivotal level. More and more bearish elements are coming in from above, and with the 55-day Simple Moving Average (SMA) heading on its way to form a death cross again, a 20% implosion looks to be unfolding in May.
Shiba Inu’s price has disappointed investors
Shiba Inu’s price is set to head on a ride lower after investors are starting to question whether it pays off to still participate in its price action. This week certainly has triggered some red alerts as SHIB broke below $0.00001000 on a false break, next broke higher above the 200-day SMA with again a false break and is not respecting any support or resistance nearby. Expect disappointed traders and investors to start exiting their positions and wait for some more stable trading conditions.
SHIB might still hold that $0.00001000 while it has been clearly breached earlier this week. This makes the support and importance it used to hold less relevant. Expect to see price action advance into negative territory further and head towards $0.00000820 to flirt with the lows of December and June last year.
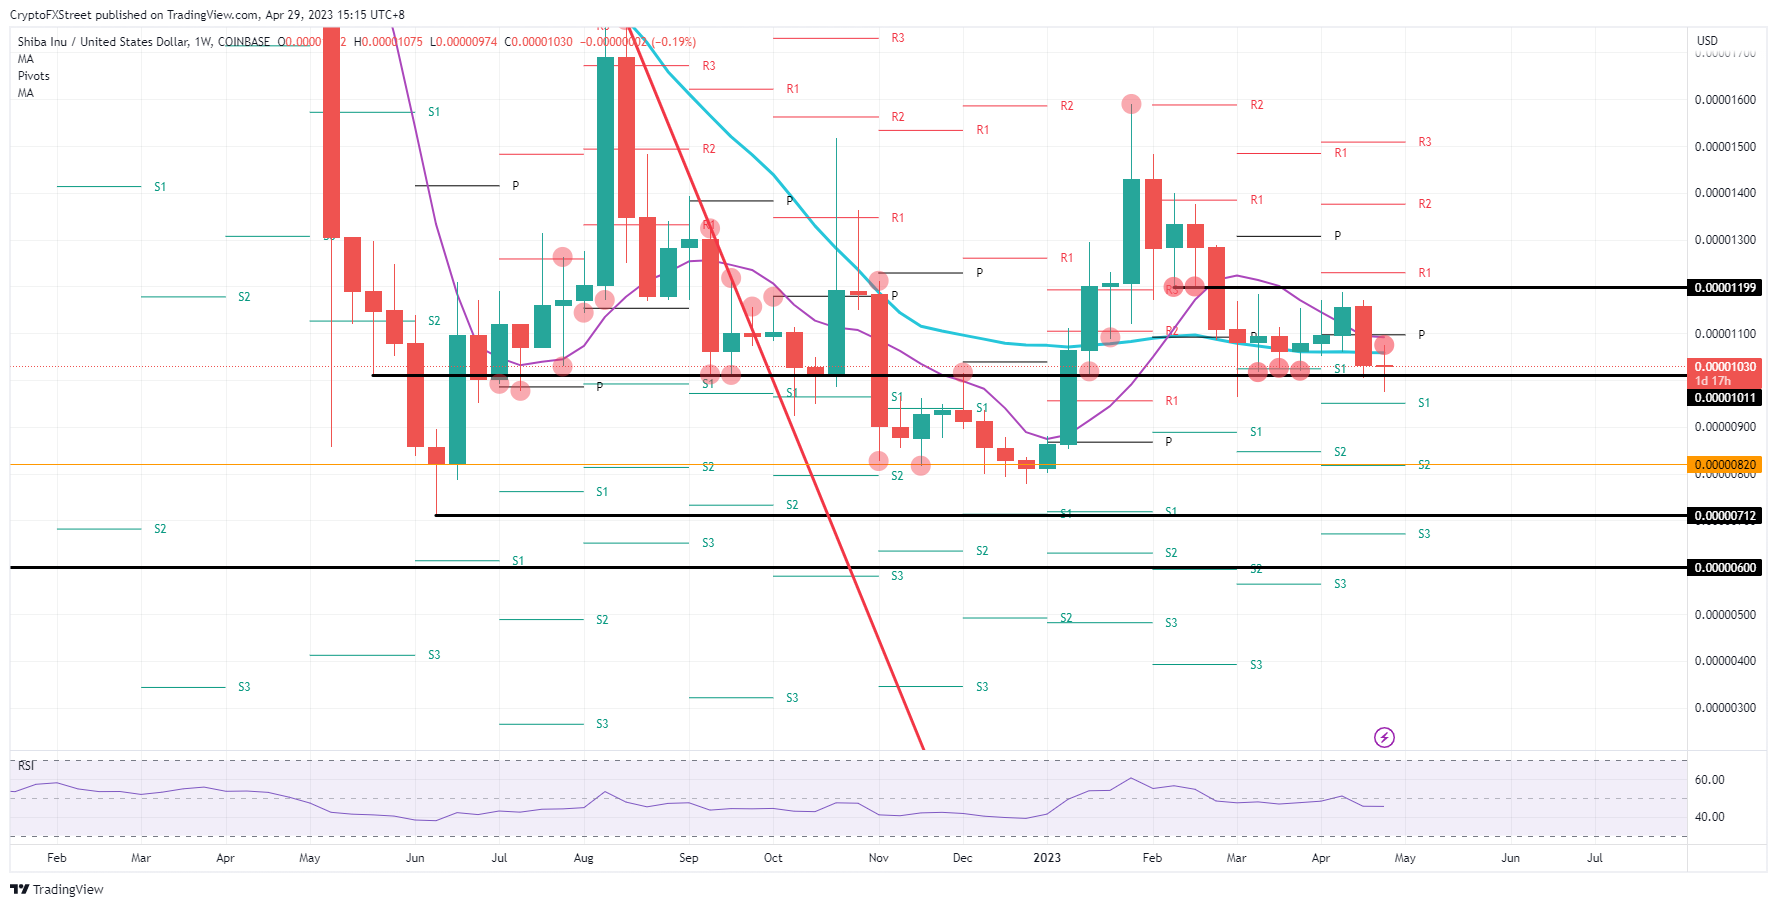
SHIB/USD weekly chart
One nearby element that could be seen creating some momentum for a turnaround is the monthly S1 support near $0.00000950. Together with the bottom from March, it would make an ideal floor and could see price action being underpinned in that area. Confirmation would come from a turnaround once $0.00001000 gets reclaimed and favorably continues its rally toward and above $0.00001100.
Full Article
Litecoin price risks declining 15% as recovery is not going according to plan
308907 April 29, 2023 16:35 FXStreet Market News
- Litecoin price is still on its recovery path after the 13% knockout punch from bears last week.
- LTC sees its recovery not going to plan as another rejection is unfolding.
- Although this week might still close in the green, another decline is just around the corner.
Litecoin (LTC) price sees bulls recovering and trying to bounce back after the firm selloff from the previous week that bore a 13% loss. There was a firm recovery plan set forward that required bulls to at least jump back above $94.43. It looks like the Bulls will drop the ball on that plan and instead are risking another rejection for this week that could see another leg lower if pressure on the bottom side grows too big for the Bulls to bear.
Litecoin price, though underpinned, sees pressure building for a break lower
Litecoin price, even this week, sees its price action nicely underpinned with the floor at the monthly pivot near $85. That is as far as the good news goes, as the Bulls might have played their hand here by defending it so strongly. What would have been better was that Litecoin price broke above $95.43 and confirmed the recovery bounce it was going for.
LTC bulls are exposing themselves for another rejection as $94.43 remains unchallenged and could be seen as the second rejection after the one from last week at $104. With lower highs and flat bottom at $85, bears have a clear target where they want to push LTC price toward. Expect next week, pressure to keep building, and when $85 gives way, a quick $5 could be selling off towards $80 and test the 200-day Simple Moving Avreage for support.

LTC/USD weekly chart
The recovery could be put on hold and see smaller increments of recovery in the coming weeks. That means a very slow grind higher towards $94.43 for a test and break higher. Next up, of course, would be $104 for a third test and a possible successful break higher this time.
Full Article