Monday 18th January: Weekly Technical Outlook and Review

Key risk events today:
China GDP q/y; BOE Gov Bailey Speaks.
(Previous analysis as well as outside sources – italics).
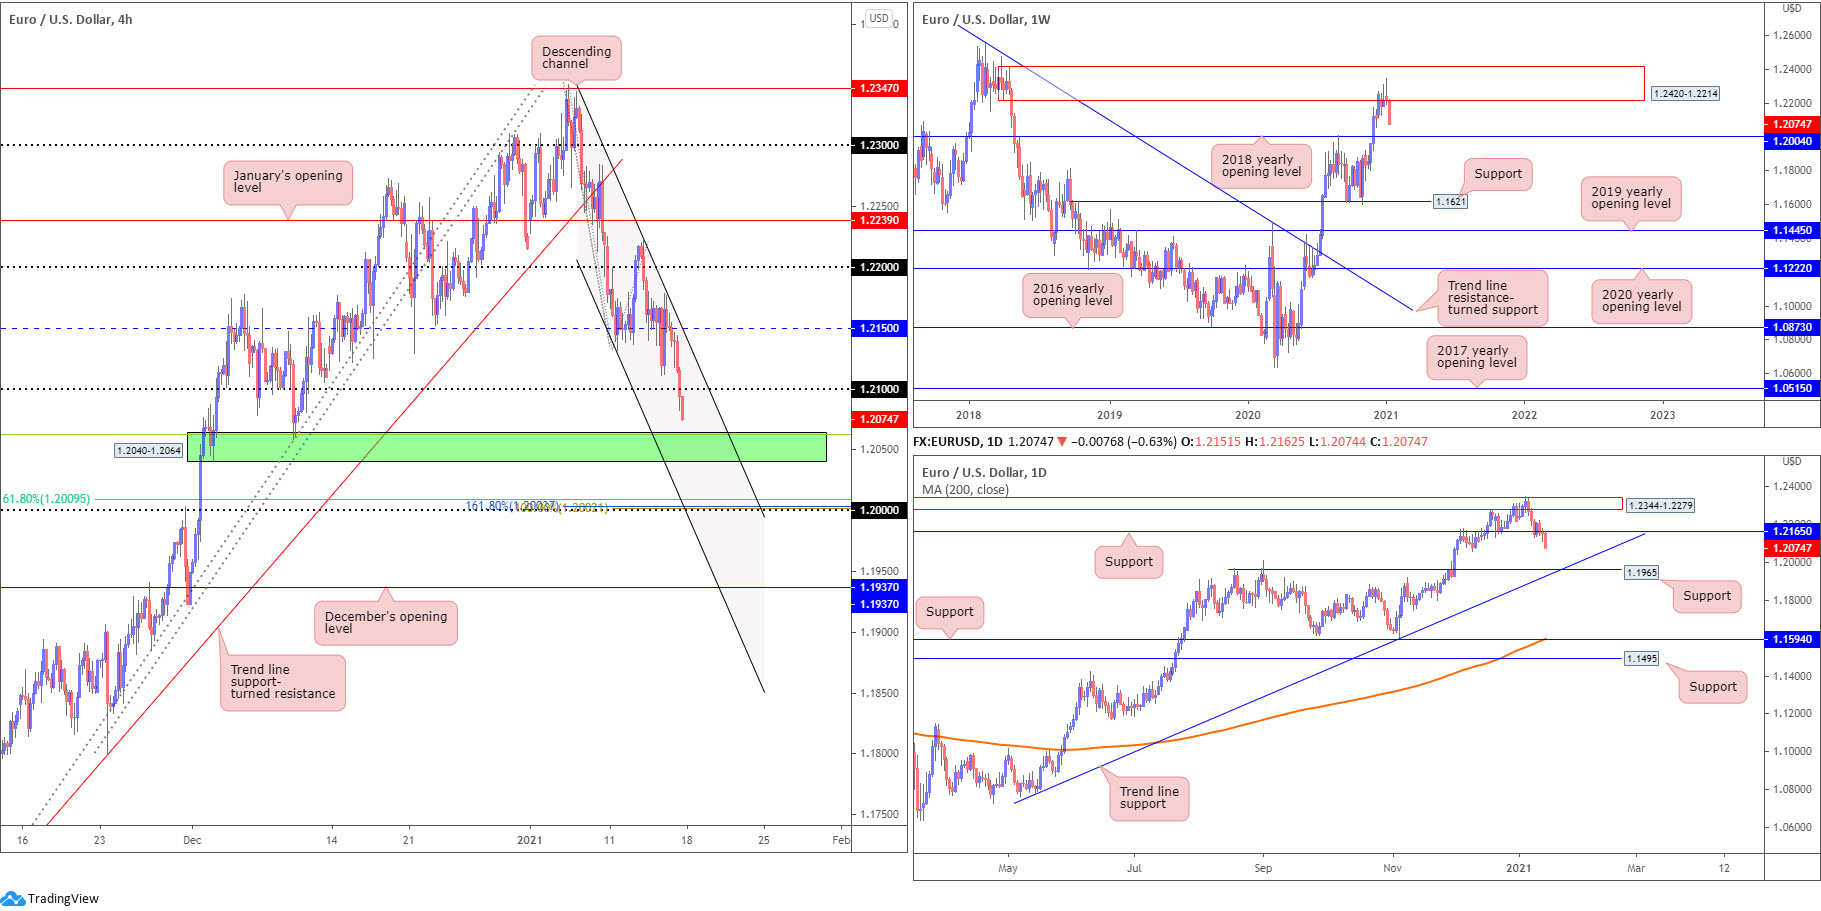
EUR/USD:
Weekly gain/loss: -1.18%
Weekly close: 1.2074
Weekly perspective:
Supply at 1.2420-1.2214 remains central focus on the weekly scale.
As you can see, the prior week’s session also established a shooting star pattern off multi-month peaks at 1.2349, with last week’s action following through to the downside and closing at session lows.
A sustained bearish spirit this week places the 2018 yearly opening value at 1.2004 on the hit list.
In terms of trend, upside has remained favoured since bottoming at 1.0637 in March 2020. For that reason, longer-term dip-buying could surface from 1.2004 if tested.
Daily perspective:
Buying levelled off at supply drawn from 1.2344-1.2279 the prior week—nestled within the walls of weekly supply mentioned above at 1.2420-1.2214—and led EUR/USD to support at 1.2165 in recent days.
Efforts to reach higher levels from the aforementioned support flatlined Friday, consequently shining the technical spotlight on support at 1.1965, and trend line support, taken from the low 1.0774.
The 1.2165 breach also helps add bearish conviction from the weekly timeframe’s supply zone.
H4 perspective:
Friday was mostly a one-sided market, accelerating through 1.2150 and 1.21 bids.
Demand (green) at 1.2040-1.2064 and connecting 38.2% Fibonacci retracement ratio at 1.2062 (green line), therefore, are within touching distance this week.
Extending lower throws the key figure 1.20 in the mix as a possible support, conveniently dovetailing with a 61.8% Fibonacci retracement ratio at 1.2009 (as well as a 100.00% Fibonacci extension point at 1.2002 and a 161.8% Fibonacci projection point at 1.2003). In addition, channel support resides close by, extended from the low 1.2132.
Areas of consideration:
- The 2018 yearly opening value at 1.2004 plotted on the weekly scale. As a reminder, the trend in this market has also faced an upward trajectory since early 2020.
- H4 demand at 1.2040-1.2064 and associated 38.2% Fibonacci retracement ratio at 1.2062 may be an area we see buyers defend this week, though eyes are also potentially on the 1.20 key figure.
- The 1.20 level, based on the H4 timeframe. Not only is this value joined by H4 Fibonacci confluence and channel support, weekly support exists at 1.2004.
GBP/USD
Weekly gain/loss: +0.16%
Weekly close: 1.357
Weekly perspective
Briefly spiking to fresh 2021 highs at 1.3711 last week, price action remains north of support at 1.3503. To the upside, resistance at 1.3847 is on the radar, whereas lower on the curve we can see support at 1.3250, the 2020 yearly opening value.
Also of technical interest is the recent engulf of 1.3514 (December 9 [2019] high), helping to confirm the current uptrend (since early 2020)
Daily perspective:
Early week realised a bullish pivot swing point (green arrow) ahead of trend line support, etched from the low 1.1409. However, buyers have since struggled to find grip, leaving resistance at 1.3763 unchallenged.
As a result, eyes will likely remain on the two aforementioned levels this week.
H4 perspective
Amidst a broadly stronger USD, Cable fell sharply Friday, with January’s opening value at 1.3646 and the 1.36 figure doing little to turn the dial (provide support). As you can see, price initially tested the waters below 1.36 (green arrow) and failed to rally higher. Therefore, the subsequent H4 close below 1.36 is likely here to stay.
With short-term eyes now south of 1.36, a declining support level is in sight, etched from the high 1.3703. Below, 1.35 is the next notable support, merging with a 38.2% Fibonacci retracement ratio at 1.3510.
Areas of consideration:
- Weekly support at 1.3503 holding, in a market trending higher, places long-term buyers in a favourable position.
- The above, of course, also places any bearish scenario beneath 1.36 in a questionable situation this week. For that reason, buyers could make an appearance off the H4 declining support level. Though a downside test of 1.35 may still also be on the cards.
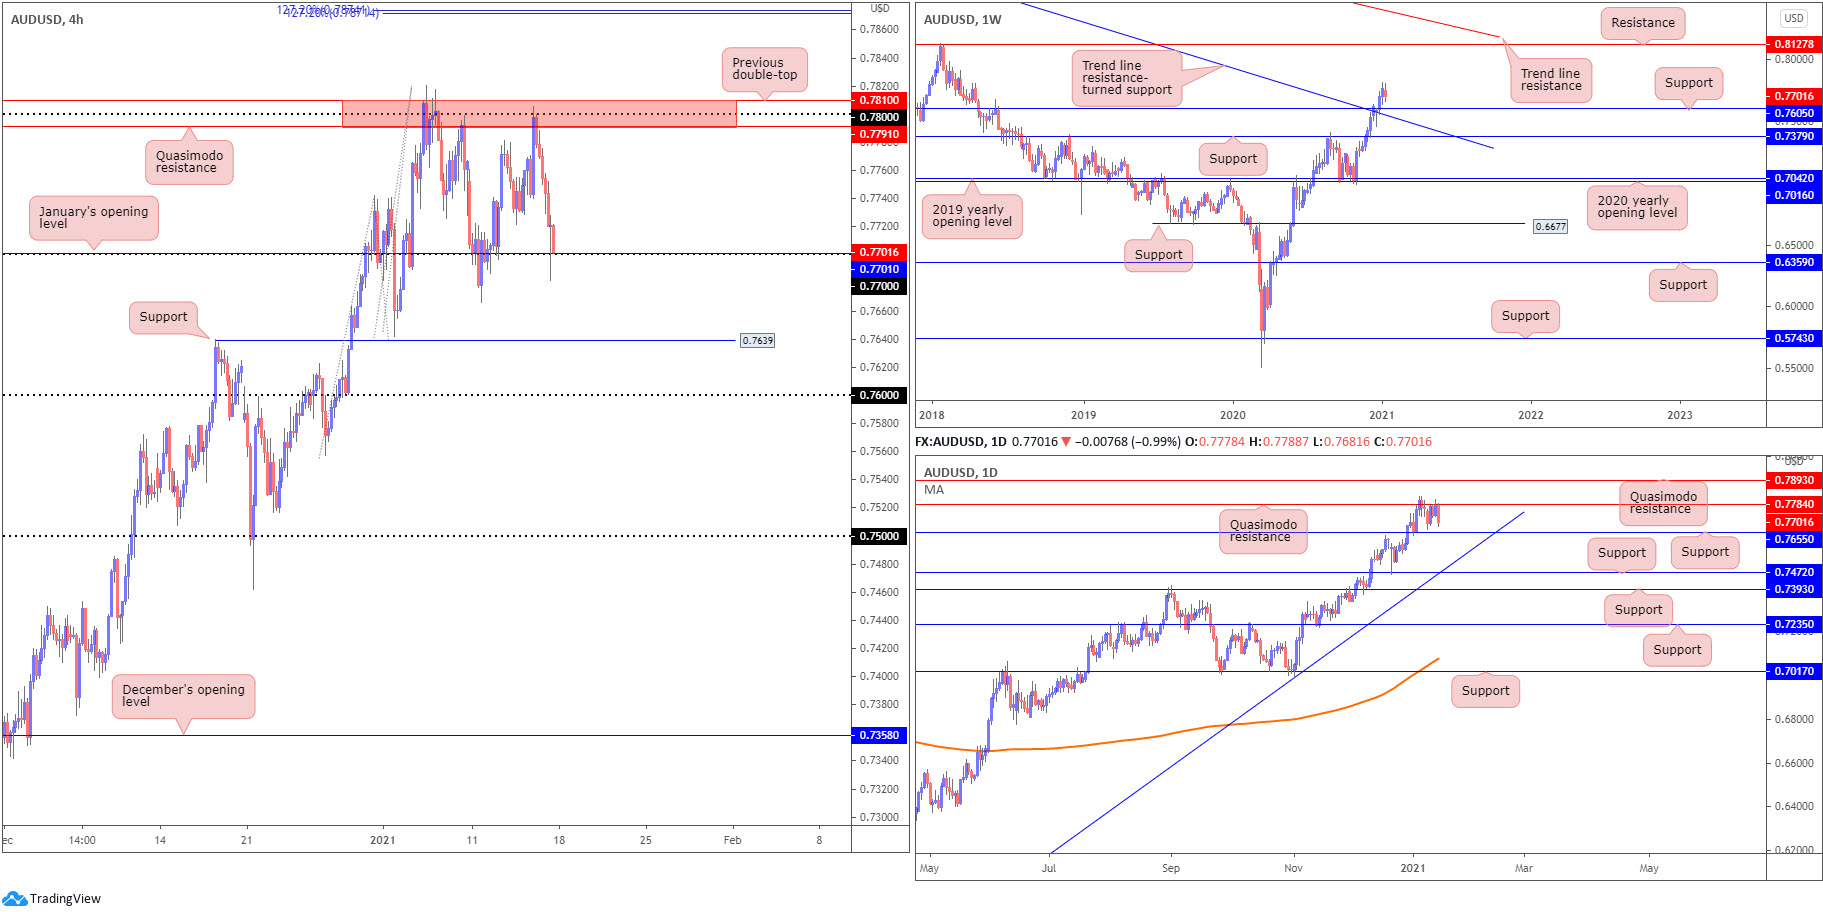
AUD/USD:
Weekly gain/loss: -0.83%
Weekly close: 0.7701
Weekly perspective
AUD/USD produced its first bearish close since mid-November (2020) last week, a touch south of recent 30-month highs at 0.7820
Despite modest losses, the pair’s future looks bright.
Late 2020 saw price glide through Quasimodo resistance at 0.7605 (now serving support) and trend line resistance, taken from the high 1.1065. This not only helps confirm the current uptrend, it also places buyers in a strong position with room to possibly reach as far north as resistance at 0.8127 over the coming month
Daily perspective:
One of the technical factors behind last week’s loss is Quasimodo resistance stationed at 0.7784 (extended from March 2018), a level that’s proven stubborn to overcome.
North of 0.7784, traders are likely looking towards another Quasimodo resistance level at 0.7893 (from February 2018).
Support, however, remains positioned at 0.7655 (clear history since November 2017).
H4 perspective:
Since early January, H4 has been carving out a consolidation
Resistance at 0.7810/0.7791 (red)—an area formed from a previous double-top pattern, a Quasimodo resistance and the 0.78 figure—continues to cap upside. Downside support is seen at the 0.77 figure and January’s opening value taken from 0.7701.
External levels to be aware of are support coming in at 0.7639 (December 17 swing high), and a Fibonacci projection area at around 0.7873, fixed just south of the daily Quasimodo resistance highlighted above at 0.7893.
Areas of consideration:
- The H4 consolidation between 0.7810/0.7791 and 0.77 could attract range traders looking to fade range extremes early week.
- Seemingly weak daily Quasimodo resistance at 0.7784, coupled with a strong underlying trend, could eventually lift AUD/USD above 0.78, targeting the Fibonacci projection area at around 0.7873 on the H4, followed by daily Quasimodo resistance parked at 0.7893.
USD/JPY:
Weekly gain/loss: -0.13%
Weekly close: 103.82
Weekly perspective:
Since connecting with the underside of weekly supply at 108.16-106.88 in August (2020), price has gradually shifted lower and developed a weekly declining wedge (106.94/104.18).
Price, as you can see, shook hands with the upper edge of the declining wedge pattern last week. With room to press lower, this may see traders zone in on Quasimodo support at 102.55.
Beneath 102.55, support calls at 100.61, a level in play since 2013.
Daily perspective:
Action out of the daily timeframe recently crossed swords with trend line resistance, extended from the high 111.71, and heading into the second half of last week formed back-to-back indecisive candles. Traders may acknowledge the aforementioned trend line converges with the upper edge of the weekly declining wedge.
Downside support resides around the upper boundary of a recently penetrated declining wedge, taken from the high 105.67.
H4 perspective:
Thursday’s 104 retest saw price action challenge space ahead of Wednesday’s trough at 103.52, with Friday’s movement exhibiting a restricted stance, albeit ending the session off worst levels.
104 remains a clear resistance to the upside, while drilling through 103.52 shines the spotlight on January’s opening value at 103.06 and 103 figure.
Areas of consideration:
- 104 holding delivers a bearish vibe as we head into a new week. A retest of this level, therefore, may be a welcomed sight for sellers.
- Breaching Wednesday’s low at 103.52 (on the H4) may induce further selling this week, targeting the upper boundary of the penetrated declining wedge on the daily timeframe, followed by January’s opening value at 103.06 and the 103 figure (H4).
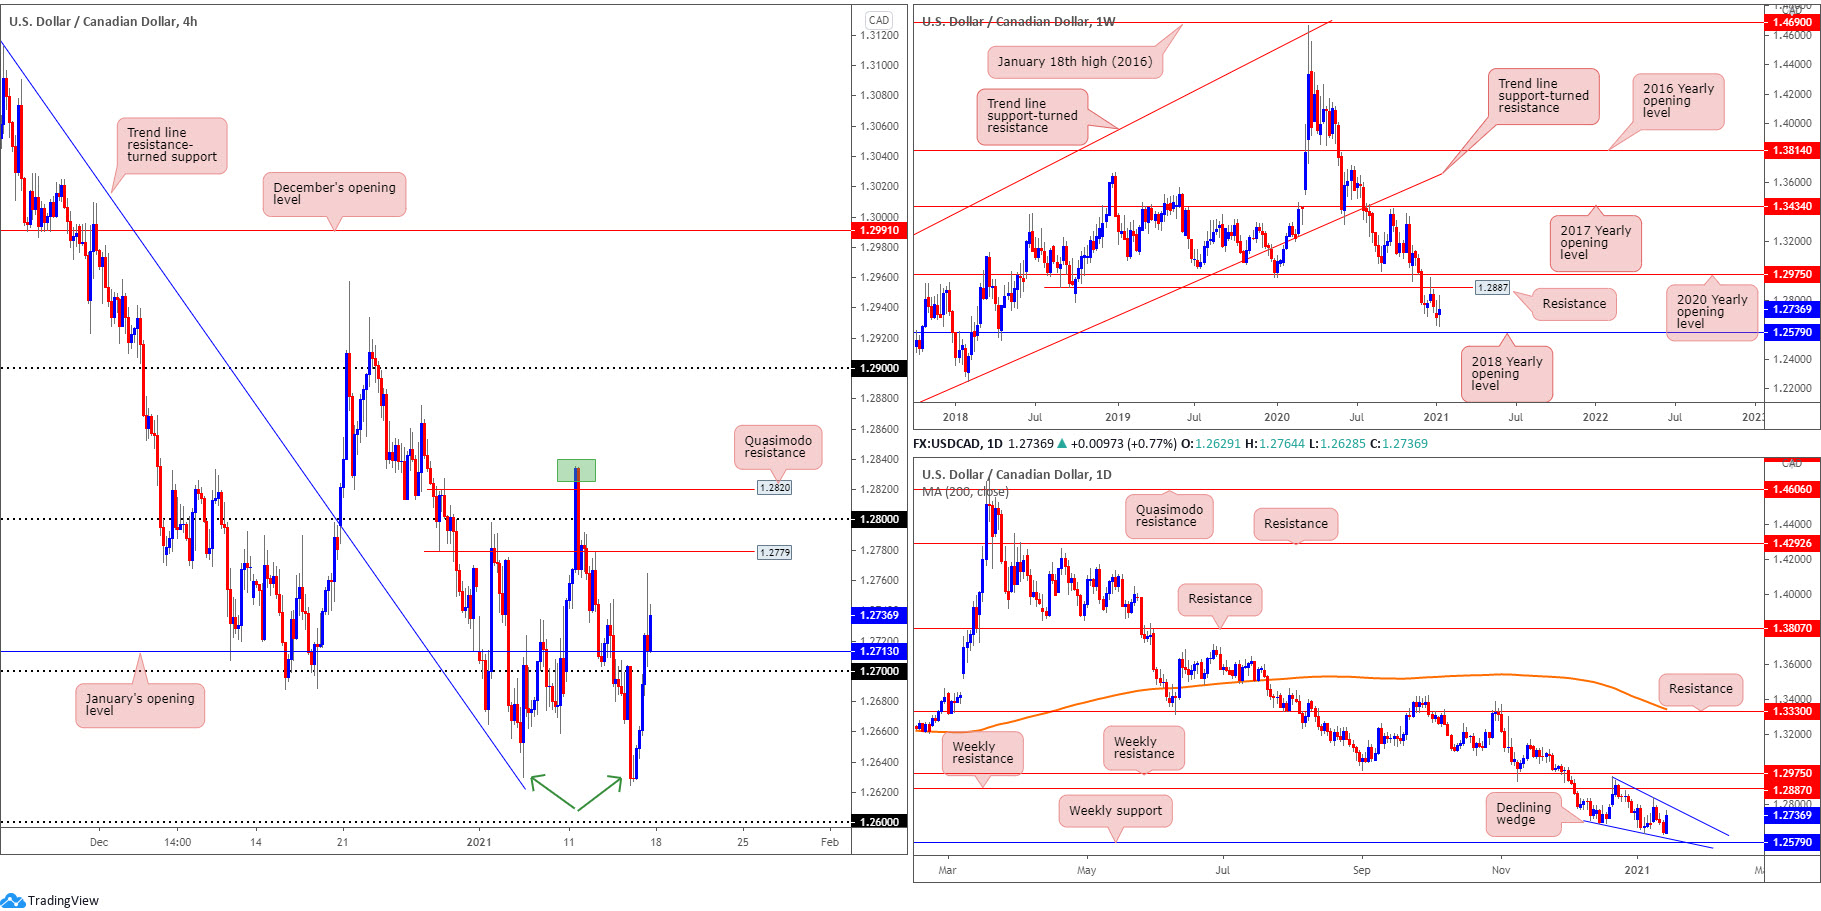
USD/CAD:
Weekly gain/loss: +0.41%
Weekly close: 1.2736
Weekly perspective:
Early December obliterated the 2020 yearly opening value at 1.2975 and Quasimodo support at 1.2887. With 1.2887 serving as resistance heading into the close of 2020, this seats the 2018 yearly opening value at 1.2579 in the firing line this week.
Also, it is important to note long-term flow (trend) has been pointing lower since topping in March (2020).
Daily perspective:
Aside from the declining wedge forming on the daily timeframe (1.2957/1.2688), technical structure pretty much resembles that of the weekly timeframe: weekly resistance at 1.2887 and weekly support plotted at 1.2579.
H4 perspective:
WTI trading lower and testing lows of $51.86 a barrel, together with the US dollar index climbing 90.50, took USD/CAD north of the 1.27 figure and January’s opening value at 1.2713 on Friday.
Technically speaking, the recent move also formed the beginnings of a double-bottom pattern off multi-month troughs around the 1.2630 region (green arrows). However, the buy signal is not seen until the pattern’s neckline is breached (green box) at 1.2835.
Additional technical levels to bear in mind are resistance from 1.2779, the 1.28 figure and Quasimodo resistance drawn from 1.2820.
Areas of consideration:
- The declining wedge forming on the daily timeframe is a pattern that may be worth watching this week. A breakout to the upside—a reversal signal—could have buyers test weekly resistance at 1.2887.
- A bullish theme could emerge off 1.27 and January’s opening value at 1.2713, targeting H4 resistances at 1.2779, 1.28 and 1.2820 (an area sellers may look to re-join the current downtrend as it converges with the upper edge of the daily declining wedge pattern).
- Beyond 1.2630 (multi-month low), support targets in view are the 1.26 figure and the 2018 yearly opening value on the weekly timeframe at 1.2579.
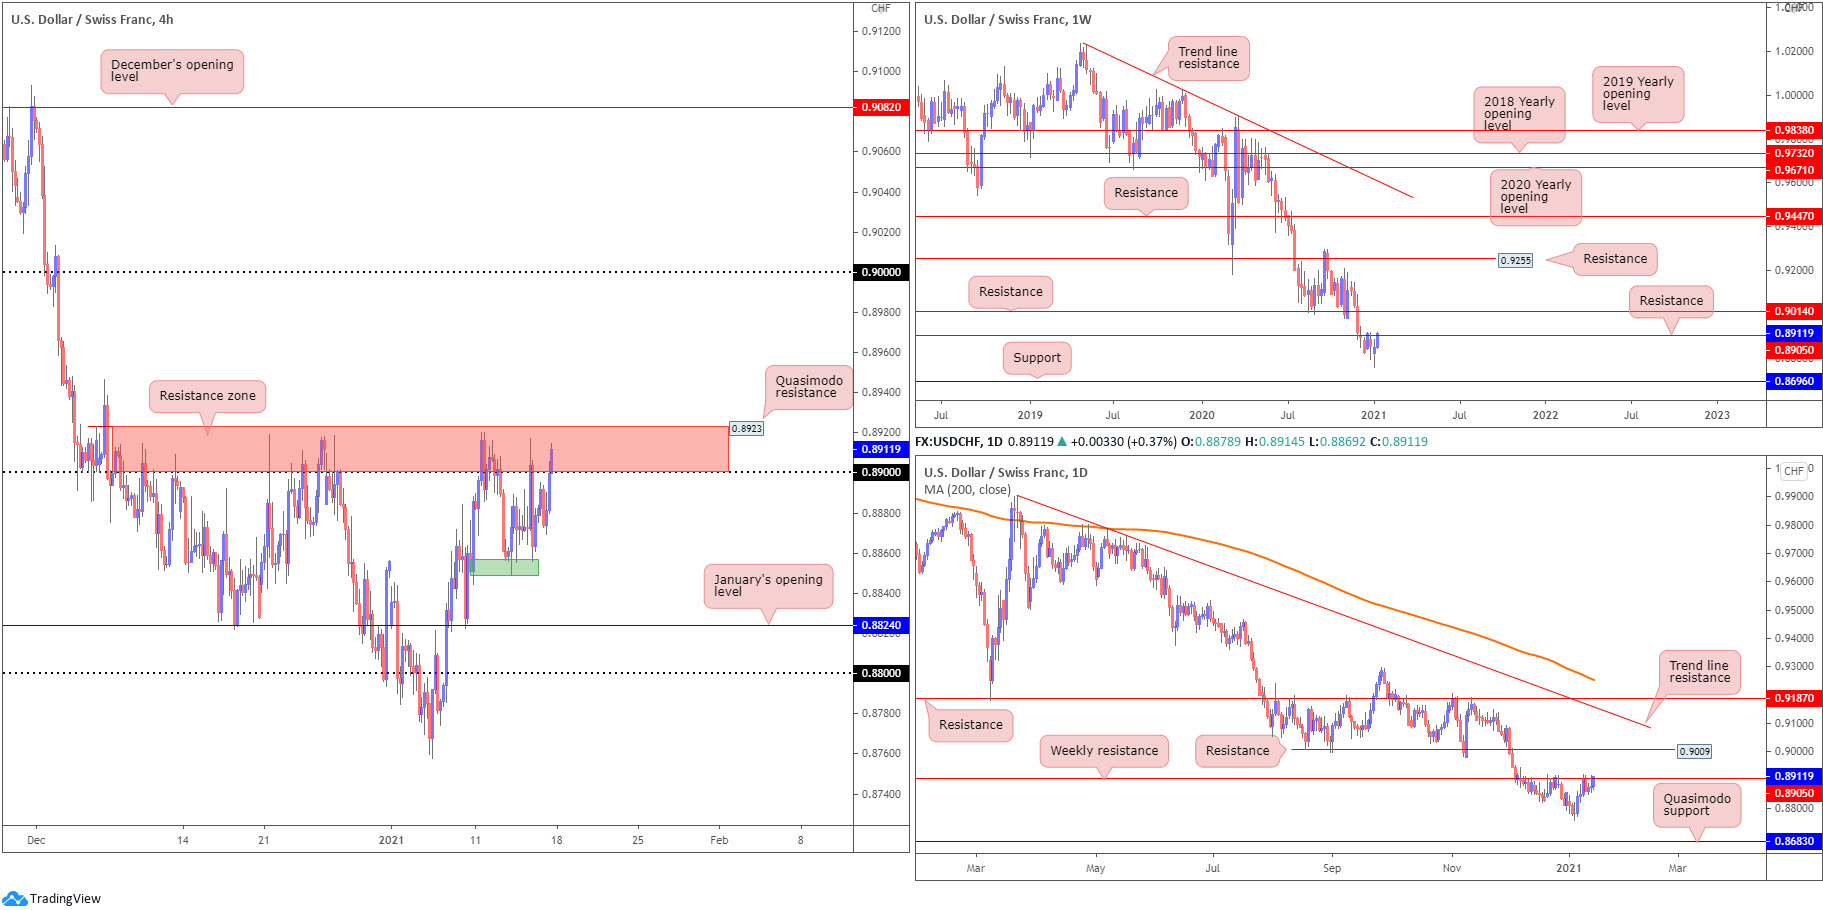
USD/CHF:
Weekly gain/loss: +0.69%
Weekly close: 0.8911
Weekly perspective:
The weekly timeframe shows not only has USD/CHF been entrenched within a downtrend since May 2019, the pair also remains loitering at the underside of resistance drawn from 0.8905.
Because of this, despite modest buying over the past couple of weeks and a mild 0.8905 breach to the upside, sellers could maintain control in the coming weeks.
Support on the weekly timeframe is not expected to make an appearance until 0.8696.
Daily perspective:
Similar to the weekly scale, the daily timeframe reveals weekly resistance at 0.8905 as a prominent base.
However, Quasimodo support at 0.8683 serves as the next downside target on the daily timeframe, situated a touch beneath weekly support at 0.8696.
H4 perspective:
H4 resistance marked between 0.8923 (Quasimodo resistance) and the 0.89 figure (red zone), as you can see, has capped upside since early December.
North of the zone, room to approach the key figure 0.90 is seen, while any bearish move targets local support around 0.8850 (green), as well as January’s opening value from 0.8824 and possibly the 0.88 figure.
Areas of consideration:
- H4 resistance at 0.8923-0.89 is a key base, particularly in early trading this week.
- Having seen all three timeframes (H4, daily and weekly) respect resistance, in a market trending lower since April 2019, sellers could remain at the wheel. Therefore, a bearish scenario forming within H4 resistance at 0.8923-0.89 could be interesting.
- Should H4 buyers form a decisive close above 0.8923, breakout buyers could emerge, targeting 0.90. Conservative players are likely to seek at least a retest at 0.89-0.8923 before pulling the trigger.
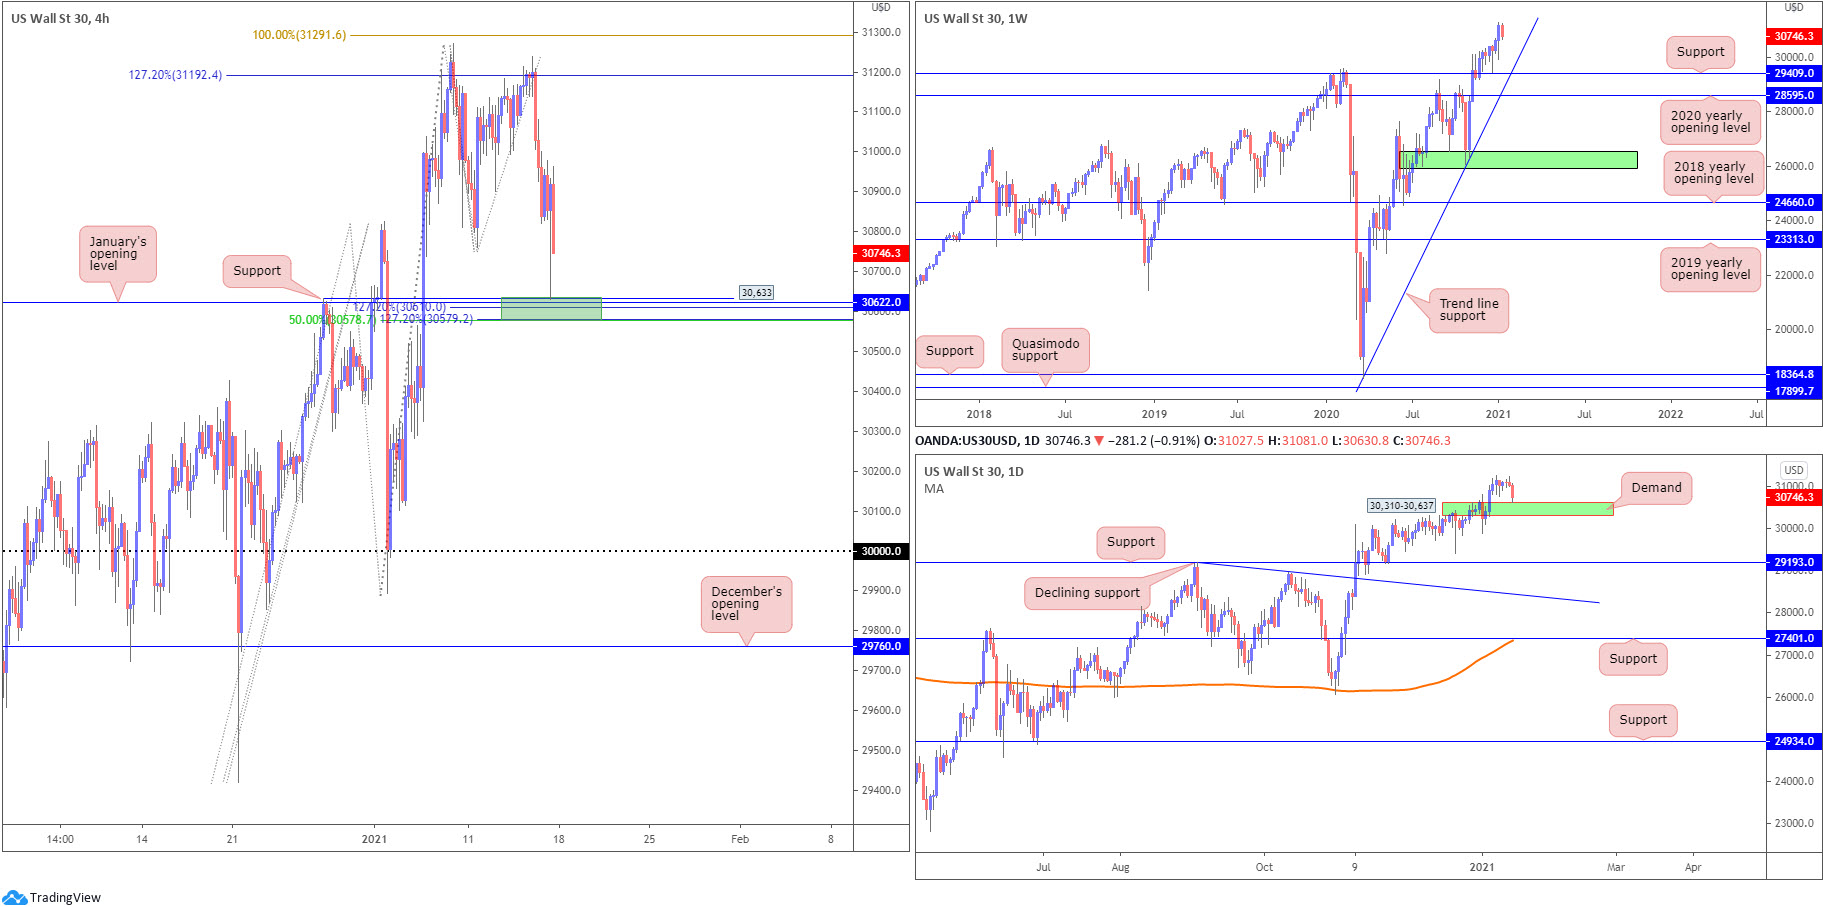
Dow Jones Industrial Average:
Weekly gain/loss: -1.28%
Weekly close: 30,746
Weekly perspective:
Buyers stepped back last week, with price snapping a two-week bullish phase a touch south of 2021 highs at 31,271.
As noted in previous analysis, the research team sees limited floor in sight until trend line support, extended from the low 18,213. Another nearby support to be aware of is 29,409, a previous Quasimodo resistance.
Daily perspective:
Following five consecutive days of tentative price action, the DJIA made contact with demand seen at 30,310-30,637 on Friday.
30,310-30,637 holding this week suggests the benchmark may refresh all-time highs. The demand giving way, on the other hand, could spell trouble for buyers as (obvious) support is not seen until around the 29,193 range.
H4 perspective:
US equities took to lower levels on Friday after US President-elect Biden unveiled his Covid-19 relief plan, in addition to less-than-stellar retail sales for December. The Dow Jones Industrial Average fell 177.26 points, or 0.57%; the S&P 500 dropped 27.29 points, or 0.72% and the Nasdaq declined 114.14 points, or 0.87%.
From a technical standpoint, support at 30,633 entered the fight Friday. Confluence surrounding this level is impressive. January’s opening value is seen at 30,622, while a touch beneath we can see a Fibonacci support zone present around 30,578-30,610.
A rebound from 30,633 could reignite Fibonacci resistance (127.2% Fibonacci projection point at 31,192/100% Fibonacci extension point at 31,291) this week, though a push beneath 30,578-30,610 potentially swings the technical pendulum in favour of reaching 30,000.
Areas of consideration:
- H4 support at 30,633, along with January’s opening value at 30,622 and Fibonacci support around 30,578-30,610. What’s interesting is this H4 technical support area converges with daily demand at 30,310-30,637.
- Below 30,578, sellers could take over this week, targeting 30,000 on the H4, though this would entail taking out daily demand.
- A H4 breakout above 31,291 potentially fuels a bullish breakout theme to refresh all-time peaks.
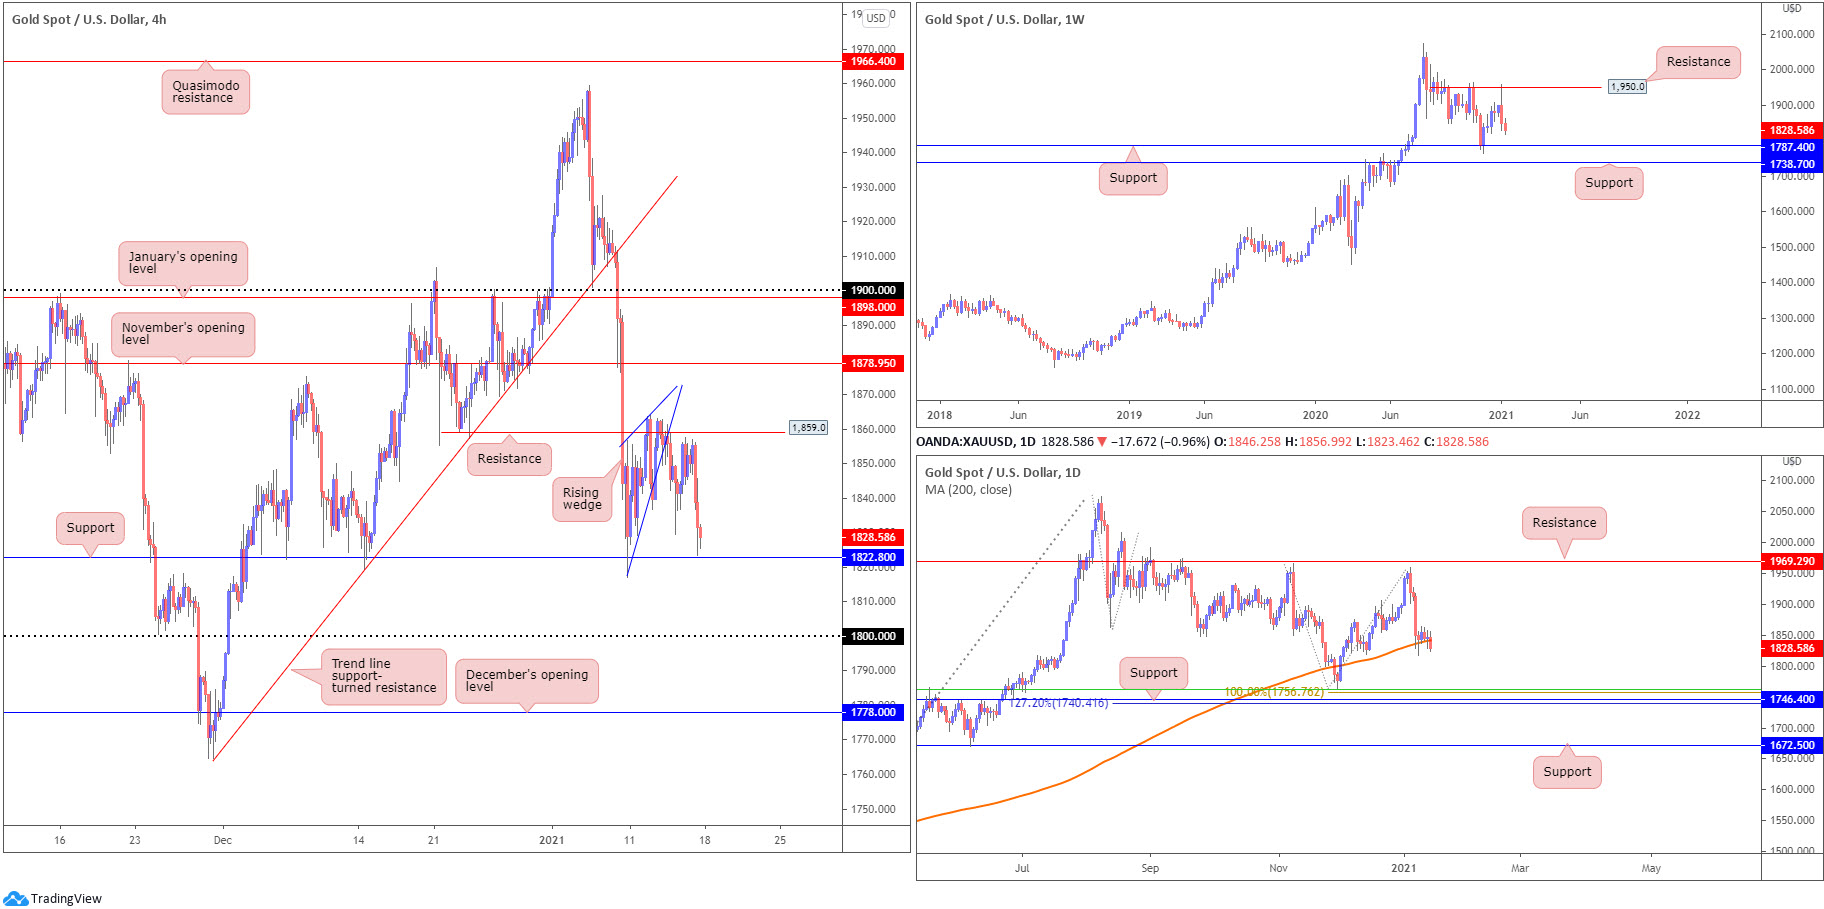
XAU/USD (GOLD):
Weekly gain/loss: -1.12%
Weekly close: $1,828
Weekly perspective:
XAU/USD extended its bearish setting last week, following the prior week’s 2.6% slump from resistance at $1,950.
Should sellers strengthen their grip this week, support at $1,787 could play a leading role—plotted just north of another layer of support at $1,738.
It is also worth noting that in terms of trend we’ve been actively trending higher since early 2016.
Daily perspective:
Traders will acknowledge the yellow metal spent the majority of the week balancing off the 200-day SMA (orange – $1,841)—that was until Friday.
With the 200-day SMA out of the picture, further losses could be seen this week, targeting support priced in at $1,746 (merges with Fibonacci support around $1,740-$1,756).
H4 perspective:
Wednesday’s rising wedge ($1,817/$1,856) breach hit its pattern take-profit target on Friday, set just north of support at $1,822.
Under $1,822, traders likely have $1,800 and December’s opening value at $1,778 in the crosshairs this week.
North of price, resistance is pictured at $1,859, while a break potentially targets November’s opening value from $1,878.
Areas of consideration:
- The 200-day SMA support giving up its position last week sets a possible bearish theme this week, with weekly sellers perhaps targeting $1,787. A H4 close under H4 support at $1,822, therefore, could be interesting for sellers.
- Weekly support mentioned above at $1,787 also resides between $1,800 and December’s opening value at $1,778 on the H4 scale—a possible downside target for shorts under $1,822.
The accuracy, completeness and timeliness of the information contained on this site cannot be guaranteed. IC Markets does not warranty, guarantee or make any representations, or assume any liability regarding financial results based on the use of the information in the site.
News, views, opinions, recommendations and other information obtained from sources outside of www.icmarkets.com.au, used in this site are believed to be reliable, but we cannot guarantee their accuracy or completeness. All such information is subject to change at any time without notice. IC Markets assumes no responsibility for the content of any linked site.
The fact that such links may exist does not indicate approval or endorsement of any material contained on any linked site. IC Markets is not liable for any harm caused by the transmission, through accessing the services or information on this site, of a computer virus, or other computer code or programming device that might be used to access, delete, damage, disable, disrupt or otherwise impede in any manner, the operation of the site or of any user’s software, hardware, data or property.