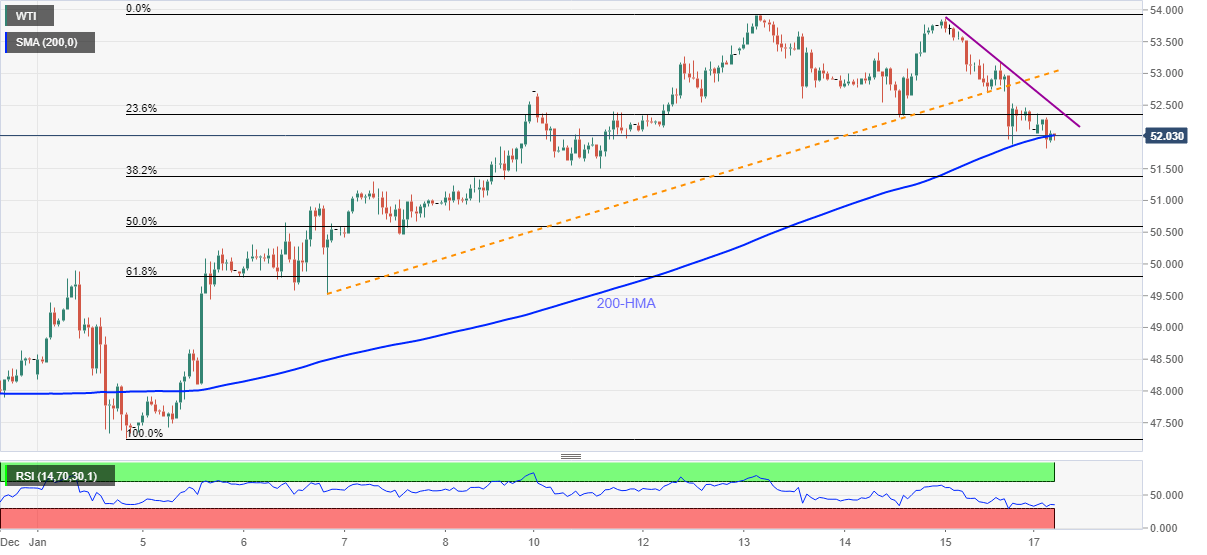
WTI Price Analysis: 200-HMA probes sellers around $52.00
- WTI remains on the back foot around one week low.
- RSI conditions favor corrective pullback towards short-term resistance line.
- Sellers may eye $51.30 as extra downside filter.
WTI wavers around $52.00, down 0.44% on a day, during early Monday. In doing so, the energy benchmark trades near the lowest level in one week as bears battle 200-HMA.
It should be noted that RSI conditions are also nearly oversold and can trigger the quote’s bounce. As a result, a downward sloping trend line from Friday, currently around $52.50, can lure intraday buyers.
However, any further upside will eye to refresh the multi-month high, marked earlier during the month, around $54.00.
During the rise, the black gold may avail an intermediate halt around $53.30 while February 2020 peak surrounding $54.70.
Alternatively, a sustained downside below 200-HMA level of $52.00 will eye for $51.00 and 61.8% Fibonacci retracement of January 04-13 upside, near $49.80.
Overall, WTI is in an uptrend but the intermediate pullbacks can’t be ruled out.
WTI hourly chart
Trend: Pullback expected


