Polkadot Price Forecast: DOT begins corrective downtrend towards $10
- Polkadot price is down by 23% since its all-time high at $19.4.
- The digital asset shows clear signs of a potential correction period down to $10.
Polkadot had a massive run to its all-time high of $19.4 on January 16, reaching a market capitalization of $16 billion and placing itself as the 4th largest digital asset. DOT is still up by 60% in the past week despite the recent sell-off.
Polkadot pullback can extend further according to technicals
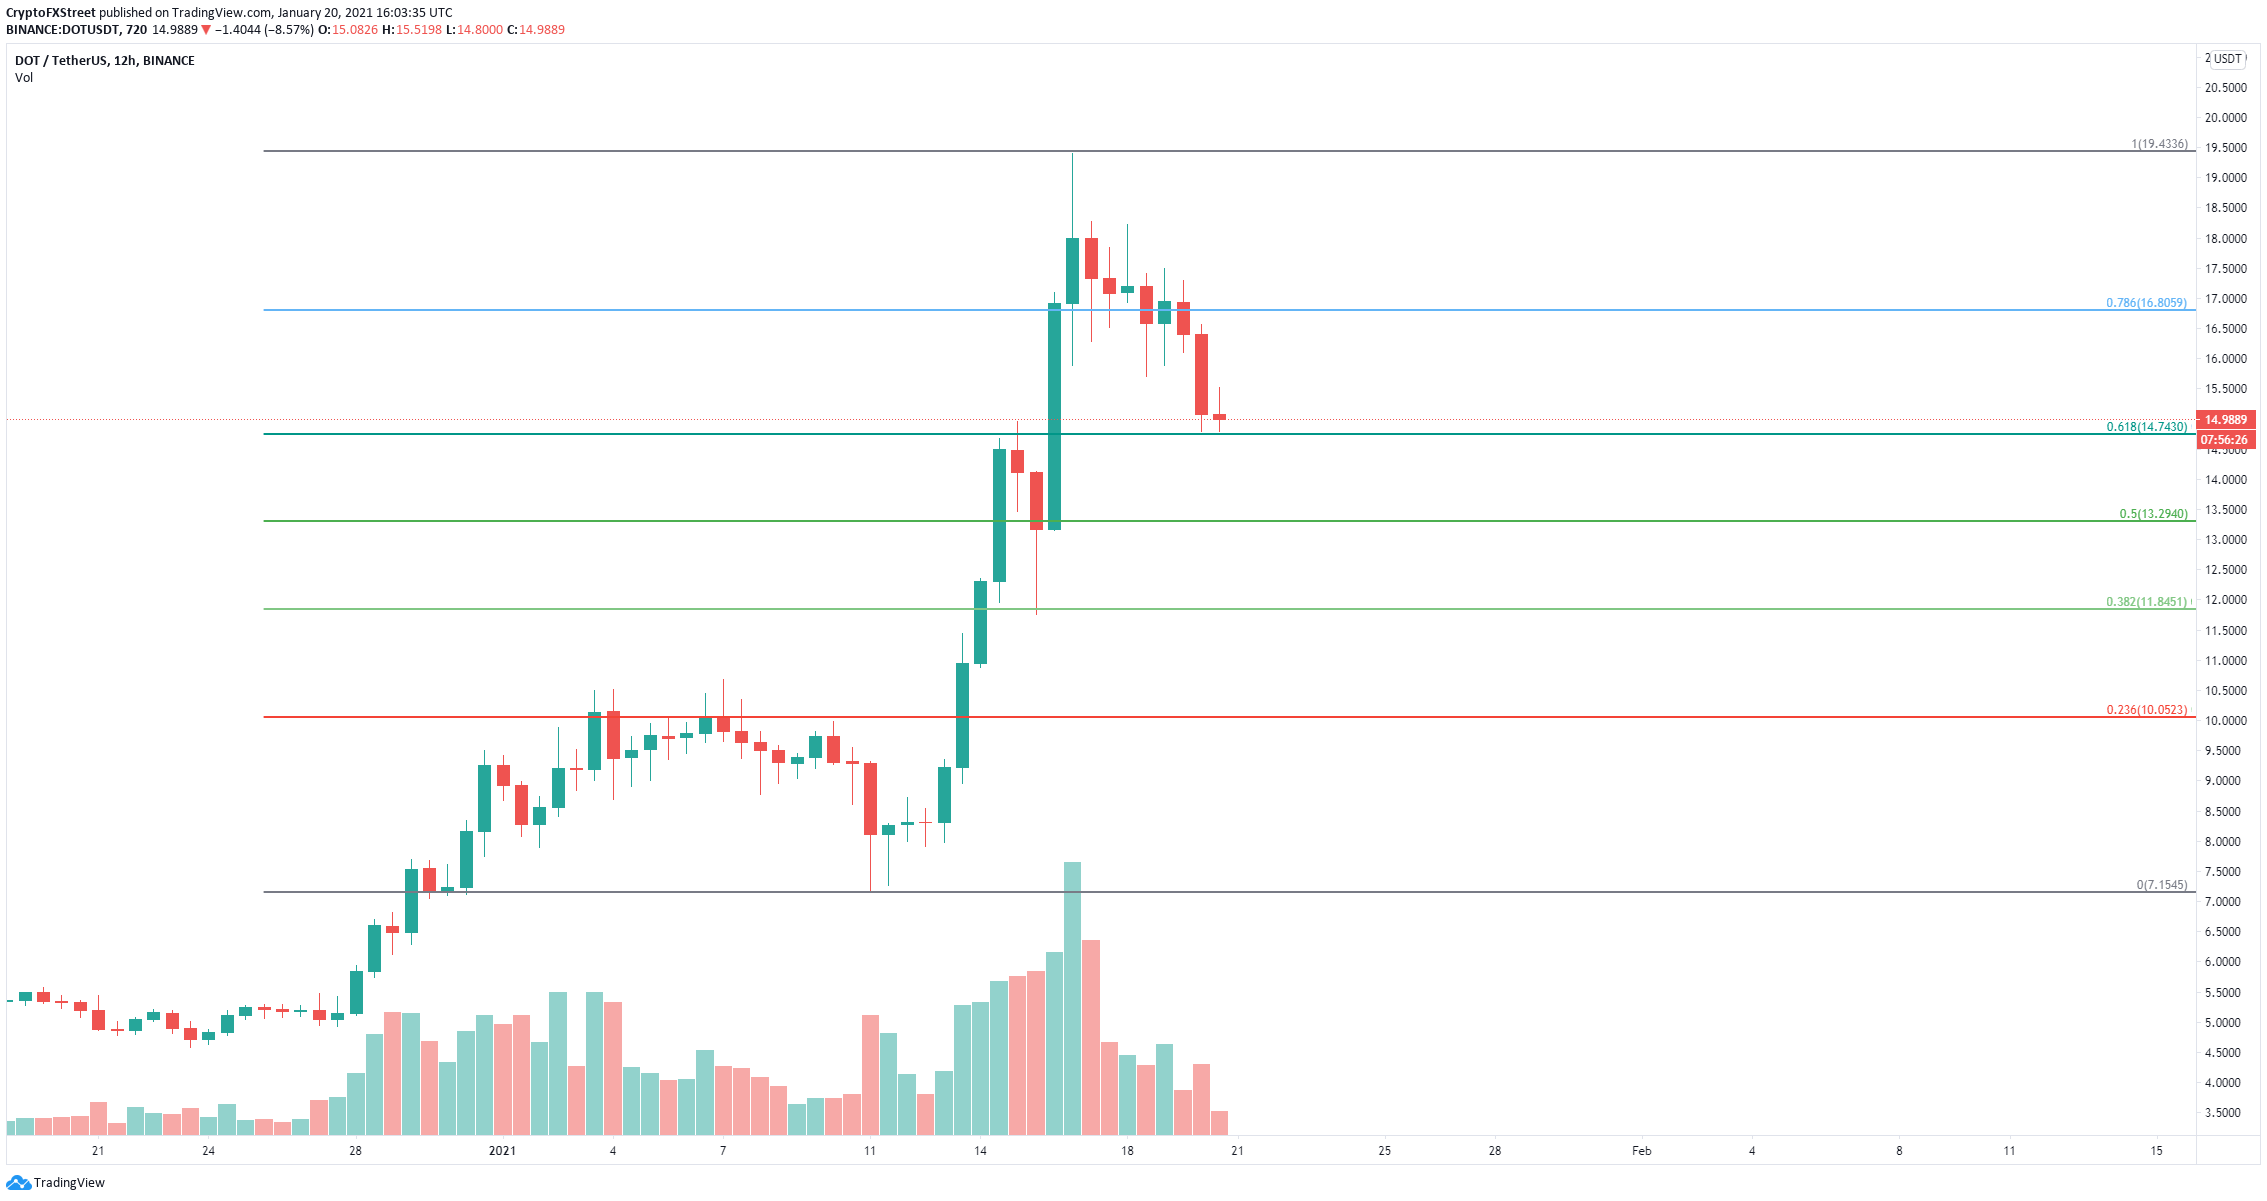
On the daily chart, Polkadot price has smashed through the 78.6% Fibonacci level of its latest rally at $16.8 and it’s currently holding the 61.8% level at $14.7. A breakdown below this point can send Polkadot price down to $13.
DOT/USD daily chart
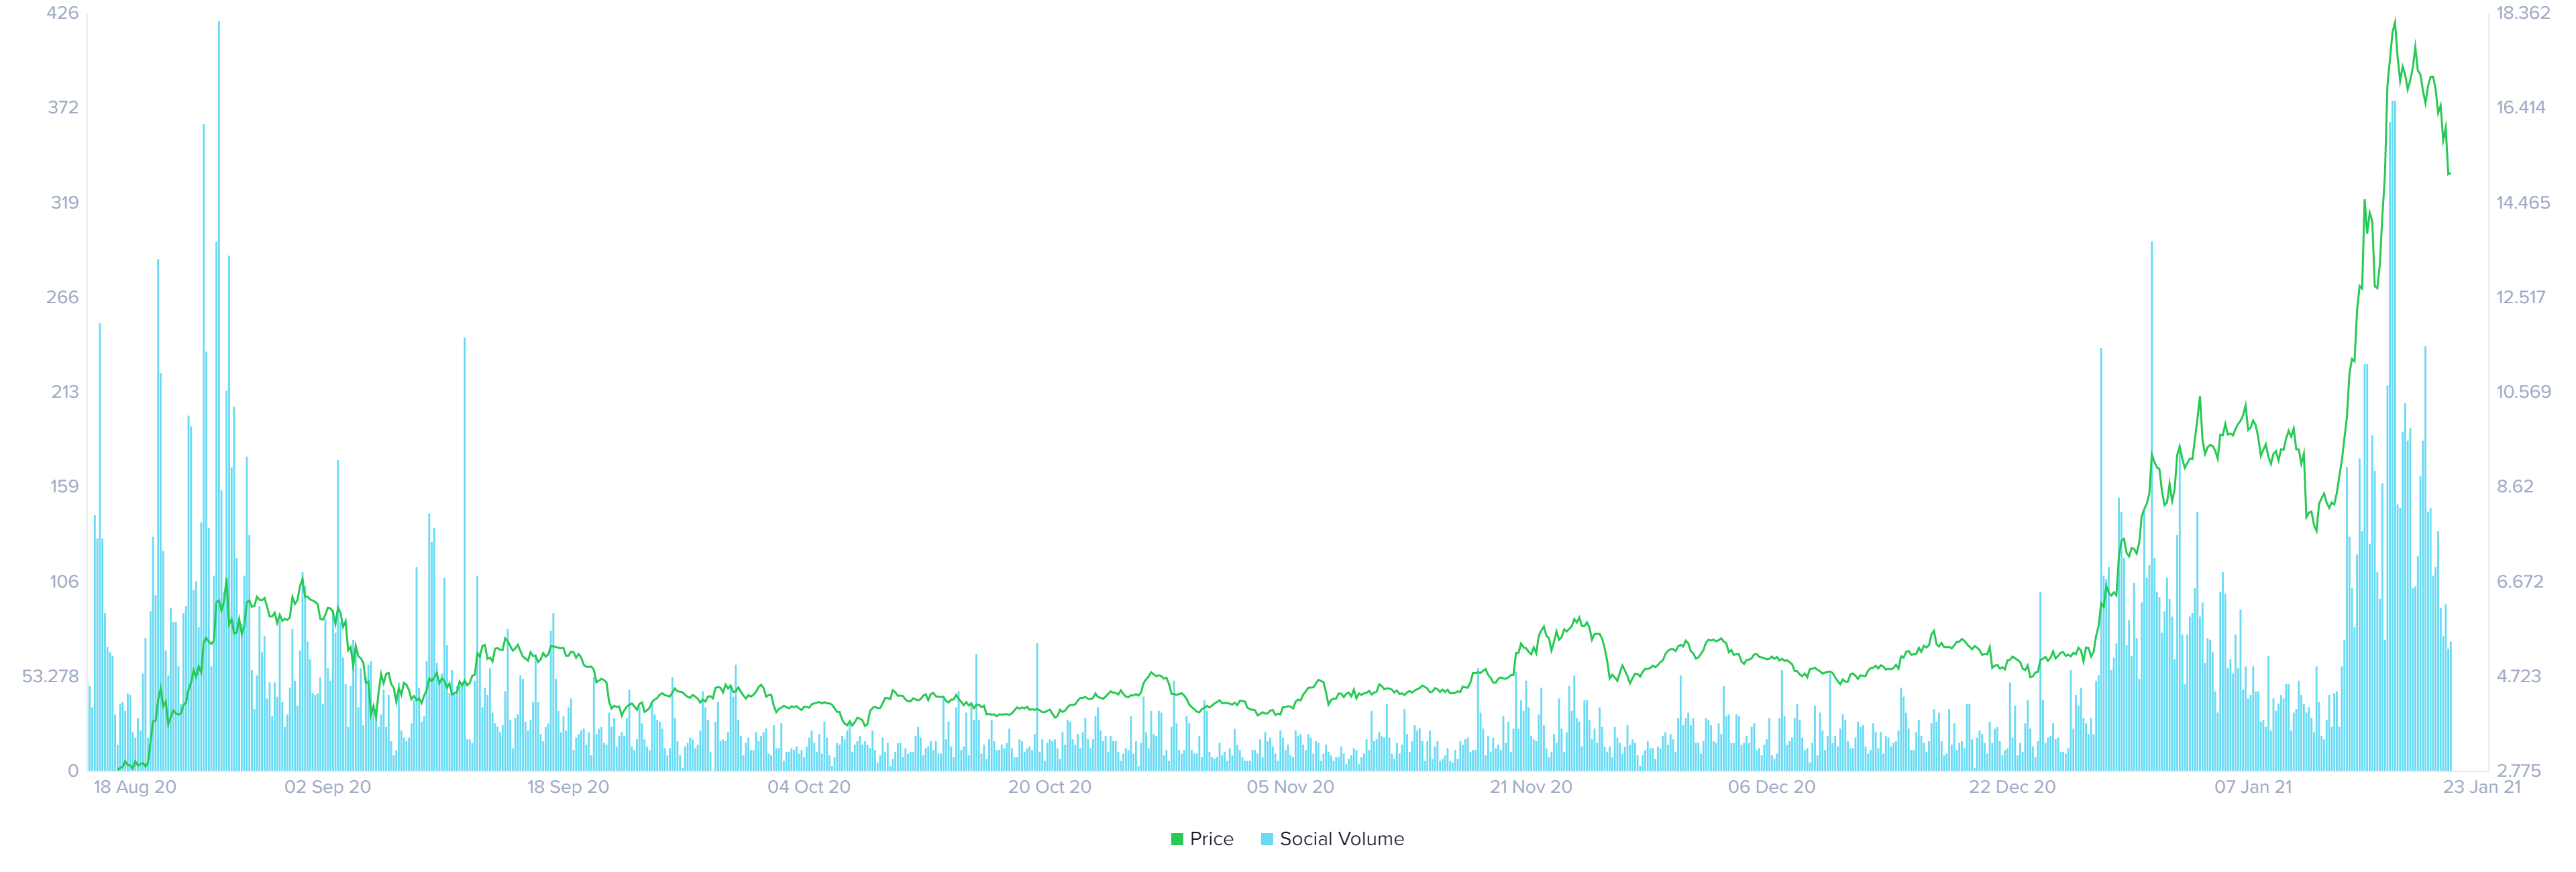
Other price targets for the bears include the 38.2% Fib level at $11.84 and finally the 23.6% level at $10. On January 16, Polkadot saw a massive spike in its social volume, which measures the number of times the digital asset has been mentioned across social media channels.
DOT Social Volume
A high social volume indicates that an asset could be on the verge of a potential correction and so far, bears have seen a lot of confirmation as Polkadot price is down by 23% since the peak.
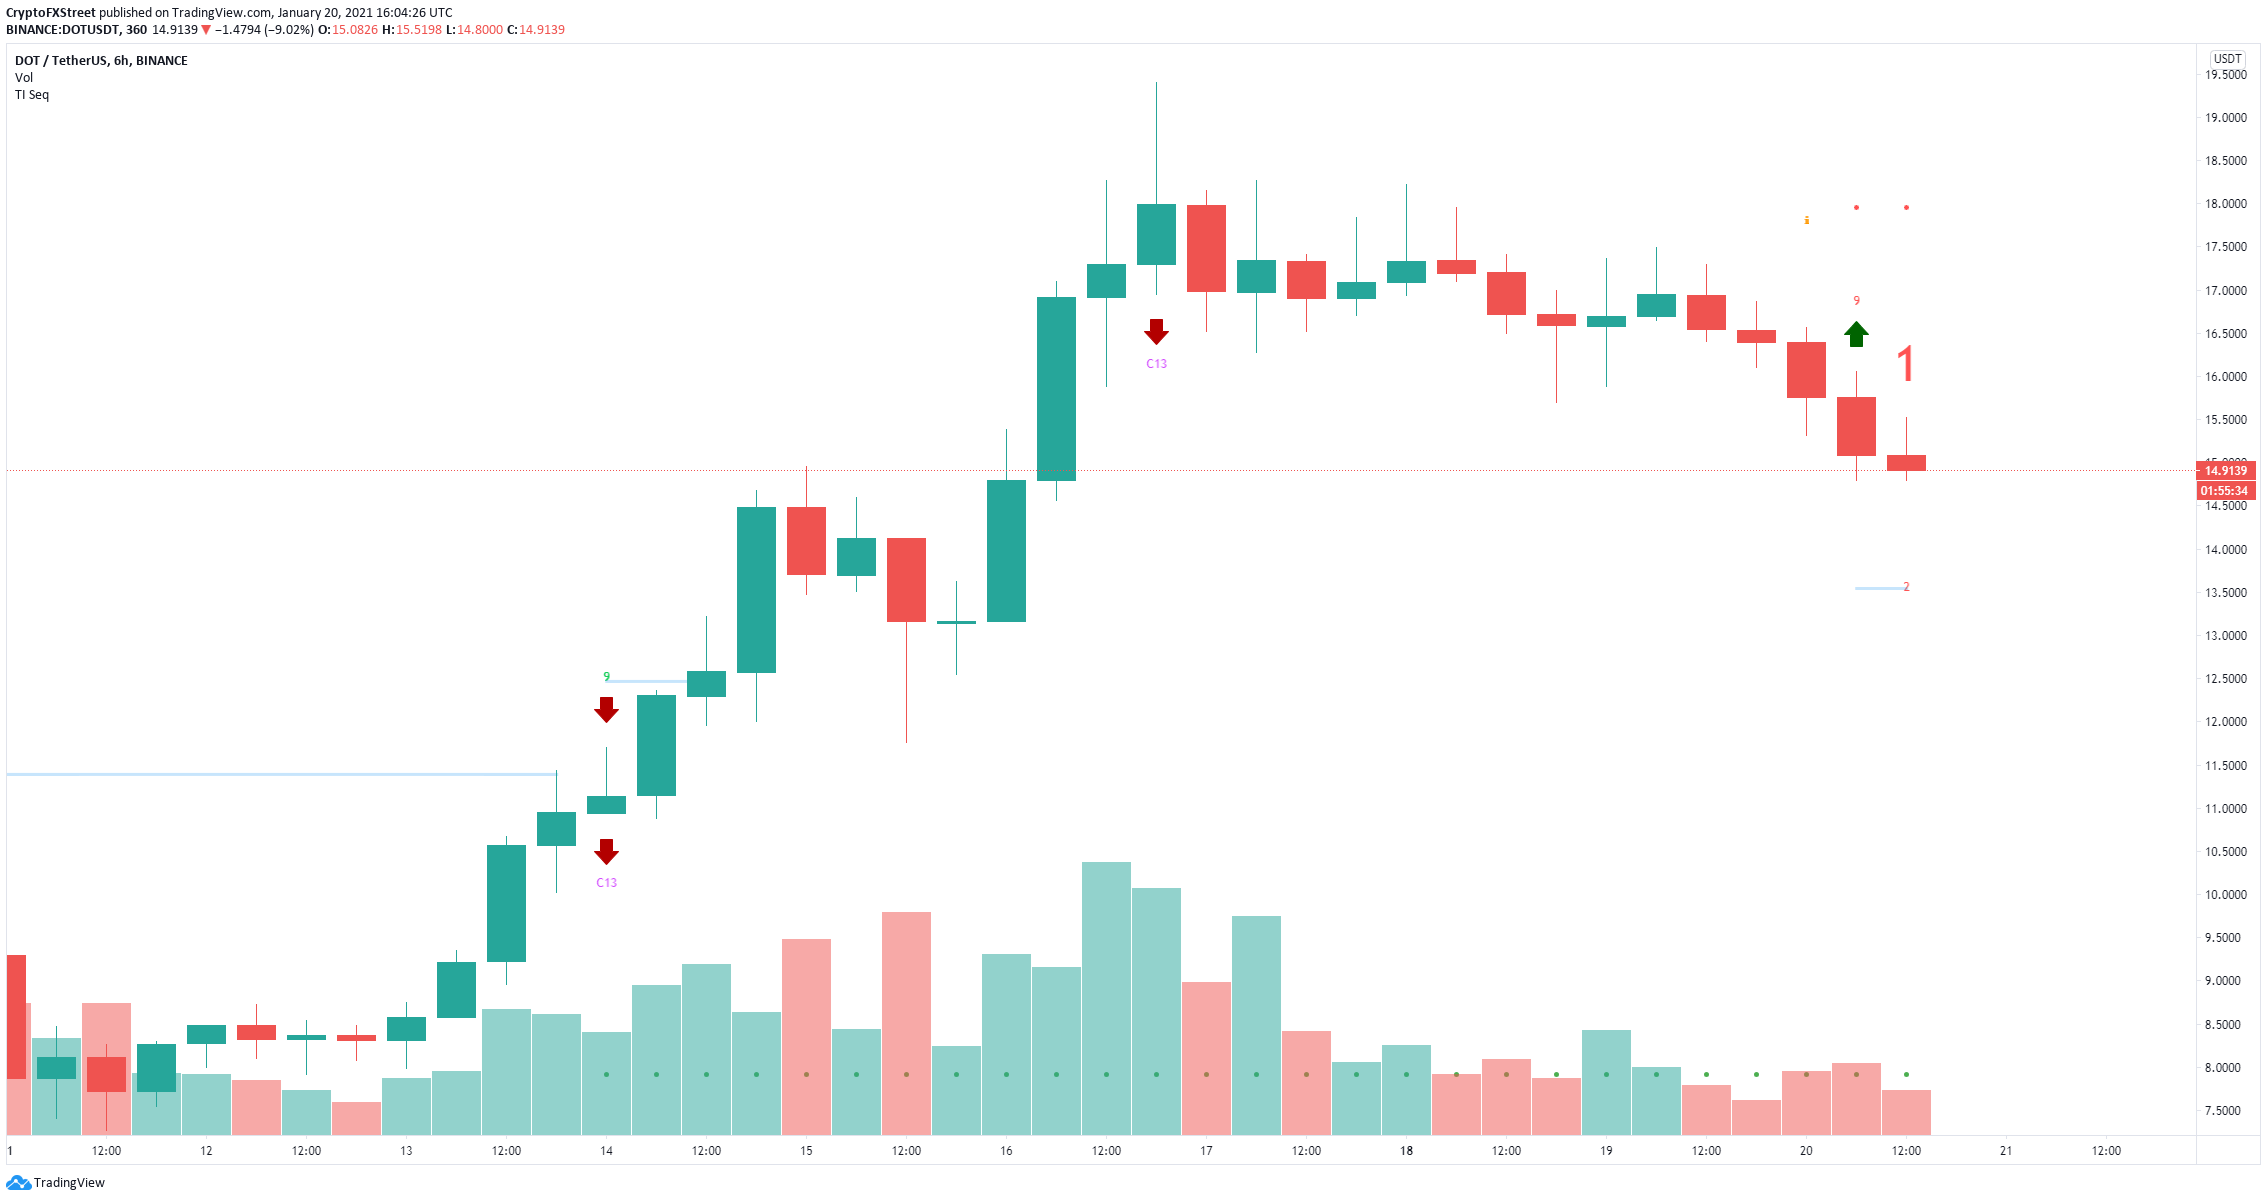
DOT/USD 6-hour chart
However, there is a chance for Polkadot price to rise higher in the short-term before another leg down. The TD Sequential indicator has just presented a buy signal on the 6-hour chart in the form of a red ‘9’ candlestick.


