Cardano Price Prediction: ADA ready to resume uptrend towards $2
![]()
- Cardano price shows signs of a reversal after a 30% correction.
- The Tom DeMark Sequential indicator’s buy signal on the 4-hour and the 12-hour chart hints at a continuation of the bull rally.
- Transaction data shows stiff resistance at $1.28 that could deter ADA’s upswing.
Cardano price showed signs of a recovery as bulls managed to keep ADA above a critical support barrier. Now, a reversal in momentum could put the so-called “Ethereum killer” back on track to $2.
Cardano price hints at a u-turn
Cardano price dropped nearly 30% after hitting an all-time high of $1.48 on February 27. Although ADA sliced below the 50 four-hour MA, bulls have kept the altcoin above the 100 four-hour MA shows their strength.
The lower Bollinger band, which coincides with the 100 four-hour MA, provided an extra layer of support to the declining prices. If this barrier continues to hold, a volatile reversal move will be in play.
Adding credence to this bullish thesis is the TD Sequential indicator’s buy signal presented in the form of a green nine candlestick on both the 4-hour and 12-hour charts. This setup forecasts a one-to-four candlestick upswing, suggesting that Cardano price is heading to greener pastures.
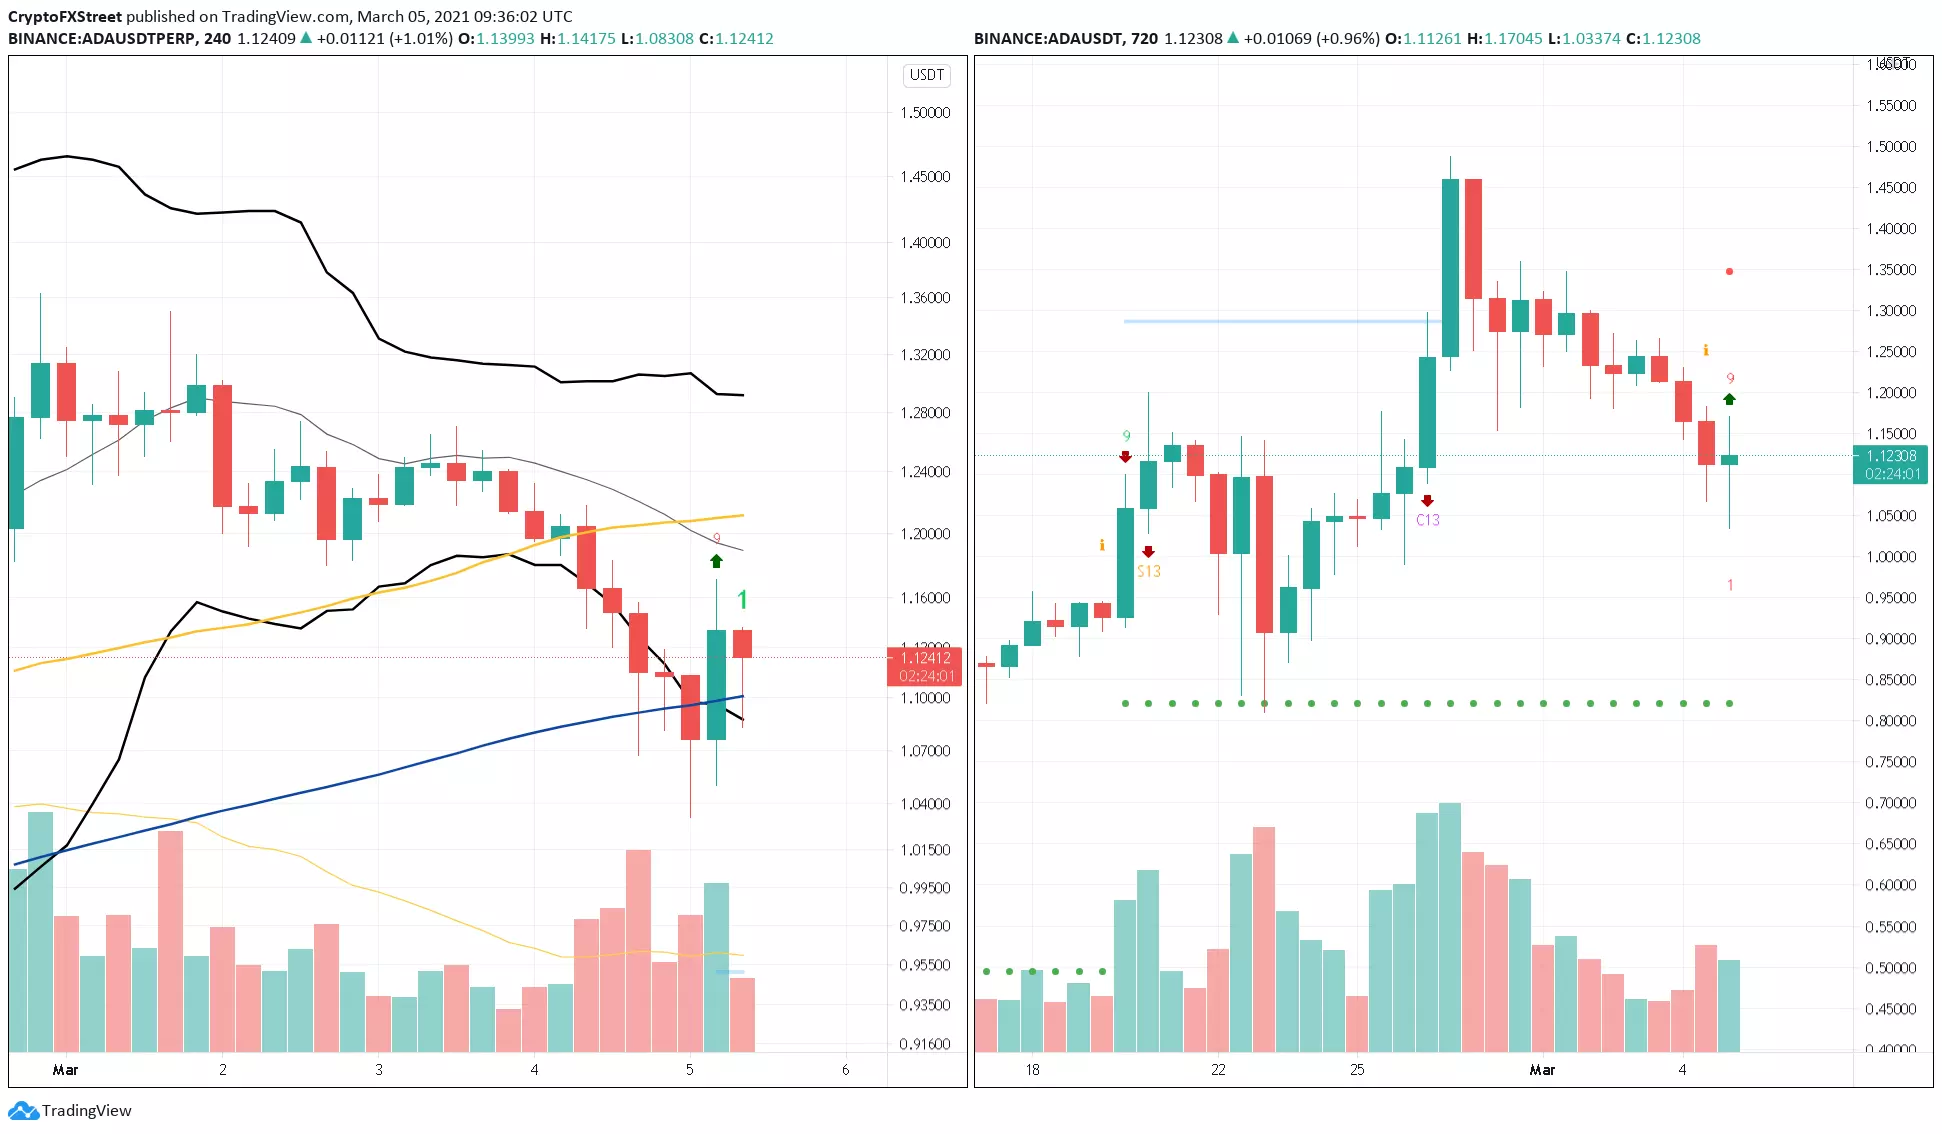
ADA/USDT 4-hour and 12-hour chart
While the technicals indicate a bullish outlook, investors need to pay close attention to the $1.26 resistance barrier.
IntoTheBlock’s In/Out of the Money Around Price (IOMAP) model reveals that here roughly 32,800 addresses are holding 1.83 billion ADA. These holders are currently “Out of the Money,” based on this on-chain metric.
Hence, they might be inclined to sell their token to break even. Only a decisive 4-hour candlestick close above $1.26 will kickstart Cardano price bull rally to $2.
Cardano IOMAP chart
On the other hand, the IOMAP cohorts also show that a 4-hour candlestick close below $1.07 will put 165,000 addresses underwater. Since these investors hold 3.52 billion ADA, such a move could be fatal for Cardano price.
Slicing through this critical support barrier could trigger a 16% sell-off to the next interest area at $0.89.