AUD/USD Technical Analysis: Aussie rejecting 0.7144 resistance can lead to a breakdown below 0.7100 level
![]()
- AUD/USD is trading in a bear trend below the 200-period simple moving average.
- AUD/USD is currently rejecting the 0.7144 resistance and there seems little in the way for the market to test 0.7085 (September 11 low). The RSI and MACD are decelerating while the Stochastic indicator is pointing upward.
- A break below 0.7085 can potentially open the gates to 0.7041 October low.
AUD/USD 4-hour chart
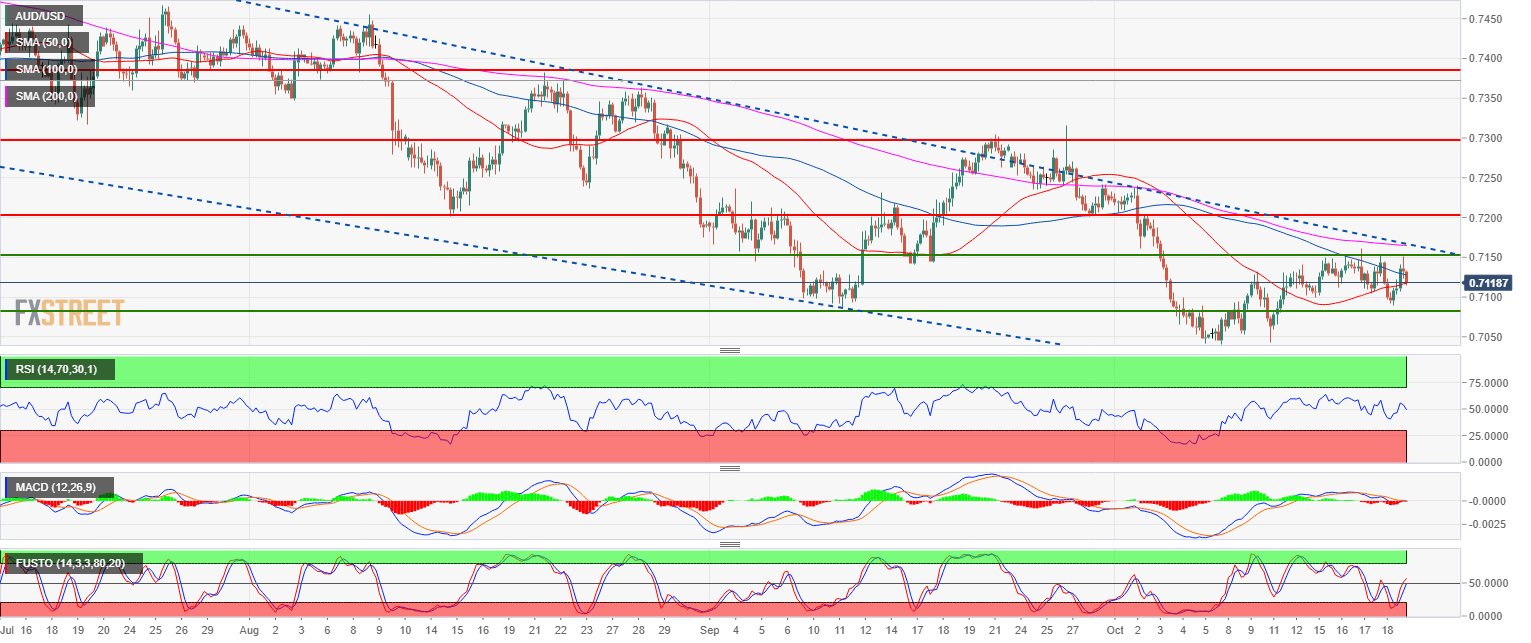
Spot rate: 0.7118
Relative change: 0.28%
High: 0.7151
Low: 0.7088
Main trend: Bearish
Resistance 1: 0.7144 September 5 low
Resistance 2: 0.7174-0.7200 zone, 200 SMA (4H) and August 15 low
Resistance 3: 0.7300 figure
Support 1: 0.7100 figure
Support 2: 0.7085, September 11 low
Support 3: 0.7041 October low
Support 4: 0.7000 figure
Support 5: 0.6830 January 15, 2016 low