USD/JPY Technical Analysis: Bears eyeing Tuesday’s low of 112.58 after rising wedge breakdown
![]()
The USD/JPY looks set to test the support at 112.58 (Tuesday’s low), having suffered a rising wedge breakdown earlier today.
A deeper drop below that level, possibly to the 100-day moving average (MA) of 112.24, cannot be ruled out as the US treasury yield curve inversion is being read as a sign of impending economic recession.
Hourly chart
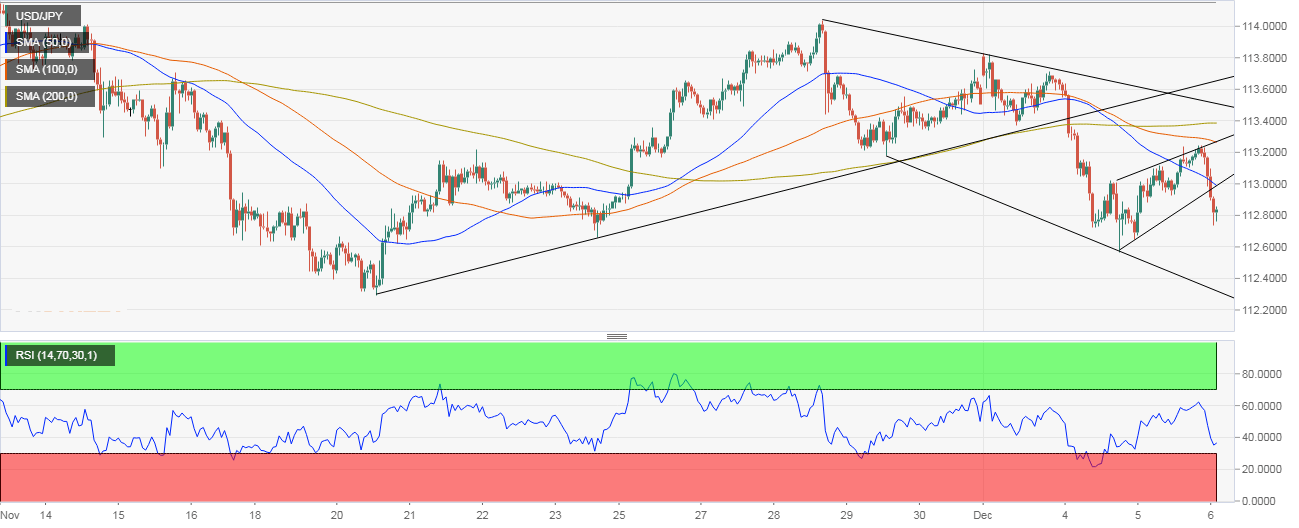
- As seen above, the pair has established a bearish falling channel, having breached the rising trendline earlier this week.
- The rising wedge breakdown seen earlier today indicates the sell-off from the Dec. 3 high of 113.71 has resumed.
- The major averages (50, 100, and 200) are located one below the other, indicating the path of least resistance is on the downside.
Trend: Bearish
USD/JPY
Overview:
Today Last Price: 112.83
Today Daily change: -39 pips
Today Daily change %: -0.344%
Today Daily Open: 113.22
Trends:
Previous Daily SMA20: 113.35
Previous Daily SMA50: 113.09
Previous Daily SMA100: 112.25
Previous Daily SMA200: 110.52
Levels:
Previous Daily High: 113.24
Previous Daily Low: 112.65
Previous Weekly High: 114.04
Previous Weekly Low: 112.88
Previous Monthly High: 114.25
Previous Monthly Low: 112.3
Previous Daily Fibonacci 38.2%: 113.02
Previous Daily Fibonacci 61.8%: 112.88
Previous Daily Pivot Point S1: 112.83
Previous Daily Pivot Point S2: 112.44
Previous Daily Pivot Point S3: 112.24
Previous Daily Pivot Point R1: 113.43
Previous Daily Pivot Point R2: 113.63
Previous Daily Pivot Point R3: 114.02