USD/JPY Technical Analysis: Greenback hammered down 112.20 as Wall Street bears own the market – 112.60 bull target
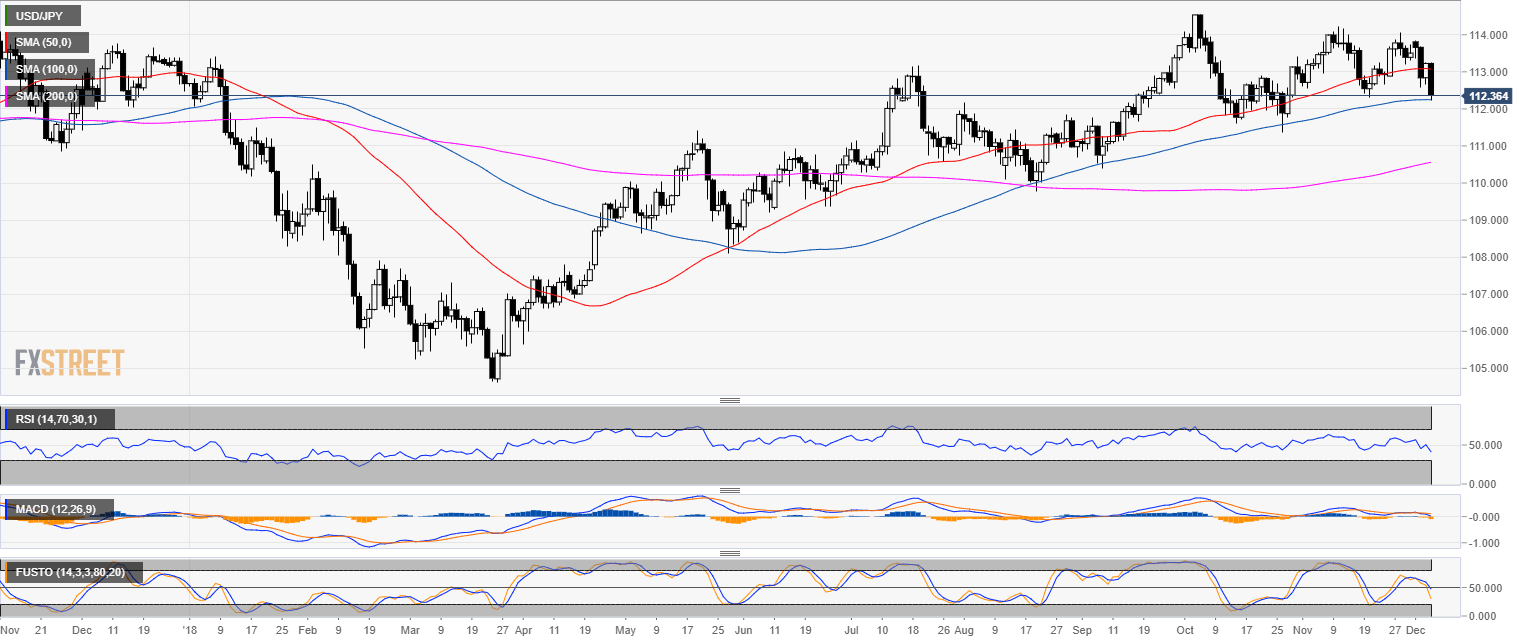
USD/JPY daily chart
- USD/JPY is in a bull trend above the 200-day simple moving average (SMA).
- USD/JPY found some support at the 100 SMA.
- Safe haven Yen was in demand as US indices are trading down.

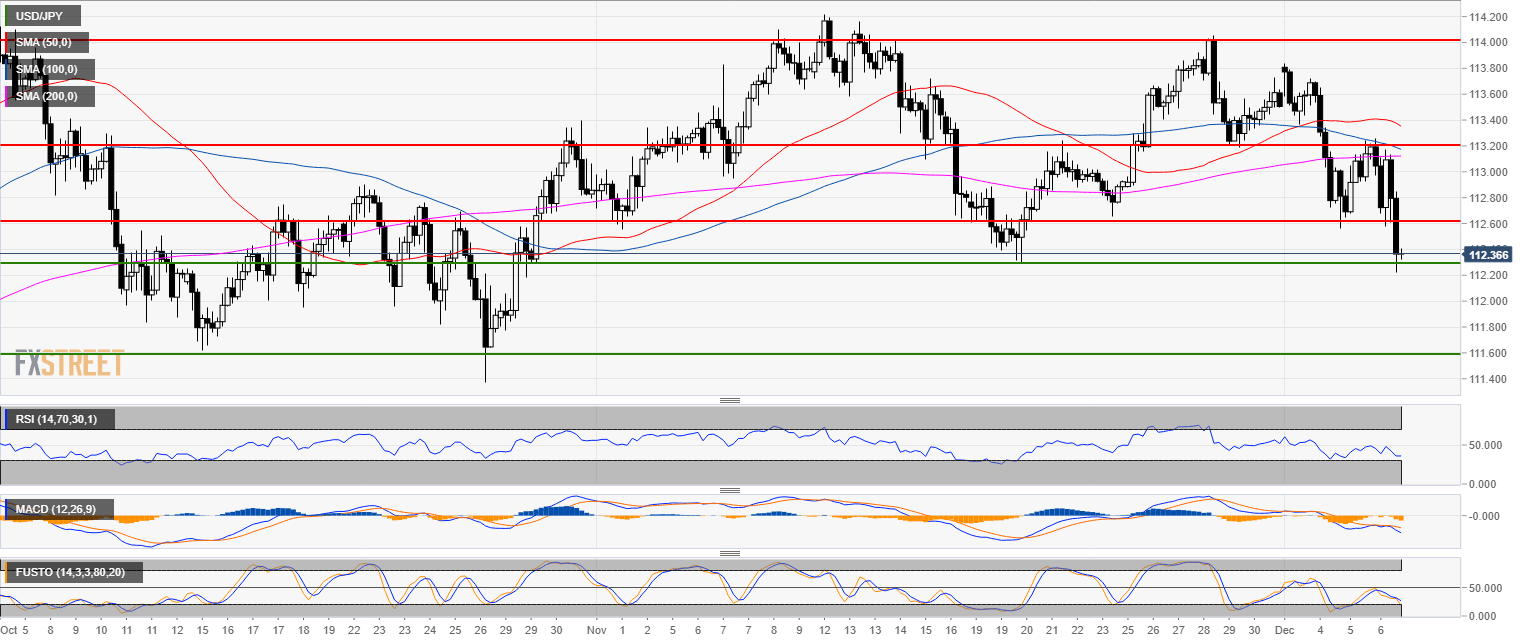
USD/JPY 4-hour chart
- USD/JPY is trading below its main SMAs.
- USD/JPY is testing November lows at the 112.20 level.

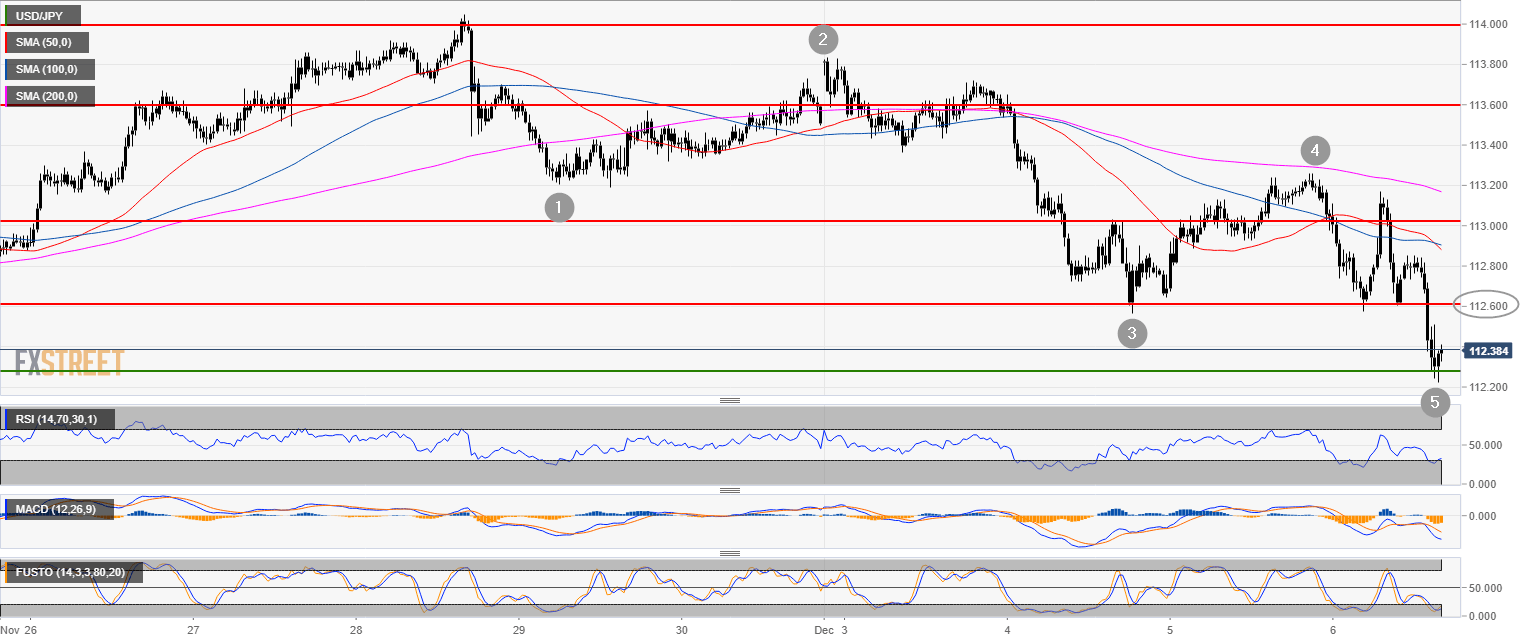
USD/JPY 30-minute chart
- As USD/JPY created a 5-wave pattern, bulls might find support at 112.20.
- The next bullish target is seen at 112.60.

Additional key levels
USD/JPY
Overview:
Today Last Price: 112.36
Today Daily change: -86 pips
Today Daily change %: -0.760%
Today Daily Open: 113.22
Trends:
Previous Daily SMA20: 113.35
Previous Daily SMA50: 113.09
Previous Daily SMA100: 112.25
Previous Daily SMA200: 110.52
Levels:
Previous Daily High: 113.24
Previous Daily Low: 112.65
Previous Weekly High: 114.04
Previous Weekly Low: 112.88
Previous Monthly High: 114.25
Previous Monthly Low: 112.3
Previous Daily Fibonacci 38.2%: 113.02
Previous Daily Fibonacci 61.8%: 112.88
Previous Daily Pivot Point S1: 112.83
Previous Daily Pivot Point S2: 112.44
Previous Daily Pivot Point S3: 112.24
Previous Daily Pivot Point R1: 113.43
Previous Daily Pivot Point R2: 113.63
Previous Daily Pivot Point R3: 114.02

