GBP/USD Technical Analysis: Cable under heavy pressure at the 2018 low
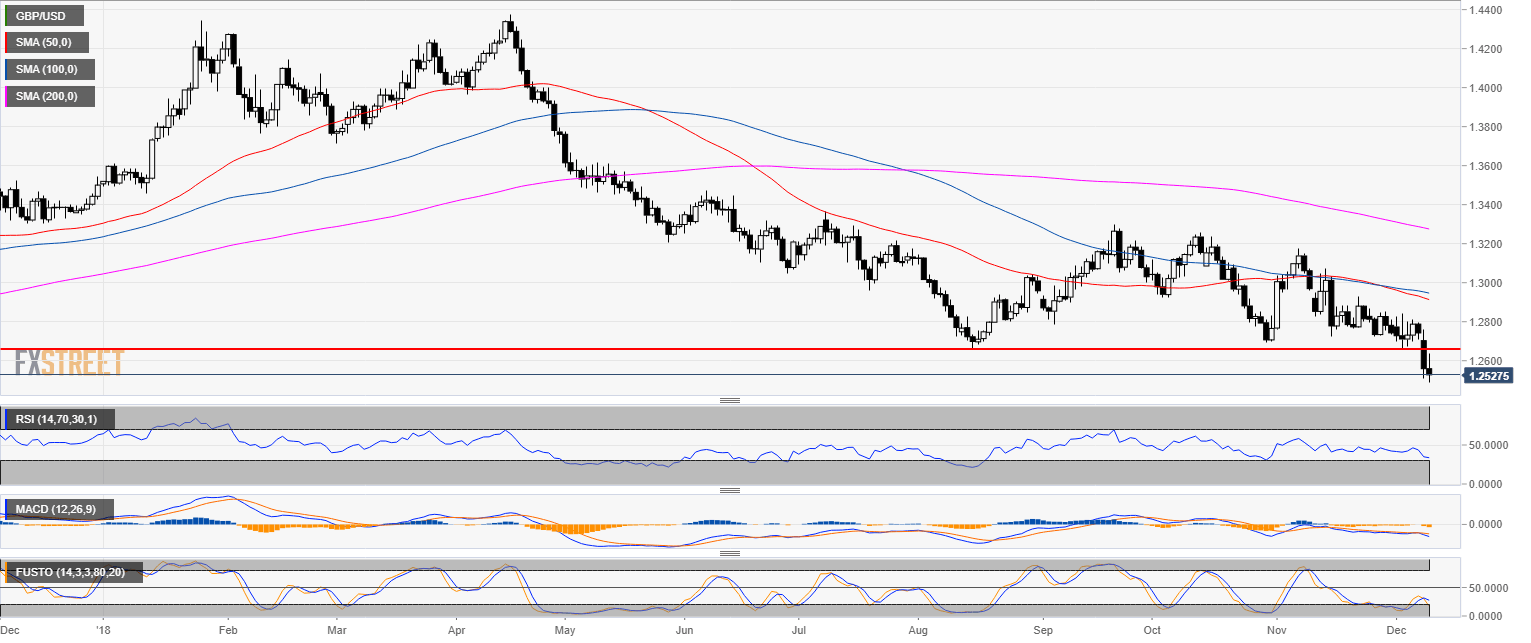
EUR/USD daily chart
- GBP/USD is trading in a bear trend below the 50, 100 and 200-day simple moving average (SMA).
- As forecast at the start of the New York session, 1.2500 target has been hit.

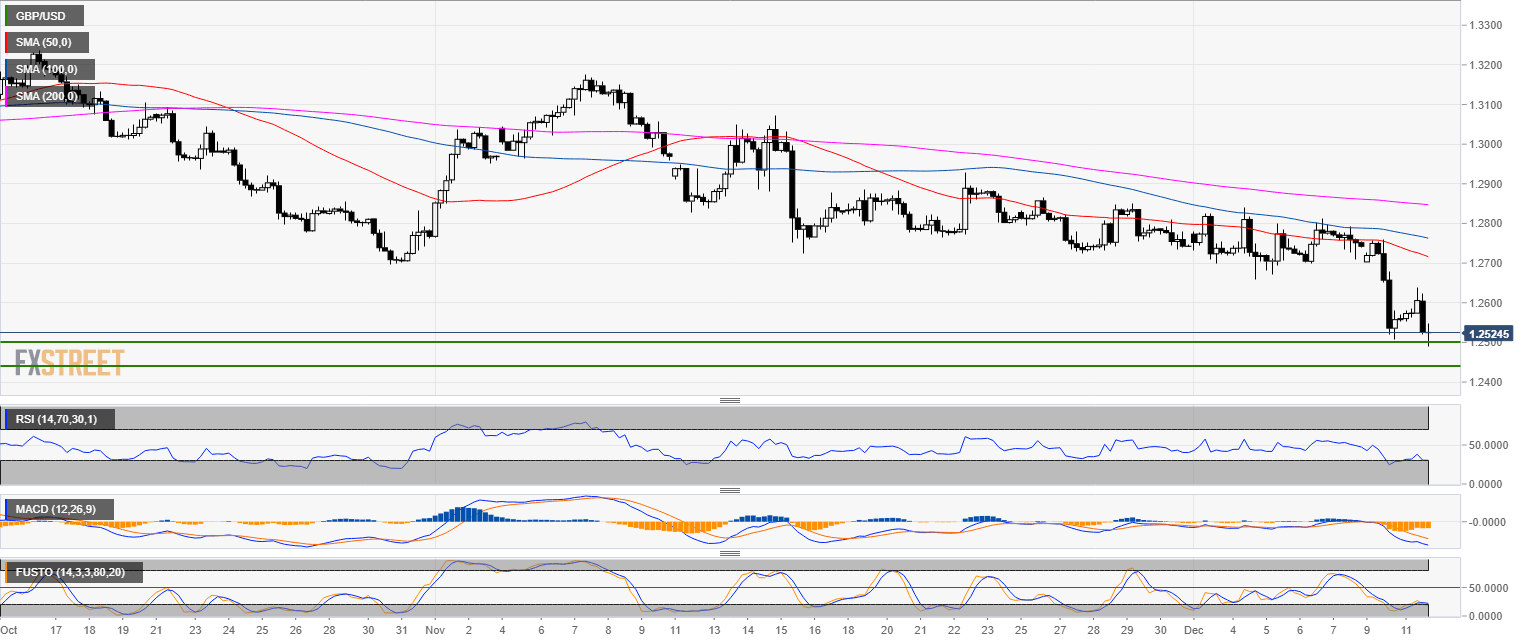
GBP/USD 4-hour chart
- GBP/USD is strongly bearish as the market remains under heavy pressure at 17-month’s low.

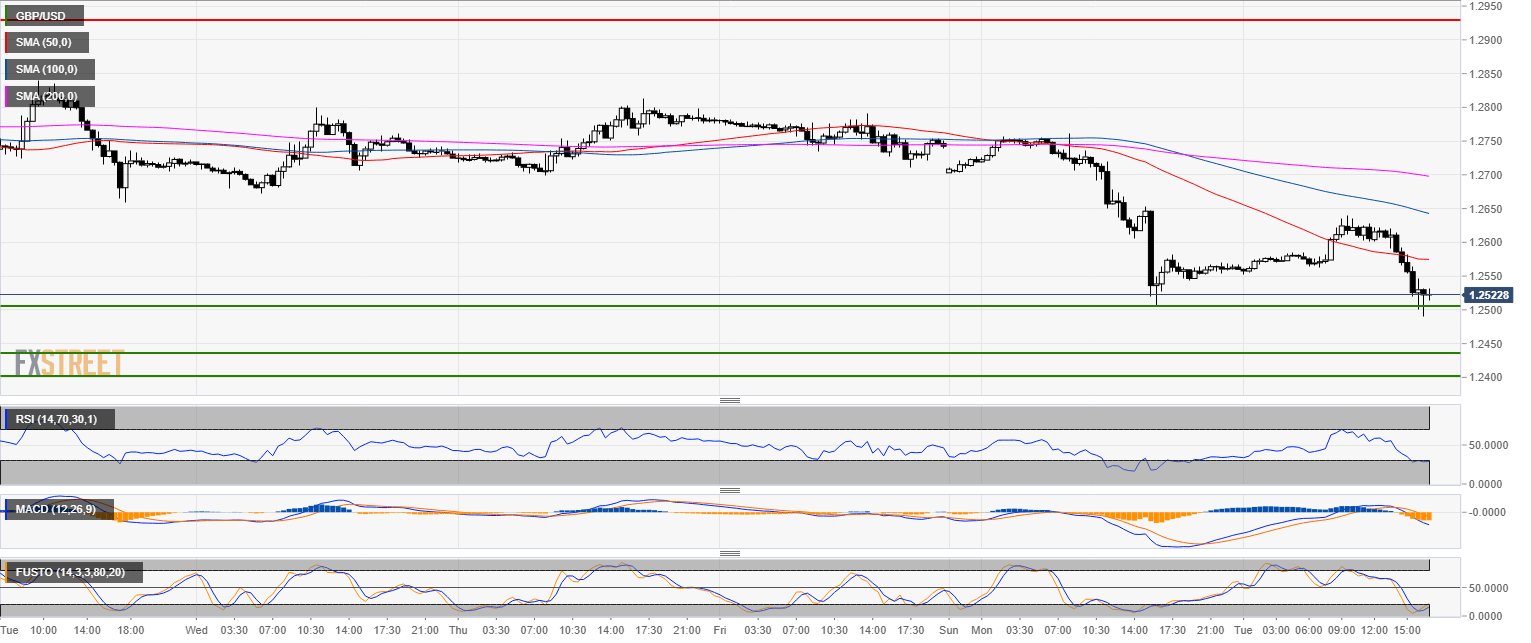
GBP/USD 30-minute chart
- If 1.2500 support is broken to the downside, the 1.2440 level and 1.2400 figure are likely the next targets for Cable.

Additional key levels
GBP/USD
Overview:
Today Last Price: 1.2524
Today Daily change: -35 pips
Today Daily change %: -0.279%
Today Daily Open: 1.2559
Trends:
Previous Daily SMA20: 1.2792
Previous Daily SMA50: 1.2922
Previous Daily SMA100: 1.2953
Previous Daily SMA200: 1.3281
Levels:
Previous Daily High: 1.276
Previous Daily Low: 1.2507
Previous Weekly High: 1.284
Previous Weekly Low: 1.2659
Previous Monthly High: 1.3176
Previous Monthly Low: 1.2723
Previous Daily Fibonacci 38.2%: 1.2604
Previous Daily Fibonacci 61.8%: 1.2663
Previous Daily Pivot Point S1: 1.2457
Previous Daily Pivot Point S2: 1.2355
Previous Daily Pivot Point S3: 1.2204
Previous Daily Pivot Point R1: 1.2711
Previous Daily Pivot Point R2: 1.2862
Previous Daily Pivot Point R3: 1.2964

