AUD/USD Price Analysis: High forex vol points to continuaiton to weekly support
![]()
- AUD/USD has been correcting the daily bearish impulse on the lower time frames.
- The focus is on an H1 38.2% Fibonacci correction near term but for further downside longer term.
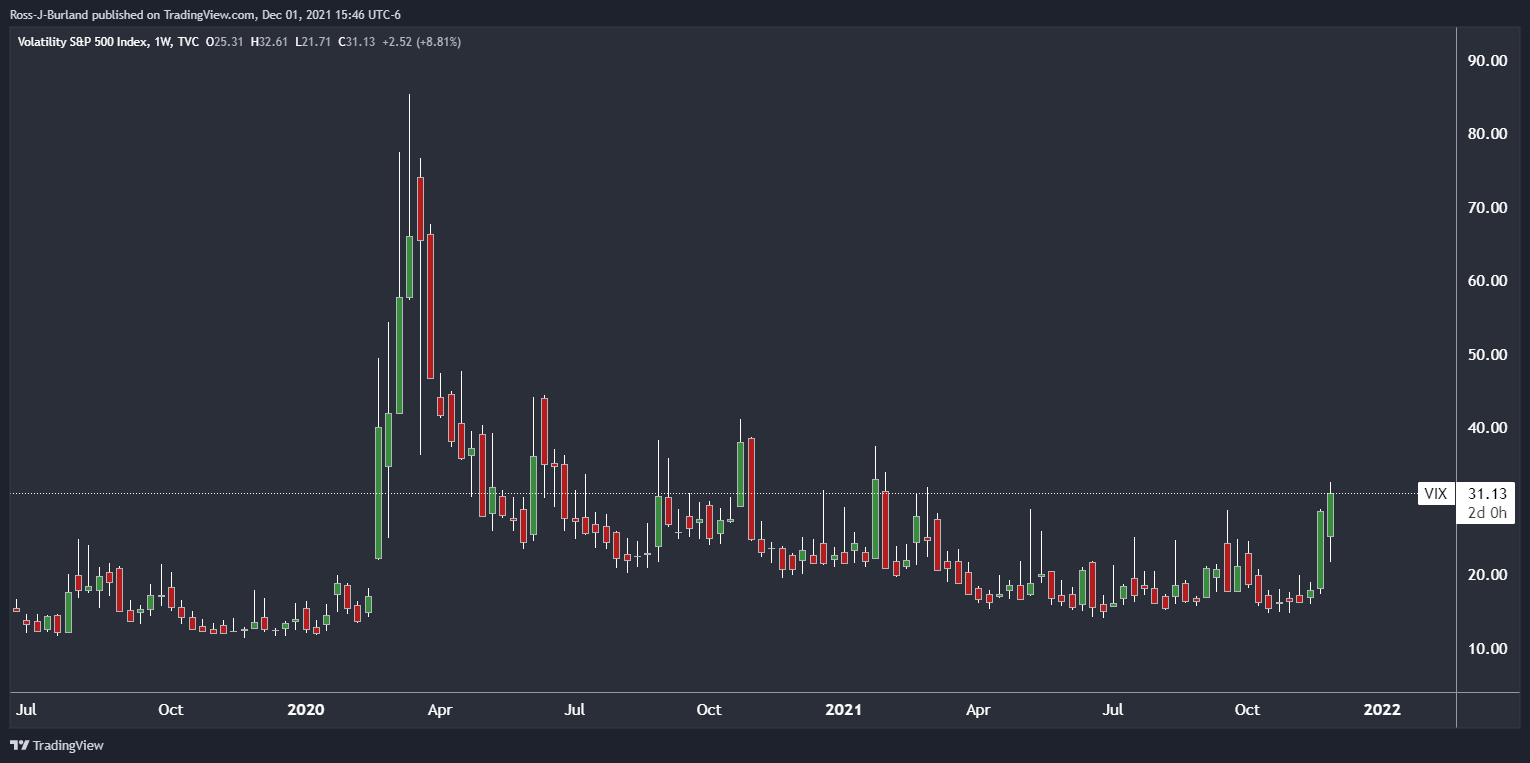
- Forex volatility is through the roof and the VIX has rallied to fresh highs.
AUD/USD bulls are stepping in at a familiar level of demand on the hourly time frame. However, the longer-term momentum is with the bears for a deeper continuation towards weekly support.
AUD/USD weekly chart
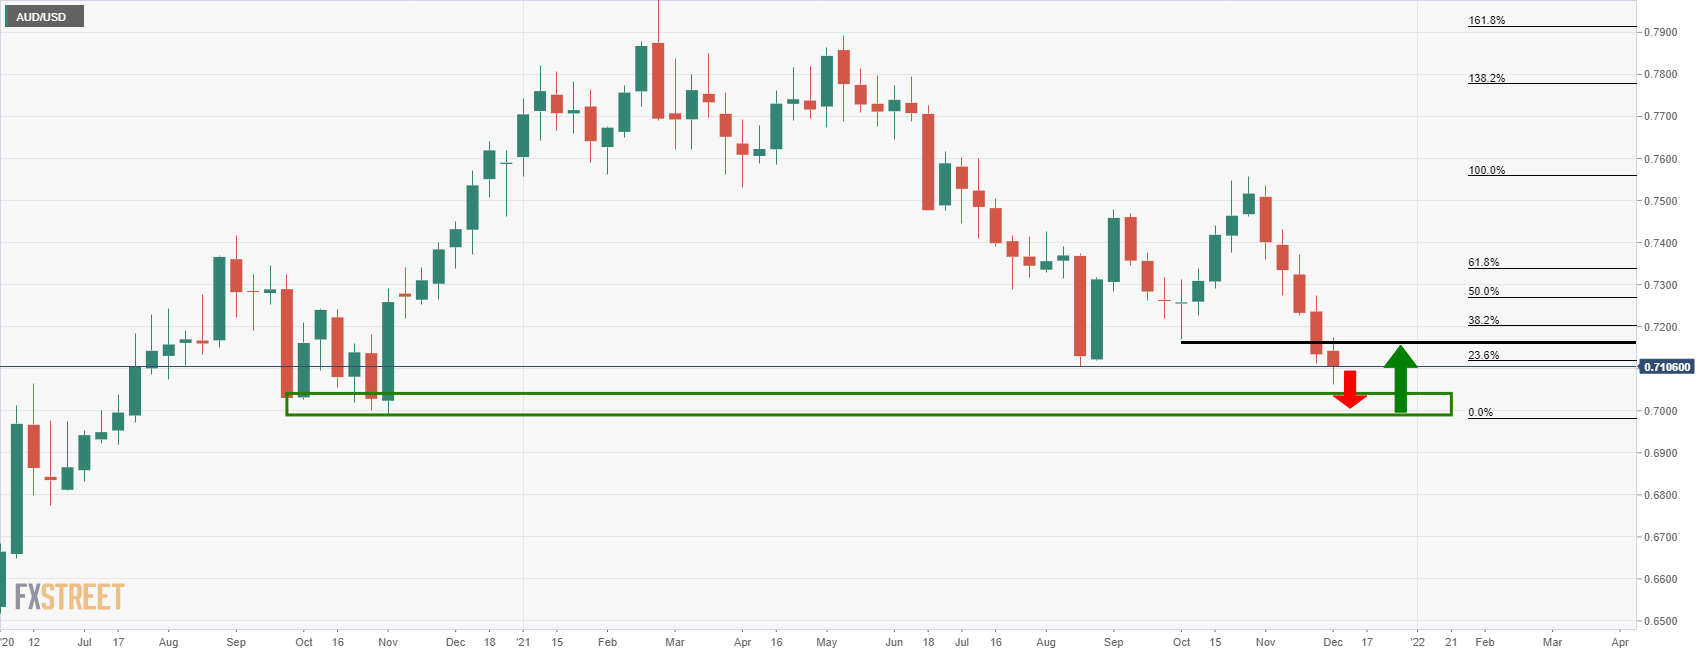
The momentum is to the downside and with the weekly lows near 0.70 the figure eyed as a key target. Meanwhile, the M-formation’s neckline should not be ignored near 0.7170. The 38.2% Fibonacci level will have a confluence with 0.72 the figure or there about should the price indeed continue to deteriorate into the weekly lows. This could be a target should the bulls accumulate from the weekly lows in the coming weeks.
AUD/USD daily chart
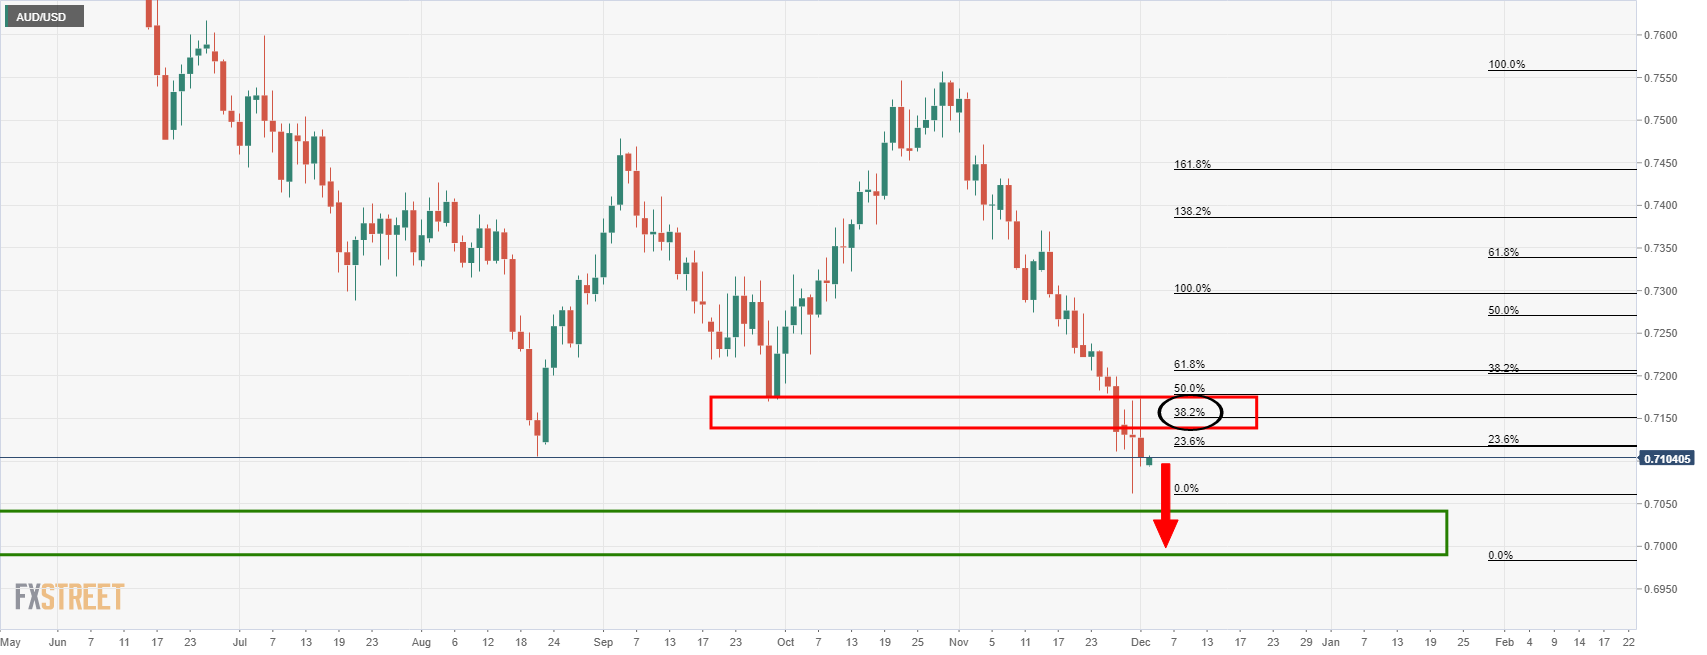
The price has already made a significant correction as per the wicks meeting the 38.2% Fibonacci retracement level . Therefore, there is a high probability of a downside continuation, especially with volatility as high as it is at the moment. The VIX has rallied through 30 and the DBCVIX USD Volatility Index is at the highest it has been since the start of the year.
-637739919150088109.jpeg)
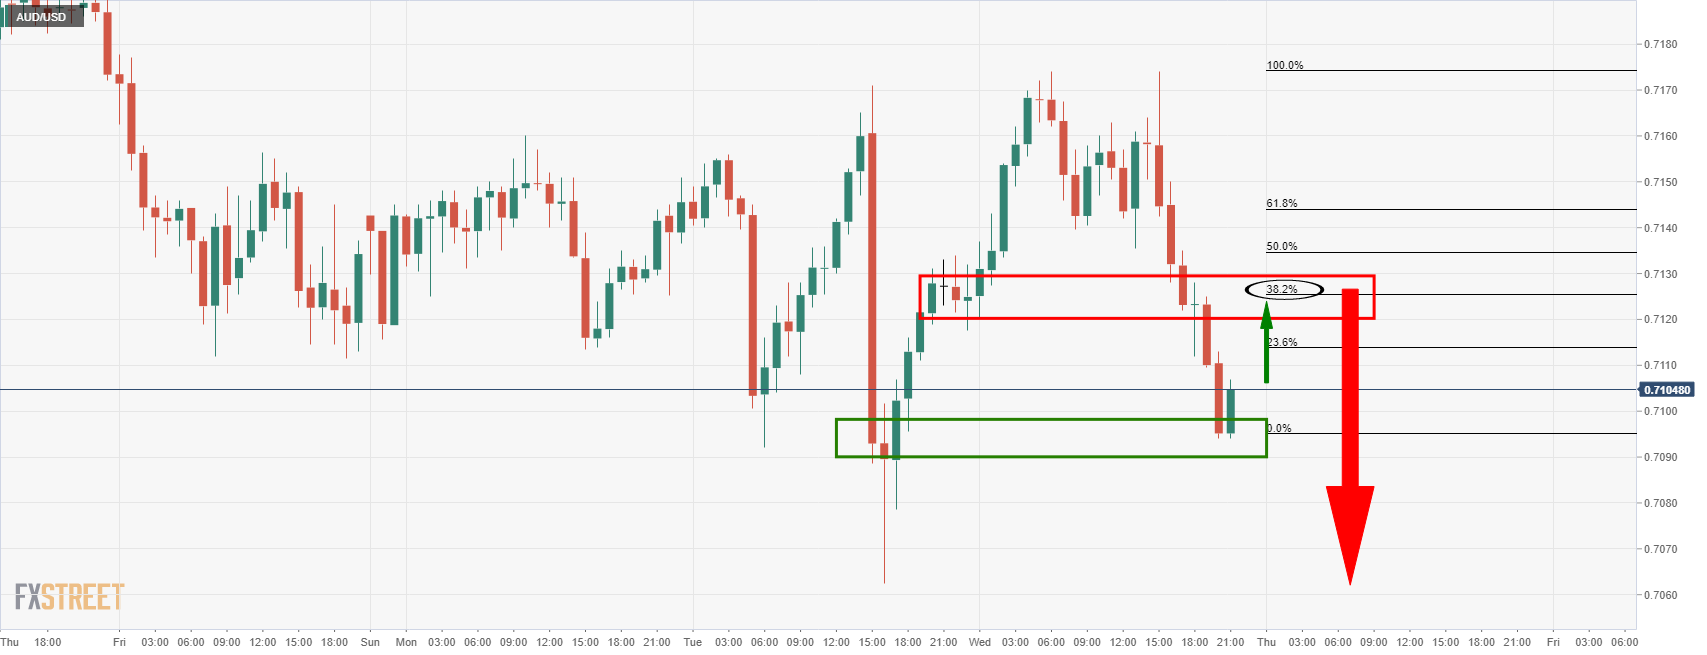
AUD/USD H1 chart
Meanwhile, the bulls are correcting on the lower time frames which bring in the 38.2% Fibonacci into scope for the meantime.