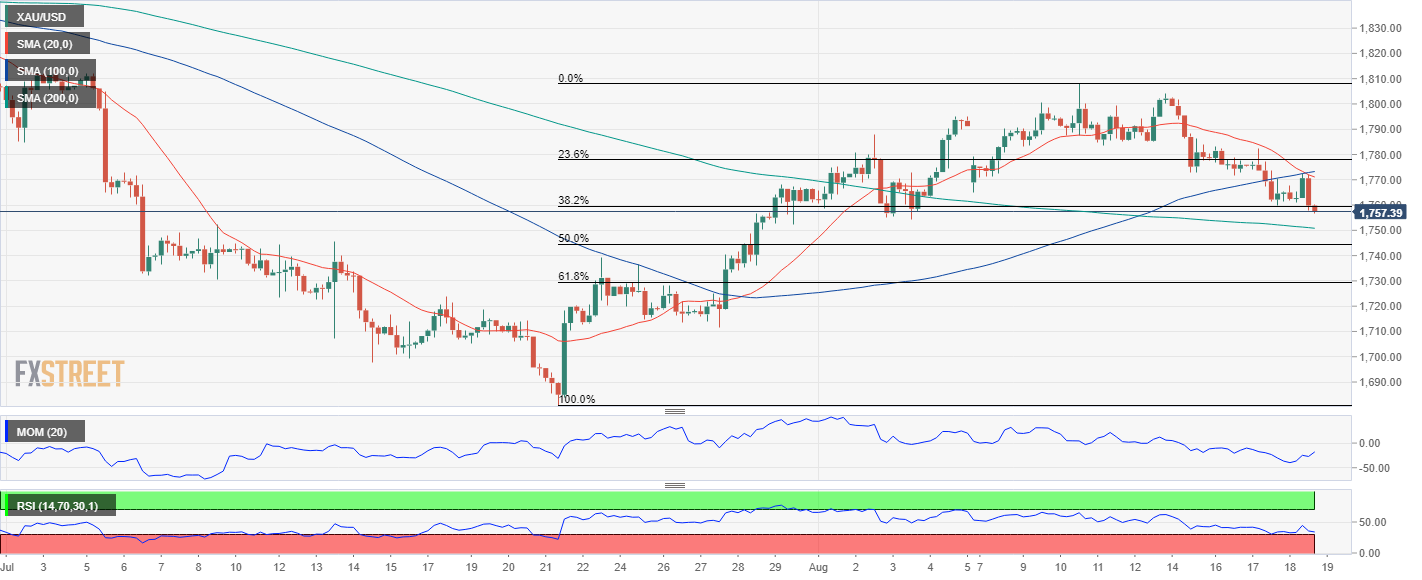
Gold Price Forecast: Bearish breakout underway
XAUUSD Current price: $1,757.39
- The US economy keeps giving signs of resilience despite global turmoil.
- Equities trade in the green while government bond yields ease.
- XAUUSD is trading at fresh weekly lows and is firmly bearish in the near term.
Spot gold is losing ground for a fourth consecutive day, trading at fresh weekly lows at around $1,757 a troy ounce. The bright metal suffers from renewed dollar strength, as US macroeconomic data suggest the economy remains resilient to the latest global woes, leaving room for the US Federal Reserve to maintain its aggressive stance.
The US central bank released the Minutes of its latest meeting on Wednesday, which showed many policymakers were worried about the risk of raising the rate benchmark to a level it would become more of a problem than a solution. Market players initially saw it as dovish. Furthermore, considering the extent of the next hike is now in doubt, as the Fed decided to cut its forward guidance.
Nevertheless, the latest US figures hint at a much better situation than initially feared. Inflation has finally begun easing while the employment sector remains solid. Additionally, other indicators related to business activity have surprised to the upside.
At the time being, European and American indexes trimmed early losses and post modest gains, while government bond yields ease, reflecting a better market mood amid decreasing risks of an economic downturn.
Gold price short-term technical outlook
Technically, the XAUUSD pair is at risk of falling further, piercing a critical Fibonacci support level at $1,759.10, the 38.2% retracement of the latest daily rally between $1,680.82 and $1,807.86. In the daily chart, gold failed to recover above its 20 SMA and quickly accelerated its slide, while the 100 SMA crosses below the 200 SMA, both far above the shorter one. Technical indicators, in the meantime, maintain their downward slopes after moving into negative territory.
The bearish potential is even clearer in the 4-hour chart, as technical indicators turned firmly lower below their midlines, while the 20 SMA crosses below the 100 SMA, providing dynamic resistance at around the daily high. The next Fibonacci support level comes at the $1,744.30 level, a probable bearish target for the upcoming sessions.
Support levels: 1,744.30 1,735.90 1,725.10
Resistance levels: 1,760.00 1,769.90 1,783.10


